SQL Server performance monitor data is a vast set of diverse metrics that provide a window into many areas of SQL Server performance. To get the most out of this data, it needs to be collected, stored, and maintained over a long period of time. This article explains a method of collecting SQL Server performance monitor data.
Given the choice, it is always better to be proactive and plan ahead rather than be forced to respond to emergencies when resources run low, or worse, run out.
By regularly sampling and retaining this data, long-term trends and capacity planning models can be constructed that allow an organization to make smart decisions about its resources with plenty of time to spare. This article walks through a process that collects performance monitor data, allowing it to be used for these purposes.
How should performance counter data be stored?
Since performance counters are not persisted in SQL Server, it falls to a developer or administrator to regularly poll dm_os_performance_counters, collect metrics, and store them in a permanent location.
The data can be stored in a similar fashion as it is returned in the view: one row per counter per sample, but I personally find it far easier to work with this data when it is pivoted so that there is a single column per counter per sample. It creates a smaller data set and one that benefits more from compression and columnstore indexes.
For the remainder of this article, a selection of performance counters be used to demonstrate their storage, collection, and usage. Assume that the list of counters used in any organization will vary from these 12 (possibly by a lot):
- Page life expectancy (Static value. Can be sampled at any point in time)
- Page reads (Cumulative value. Must be diffed between two points in time)
- Page writes (Cumulative value. Must be diffed between two points in time)
- Lazy writes (Cumulative value. Must be diffed between two points in time)
- Page lookups (Cumulative value. Must be diffed between two points in time)
- Target pages (Static value. Can be sampled at any point in time)
- Logins (Cumulative value. Must be diffed between two points in time)
- Logouts (Cumulative value. Must be diffed between two points in time)
- Temp Tables Created (Cumulative value. Must be diffed between two points in time)
- Batch Requests (Cumulative value. Must be diffed between two points in time)
- Compilations (Cumulative value. Must be diffed between two points in time)
- Recompilations (Cumulative value. Must be diffed between two points in time)
Note that the collection method is included in the list above to aid later in this article.
A table will be created to store this data that contains a row per sample time and a column per counter. This table includes a clustered columnstore index as it could get quite large and would benefit greatly from the added compression and rowgroup/segment elimination offered by it when performing analytics:
|
1 2 3 4 5 6 7 8 9 10 11 12 13 14 15 16 |
CREATE TABLE dbo.performance_counters ( sample_time_utc DATETIME2(3) NOT NULL, page_life_expectancy_seconds BIGINT NOT NULL, page_reads_per_second DECIMAL(18,4) NOT NULL, page_writes_per_second DECIMAL(18,4) NOT NULL, lazy_writes_per_second DECIMAL(18,4) NOT NULL, page_lookups_per_second DECIMAL(18,4) NOT NULL, target_pages BIGINT NOT NULL, logins_per_second DECIMAL(18,4) NOT NULL, logouts_per_second DECIMAL(18,4) NOT NULL, temp_tables_created_per_second DECIMAL(18,4) NOT NULL, batch_requests_per_second DECIMAL(18,4) NOT NULL, compilations_per_second DECIMAL(18,4) NOT NULL, recompilations_per_second DECIMAL(18,4) NOT NULL); CREATE CLUSTERED COLUMNSTORE INDEX CCI_performance_counters ON dbo.performance_counters; |
Note that while the counter values stored in dm_os_performance_counters are BIGINTs, DECIMAL(18,4) is used for many counters to support the math needed to calculate per-second numbers, which provides more value than raw numbers would. Units are included in all counters to make it easier to understand what they mean and how to use them.
If metrics are to be collected and aggregated across many servers, then adding a database server column would be an easy way to facilitate that. An additional non-clustered index on that column (plus the sample time) would be valuable if there were a need to perform calculations based on server rather than time.
Collecting performance counter data
With a table created to accept data from dm_os_performance_counters, a process can be built that regularly collects the data and stores it here. For the sake of brevity, this section will cover the key components to data collection only. The full script can be downloaded, reviewed, and tested at the reader’s leisure.
One key concern in this data collection is differentiating between the collection of static and cumulative counters. Most of the counters chosen to demo are cumulative, and thus the only way to measure them is to take the current sample, compare it to the last sample, and perform the necessary math to determine the metric over that time span. There are a handful of ways to manage this, but for simplicity and reliability, a new table will be created:
|
1 2 3 4 5 6 7 8 9 10 11 12 13 14 |
CREATE TABLE dbo.performance_counters_staging ( sample_time_utc DATETIME2(3) NOT NULL, page_reads_cumulative DECIMAL(18,4) NOT NULL, page_writes_cumulative DECIMAL(18,4) NOT NULL, lazy_writes_cumulative DECIMAL(18,4) NOT NULL, page_lookups_cumulative DECIMAL(18,4) NOT NULL, logins_cumulative DECIMAL(18,4) NOT NULL, logouts_cumulative DECIMAL(18,4) NOT NULL, temp_tables_created_cumulative DECIMAL(18,4) NOT NULL, batch_requests_cumulative DECIMAL(18,4) NOT NULL, compilations_cumulative DECIMAL(18,4) NOT NULL, recompilations_cumulative DECIMAL(18,4) NOT NULL, CONSTRAINT PK_performance_counters PRIMARY KEY CLUSTERED (sample_time_utc)); |
In addition, little history needs to be saved to this table, therefore it will not grow large and a standard clustered primary key is adequate. Realistically, only one previous sample is required to calculate what is needed for our process, but to play it safe and keep retention straightforward, this example will retain a single day of data.
In an effort to structure this project, the steps needed to collect this data are as follows:
- Collect a snapshot of all counters of interest into a temporary table.
- Determine the last sample time for the cumulative counters.
- Join the new counter data to the previous cumulative counter data.
- Insert the results into
dbo.performance_counters. - Insert the raw cumulative data into
dbo.performance_counters_staging. - Remove any staging data older than a day.
Note that there is no retention on dbo.performance_counters. This is intentional as it is built as a table to store performance counter data long-term. Retention may be added at the end of the process to limit storage to a reasonable time frame if needed. It’s advisable to keep at least 1-2 years of data, if it is to be used for capacity planning or other long term trending. Given the table’s small size, retaining it forever would not be expensive.
The process can run as often as is prudent, and that frequency would be determined by an organization and the environment being monitored. For an average database server, I’d consider starting at samples every minute and adjust more/less often as needed.
Collect a Snapshot
To reduce the performance impact of querying system views, there is a benefit in collecting counter data in a single query and putting it into a temporary table:
|
1 2 3 4 5 6 7 8 9 10 11 12 13 14 15 16 17 18 19 20 21 22 23 24 25 26 27 28 29 30 31 32 33 34 35 36 37 38 39 40 41 |
DECLARE @sample_time_utc DATETIME2(3) = GETUTCDATE(); CREATE TABLE #performance_counters ( sample_time_utc DATETIME2(3) NOT NULL, page_life_expectancy_seconds BIGINT NOT NULL, page_reads_cumulative DECIMAL(18,4) NOT NULL, page_writes_cumulative DECIMAL(18,4) NOT NULL, lazy_writes_cumulative DECIMAL(18,4) NOT NULL, page_lookups_cumulative DECIMAL(18,4) NOT NULL, target_pages BIGINT NOT NULL, logins_cumulative DECIMAL(18,4) NOT NULL, logouts_cumulative DECIMAL(18,4) NOT NULL, temp_tables_created_cumulative DECIMAL(18,4) NOT NULL, batch_requests_cumulative DECIMAL(18,4) NOT NULL, compilations_cumulative DECIMAL(18,4) NOT NULL, recompilations_cumulative DECIMAL(18,4) NOT NULL); INSERT INTO #performance_counters (sample_time_utc, page_life_expectancy_seconds, page_reads_cumulative, page_writes_cumulative, lazy_writes_cumulative, page_lookups_cumulative, target_pages, logins_cumulative, logouts_cumulative, temp_tables_created_cumulative, batch_requests_cumulative, compilations_cumulative, recompilations_cumulative) SELECT @sample_time_utc, SUM(CASE WHEN dm_os_performance_counters.counter_name = 'Page life expectancy' THEN dm_os_performance_counters.cntr_value ELSE 0 END) AS page_life_expectancy_seconds, SUM(CASE WHEN dm_os_performance_counters.counter_name = 'Page reads/sec' THEN dm_os_performance_counters.cntr_value ELSE 0 END) AS page_reads_cumulative, SUM(CASE WHEN dm_os_performance_counters.counter_name = 'Page writes/sec' THEN dm_os_performance_counters.cntr_value ELSE 0 END) AS page_writes_cumulative, SUM(CASE WHEN dm_os_performance_counters.counter_name = 'Lazy writes/sec' THEN dm_os_performance_counters.cntr_value ELSE 0 END) AS lazy_writes_cumulative, SUM(CASE WHEN dm_os_performance_counters.counter_name = 'Page lookups/sec' THEN dm_os_performance_counters.cntr_value ELSE 0 END) AS page_lookups_cumulative, SUM(CASE WHEN dm_os_performance_counters.counter_name = 'Target pages' THEN dm_os_performance_counters.cntr_value ELSE 0 END) AS target_pages, SUM(CASE WHEN dm_os_performance_counters.counter_name = 'Logins/sec' THEN dm_os_performance_counters.cntr_value ELSE 0 END) AS logins_cumulative, SUM(CASE WHEN dm_os_performance_counters.counter_name = 'Logouts/sec' THEN dm_os_performance_counters.cntr_value ELSE 0 END) AS logouts_cumulative, SUM(CASE WHEN dm_os_performance_counters.counter_name = 'Temp Tables Creation Rate' THEN dm_os_performance_counters.cntr_value ELSE 0 END) AS temp_tables_created_cumulative, SUM(CASE WHEN dm_os_performance_counters.counter_name = 'Batch Requests/sec' THEN dm_os_performance_counters.cntr_value ELSE 0 END) AS batch_requests_cumulative, SUM(CASE WHEN dm_os_performance_counters.counter_name = 'SQL Compilations/sec' THEN dm_os_performance_counters.cntr_value ELSE 0 END) AS compilations_cumulative, SUM(CASE WHEN dm_os_performance_counters.counter_name = 'SQL Re-Compilations/sec' THEN dm_os_performance_counters.cntr_value ELSE 0 END) AS recompilations_cumulative FROM sys.dm_os_performance_counters WHERE (dm_os_performance_counters.object_name LIKE '%Buffer Manager%' AND dm_os_performance_counters.counter_name IN ('Page life expectancy', 'Page reads/sec', 'Page writes/sec', 'Lazy writes/sec', 'Page lookups/sec', 'Target pages')) OR (dm_os_performance_counters.object_name LIKE '%General Statistics%' AND dm_os_performance_counters.counter_name IN ('Logins/sec', 'Logouts/sec', 'Temp Tables Creation Rate')) OR (dm_os_performance_counters.object_name LIKE '%SQL Statistics%' AND dm_os_performance_counters.counter_name IN ('Batch Requests/sec', 'SQL Compilations/sec', 'SQL Re-Compilations/sec')) |
The syntax looks a bit messy but performs as well as a PIVOT or some other method would. The goal is to hit dm_os_performance_counters a single time and not need to revisit it for different subsets of counters. The T-SQL above will generate a single row of data with all of the requested metrics placed into the temporary table.
Determine the Last Sample Time for Cumulative Counters
For the cumulative counters, it is necessary to compare the values just collected against the last sample taken. If no previous sample has been taken, then this sample time will be NULL and results for these counters will not be collected until the next time this process runs.
|
1 2 3 4 5 6 7 8 9 10 11 12 13 14 15 16 |
DECLARE @last_sample_time datetime2(3); SELECT @last_sample_time = MAX(performance_counters_staging.sample_time_utc) FROM dbo.performance_counters_staging; -- Do not create performance data for the first run. --Instead, only seed the cumulative counters for the next run. IF @last_sample_time IS NOT NULL BEGIN DELETE performance_counters_staging FROM dbo.performance_counters_staging WHERE performance_counters_staging.sample_time_utc < DATEADD(DAY, -1, @last_sample_time); DECLARE @seconds_since_last_execution INT; SELECT @seconds_since_last_execution = DATEDIFF(SECOND, @last_sample_time, @sample_time_utc); |
This is straightforward and checks the staging table for the last sample time and stores it in a variable for use soon. The remainder of this process will be nested within an IF statement, ensuring that the first run of this code will not generate any performance counter data. Instead, staging data will be populated and a full data set generated on the next run.
This includes the deletion of any staging data more than a day older than the last sample time, which ensures this table does not get overly large. An administrator may wish to keep the raw numbers for telemetry purposes for a longer period of time, and if so, this retention can be adjusted accordingly here.
Calculate Metrics and Insert into Performance Counter Table
For the two point-in-time metrics, the work is simple, but for the cumulative counters, some logic needs to be added to compare with the previous value and also calculate the per-second metric.
|
1 2 3 4 5 6 7 8 9 10 11 12 13 14 15 16 17 18 19 20 21 22 23 24 25 26 27 28 29 30 31 32 33 34 35 36 37 38 39 40 41 42 43 44 45 46 47 48 49 50 51 52 53 54 55 56 57 58 |
INSERT INTO dbo.performance_counters (sample_time_utc, page_life_expectancy_seconds, page_reads_per_second, page_writes_per_second, lazy_writes_per_second, page_lookups_per_second, target_pages, logins_per_second, logouts_per_second, temp_tables_created_per_second, batch_requests_per_second, compilations_per_second, recompilations_per_second) SELECT performance_counters.sample_time_utc, performance_counters.page_life_expectancy_seconds, CASE WHEN performance_counters.page_reads_cumulative >= performance_counters_staging.page_reads_cumulative THEN performance_counters.page_reads_cumulative - performance_counters_staging.page_reads_cumulative ELSE performance_counters.page_reads_cumulative END / @seconds_since_last_execution AS page_reads_per_second, CASE WHEN performance_counters.page_writes_cumulative >= performance_counters_staging.page_writes_cumulative THEN performance_counters.page_writes_cumulative - performance_counters_staging.page_writes_cumulative ELSE performance_counters.page_writes_cumulative END / @seconds_since_last_execution AS page_writes_per_second, CASE WHEN performance_counters.lazy_writes_cumulative >= performance_counters_staging.lazy_writes_cumulative THEN performance_counters.lazy_writes_cumulative - performance_counters_staging.lazy_writes_cumulative ELSE performance_counters.lazy_writes_cumulative END / @seconds_since_last_execution AS lazy_writes_per_second, CASE WHEN performance_counters.page_lookups_cumulative >= performance_counters_staging.page_lookups_cumulative THEN performance_counters.page_lookups_cumulative - performance_counters_staging.page_lookups_cumulative ELSE performance_counters.page_lookups_cumulative END / @seconds_since_last_execution AS page_lookups_per_second, performance_counters.target_pages, CASE WHEN performance_counters.logins_cumulative >= performance_counters_staging.logins_cumulative THEN performance_counters.logins_cumulative - performance_counters_staging.logins_cumulative ELSE performance_counters.logins_cumulative END / @seconds_since_last_execution AS logins_per_second, CASE WHEN performance_counters.logouts_cumulative >= performance_counters_staging.logouts_cumulative THEN performance_counters.logouts_cumulative - performance_counters_staging.logouts_cumulative ELSE performance_counters.logouts_cumulative END / @seconds_since_last_execution AS logouts_per_second, CASE WHEN performance_counters.temp_tables_created_cumulative >= performance_counters_staging.temp_tables_created_cumulative THEN performance_counters.temp_tables_created_cumulative - performance_counters_staging.temp_tables_created_cumulative ELSE performance_counters.temp_tables_created_cumulative END / @seconds_since_last_execution AS temp_tables_created_per_second, CASE WHEN performance_counters.batch_requests_cumulative >= performance_counters_staging.batch_requests_cumulative THEN performance_counters.batch_requests_cumulative - performance_counters_staging.batch_requests_cumulative ELSE performance_counters.batch_requests_cumulative END / @seconds_since_last_execution AS batch_requests_per_second, CASE WHEN performance_counters.compilations_cumulative >= performance_counters_staging.compilations_cumulative THEN performance_counters.compilations_cumulative - performance_counters_staging.compilations_cumulative ELSE performance_counters.compilations_cumulative END / @seconds_since_last_execution AS compilations_per_second, CASE WHEN performance_counters.recompilations_cumulative >= performance_counters_staging.recompilations_cumulative THEN performance_counters.recompilations_cumulative - performance_counters_staging.recompilations_cumulative ELSE performance_counters.recompilations_cumulative END / @seconds_since_last_execution AS recompilations_per_second FROM #performance_counters performance_counters INNER JOIN dbo.performance_counters_staging ON performance_counters_staging.sample_time_utc = @last_sample_time; END |
Since a service restart will reset cumulative counters, it is necessary to check if the current value is larger than the previous value. If so, then subtract to get the difference. If the current value is less, then simply use that value as the counter value.
The counter rate per second is calculated by dividing the amount that the counter incremented by since the last sample by the number of seconds since the last sample.
Populate Raw Cumulative Counter Data
This final INSERT ensures that a snapshot of cumulative counters is retained for posterity.
|
1 2 3 4 5 6 7 8 9 10 11 12 13 14 15 16 17 18 19 20 21 |
INSERT INTO dbo.performance_counters_staging (sample_time_utc, page_reads_cumulative, page_writes_cumulative, lazy_writes_cumulative, page_lookups_cumulative, logins_cumulative, logouts_cumulative, temp_tables_created_cumulative, batch_requests_cumulative, compilations_cumulative, recompilations_cumulative) SELECT sample_time_utc, page_reads_cumulative, page_writes_cumulative, lazy_writes_cumulative, page_lookups_cumulative, logins_cumulative, logouts_cumulative, temp_tables_created_cumulative, batch_requests_cumulative, compilations_cumulative, recompilations_cumulative FROM #performance_counters; |
Putting it All Together
When the entire process is pieced together and executed for the first time, it will place data into the staging table only:

These represent raw, cumulative counters for ten of the twelve metrics we are going to track.
When the same process is executed again, the staging table gets a second row, and the primary counter table is populated with its first complete row:
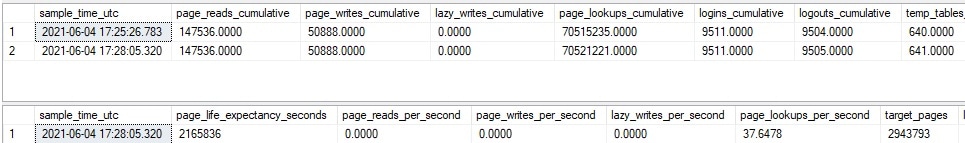
With this and each subsequent run, a row will be placed in dbo.performance_counters (the bottom result set) that contains both the point-in-time and cumulative counters. The calculation that converts raw/cumulative numbers into rates can be observed with the following example from the data above:
17:25:26.783: Page Lookup Count (Cumulative): 70515235
17:28:05.320: Page Lookup Count (Cumulative): 70521221
Difference: 5986 Page Lookups
Seconds Between Samples: 159
Page Lookups Per Second = 5986 / 159 = 37.65
The final step to collecting this data is to schedule a job or task that executes this code regularly, adding a row to dbo.performance_counters on each run.
The script included in this article contains the full stored procedure code for dbo.populate_performance_counters, which takes all of the code above and packages it into a single stored procedure for easy use by a developer or administrator.
This process is meant for customization and is of most value when tailored to the environment that is to use it. If multiple servers are to be monitored, then run the stored procedure presented here on each server and then (if needed) have a centralized process that collects this data regularly and stores it for central analysis.
The only alteration to the table structure for the centralized table would be the addition of a column to store the source database server name and possibly an index to support searches on that column.
Customization
Since dm_os_performance_counters contains a wide variety of performance counters, it is natural that only a small subset will be useful to any one person, and that specific subset will vary from organization to organization. For the purpose of this article, a selection of what I considered to be some of the more useful performance counters were chosen.
Adding or removing counters can follow the patterns illustrated in this code and should not be difficult. To add a counter, follow a process similar to this:
- Add a column to
dbo.performance_countersfor the new counter. - If the counter is cumulative, then also add it to
dbo.performance_counters_staging.
Within the stored procedure:
- Add the counter to
#performance_counters. - Add the counter to the
INSERT/SELECTinto#performance_counters - Add the counter to the
INSERTintodbo.performance_counters. - If the counter is cumulative, then also add it to the
INSERTintodbo.performance_counters_staging.
To remove a counter, follow a similar process to what is outlined above, but instead of adding a counter, remove it instead.
While no database-scoped counters were included in the examples above, they can be added via similar processes. If the number of databases to be tracked is small and finite, then adding them to the tables already presented here makes sense. If the number of databases is large or variable, then creating a separate table for them is a more scalable solution.
In the latter scenario, the database name would be added as a column in a new table and a row would be inserted per sample time per database. A separate table for database-scoped counters is the easiest way to avoid confusion between server and database metrics and a need to differentiate between them whenever querying one single table.
Monitoring vs. capacity planning and analytics
Before wrapping up this discussion of performance monitor data, it is important to differentiate between two functional uses of these metrics:
- Monitoring and Alerting
- Analytics and Capacity Planning
The code in this article captures performance monitor metrics for long-term storage and is ideally used for capacity planning and analytics. It can help identify long-term trends and allow developers and administrators to plan ahead, avoiding resource crunches and emergencies.
For example, a long-term downward trend of page life expectancy indicates an impending memory shortage. This may be caused by code, increased usage, more data, or something else. Seeing the long-term trend and identifying this challenge with months to spare would allow for additional memory to be purchased and allocated. If a release were to blame, it would provide the time needed to research and resolve those code changes before becoming a systemic problem. If the cause were unclear, time would be available to research and find it before it is too late.
While this data can be used for monitoring, it is not in of itself a monitoring tool. Having a reliable SQL Server monitoring tool is an invaluable resource that can:
- Alert in the event of immediate problems.
- Help identify code or resource problems.
- Let you know when resources run low at certain times of the day.
- Correlate an app problem to the code or configuration causing it.
Always consider the tools used for monitoring database servers. If you are in need of a tool for the job, consider Redgate’s SQL Monitor. The time (and sleep!) saved by having a reliable monitoring tool is significant; therefore it is worth the time needed to test and implement one.
Collecting SQL Server performance monitor data
Performance counter data is exceptionally useful, but its value cannot be fully realized until it is reliably collected and stored for future use. The more data that is retained, the more value it has. Trending IO for a week may be useful, but being able to evaluate it over a full year (or longer) will provide far more perspective and the ability to make better decisions that can stretch far into the future.
The value in a process like this is versatility, and by customizing the data and usage, a developer or administrator can learn a great deal about their database servers and the underlying databases. No single set of metrics applies to everyone and by tailoring a data set to an organization’s specific needs, an ideal set of data can be maintained that allows for database servers to be effectively analyzed and planned for over time. As conditions change, metrics can be added or removed, ensuring that even as data evolves, the ability to understand it is not compromised.
If you like this article, you might also like SQL Server performance monitor data: Introduction and usage

Load comments