Are you having performance issues with your applications? Maybe it’s time you make use of profiling tools. If you have Visual Studio applications, you’ll want to know the most popular Visual Studio profiling tools available.
Visual Studio, Microsoft(R) Visual Studio or VS is a very popular integrated development environment (IDE) for Microsoft Windows. There is no debate that VS is a massive help for developers when writing computer programs, web applications and even web services. Visual Studio is very well-known for its robust features and its ability to support several programming languages.
One of the IDE’s most valuable features is its variety of profiling tools. These tools help diagnose different performance issues within your application, no matter what your application type is.
In this article, you will find the most common Visual Studio profiling tools.
Performance profiling is another level of application diagnostics that makes sure your applications are more efficient and performing better than other applications in the market. Sadly, not all developers see the necessity of this diagnostic process.
Before launching an application, debugging processes and performance metrics are performed to ensure that the application works at top performance. Monitoring the application’s behavior comes next, making sure that it compiles and runs smoothly.
Some developers want to innovate and know more about what their applications have to offer. These developers often dig deeper into the diagnostics, and that’s where profiling comes into place.
Profiling is about measuring the performance of the application’s data while running. We capture this performance data and analyze it using different metrics. For example, your application is running smoothly and performing as expected, when suddenly it starts having issues. By using profiling tools, you will find insights and reports on the application’s performance, uncover the root cause of the problem and identify solutions to help your application run as fast or even faster than your competitors’.
As mentioned before, there is no single metric for performance profiling, yet there are tons of tools you can use to measure your application’s performance. To ease your burden, here is a list of Visual Studio profiling tools you can use.
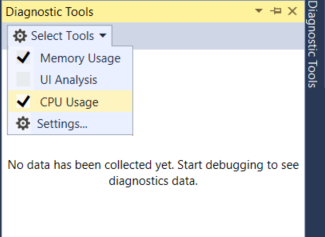
If you don’t know it yet, you’ll find that Visual Studio has many built-in profiling tools. As a matter of fact, you can access them during a debugging session. All you need to do is check them in the Diagnostic Tools window. Click Debug ➡ Windows ➡ Show Diagnostic Tools. If you prefer shortcuts, simply press Ctrl + Alt + F2.
Most are very familiar with tooltips that pop up on software, and PerfTips are very similar. PerfTips are tool tips with performance information and provide helpful guidance for developers. PerfTips are displayed in the editor at the end of the code line with information indicating the length that the program is running on its last breakpoint.
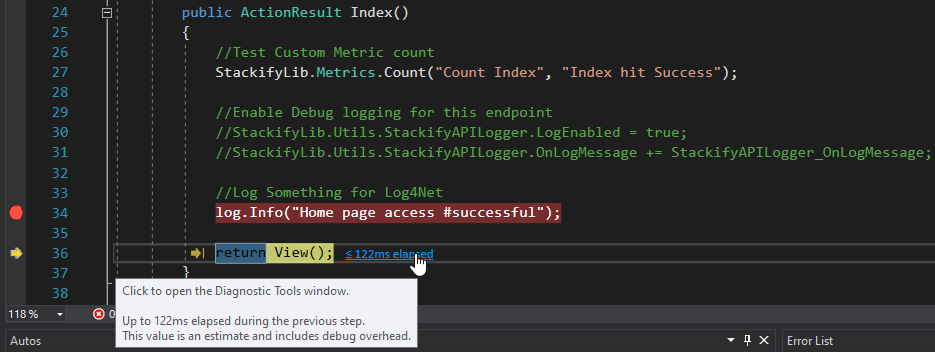
The PerfTip is actually a link that will send you the Diagnostic Tools Window to see the history of the PerfTip values.
Both the Diagnostic Tools and PerfTip are helpful tools to spot performance problems while debugging the application. However, you can always turn these diagnostics on or off.
Memory Usage is undoubtedly valuable for performance profiling and is a staple to Visual Studio profiling tools. It can run on .NET Core, native scenarios, different application types and even mixed-mode applications.
Features:
CPU usage is another staple in the list of Visual Studio performance profiling tools. Why? Because CPU utilization and usage issues are a widespread concern for every development team. This Visual Studio tool is always the go-to tool for every CPU investigation.
The CPU usage tool is very flexible. You can run this tool on an open Visual Studio project, on an installed MS Store application or a running application or process. That’s not all. You can even run this Visual Studio profiling tool with or without debugging.
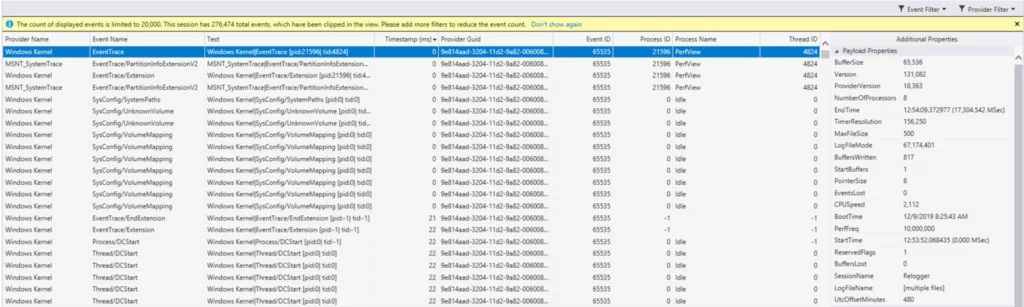
Events viewer is a new tool developed for Visual Studio. What does it do? It displays application activity through events like module, load, thread start and system configuration. This also looks into ETW and NetRace-based events.
Main features include:
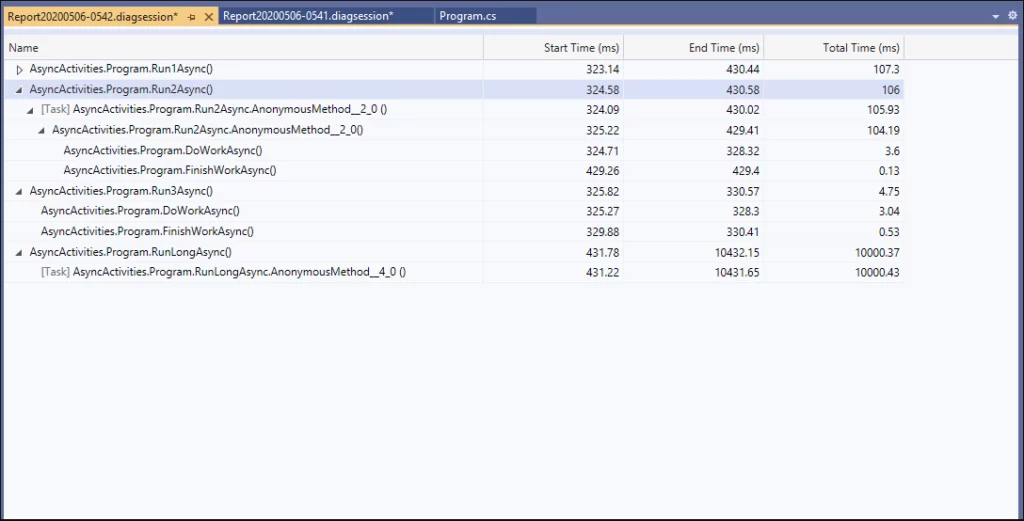
The .NET Async tool enables developers to analyze the performance of .NET asynchronous code in their applications. Additionally, the tool marvelously organizes asynchronous events into chronological order, displaying each async task, the start/stop time, duration and how the overlapping occurs.
The .NET Async tool is relatively new to Visual Studio but is potentially very useful. By tracking and monitoring asynchronous codes, you get more visualization when issues start happening.
Another new addition to the Visual Studio tools is the .NET Perf Counter tool. This performance profiling tool allows you to see visual .NET counters within the Visual Studio profiler, which helps in visualizing the initial start of your investigation when performance problems occur.
You will see a detailed report showing the counter’s minimum, maximum and average value in your selected time range.
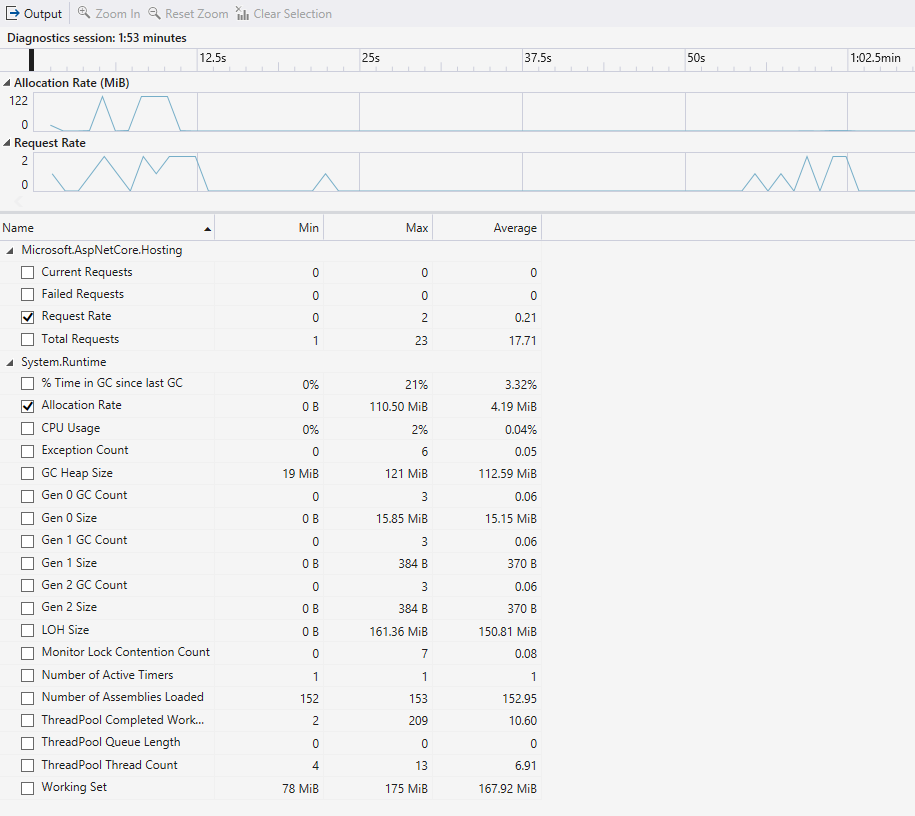
The tool’s main features include:
To use the .NET Perf Counter tool, you’ll need Visual Studio 2019 version 16.7, which is available on Windows desktop but with .NET core only.
Learn How to use Performance Counters with .NET Core.
And there you have it! A list of Visual Studio profiling tools, each as helpful as the next. The only thing that matters is using tools wisely for your applications.
Other than these Visual Studio tools, you can find robust profiling tools that can help improve your application’s performance. When it comes to performance profiling, you have Stackify Retrace. More than just an APM tool, Retrace actively helps developers identify performance bottlenecks in their applications and provides centralized logging, error tracking and real user monitoring.
If you are looking for a code profiler, Prefix is your go-to tool. Prefix is the best sidekick for every developer. It is a lightweight and user-friendly code profiler to help improve your code.
What are you waiting for? Start your 14-day FREE TRIAL today and be impressed.
Stackify's APM tools are used by thousands of .NET, Java, PHP, Node.js, Python, & Ruby developers all over the world.
Explore Retrace's product features to learn more.
If you would like to be a guest contributor to the Stackify blog please reach out to [email protected]


