What is known about software effort estimation in 2021
What do we know about software effort estimation, based on evidence?
The few publicly available datasets (e.g., SiP, CESAW, and Renzo) involve (mostly) individuals estimating short duration tasks (i.e., rarely more than a few hours). There are other tiny datasets, which are mostly used to do fake research. The patterns found across these datasets include:
- developers often use round-numbers,
- the equation:
 , where
  is a constant that varies between projects, often explains around 50% of the variance present in the data. This equation shows that developers under-estimate short tasks and over-estimate long tasks. The exponent,
  , applies across most projects in the data,
 - individuals tend to either consistently over or under estimate,
- developer estimation accuracy does not change with practice. Possible reasons for this include: variability in the world prevents more accurate estimates, developers choose to spend their learning resources on other topics.
Does social loafing have an impact on actual effort? The data needed to answer this question is currently not available (the available data mostly involves people working on their own).
When working on a task, do developers follow Parkinson’s law or do they strive to meet targets?
The following plot suggests that one or the other, or both are true (data):
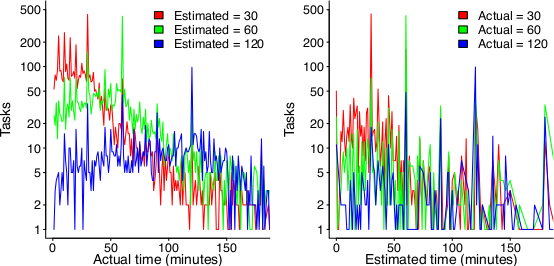
On the left: Each colored lines shows the number of tasks having a given actual implementation time, when they were estimated to take 30, 60 or 120 minutes (the right plot reverses the role of estimate/actual). Many of the spikes in the task counts are at round numbers, suggesting that the developer has fixated on a time to finish and is either taking it easy or striving to hit it. The problem is distinguishing them mathematically; suggestions welcome.
None of these patterns of behavior appear to be software specific. They all look like generic human behaviors. I have started emailing researchers working on project analytics in other domains, asking for data (no luck so far).
Other patterns may be present for many projects in the existing data, we have to wait for somebody to ask the right question (if one exists).
It is also possible that the existing data has some unusual characteristics that don’t apply to most projects. We won’t know until data on many more projects becomes available.
Any information about the accuracy of developers who had worked through Watts’ PSP? As a personal anecdote, I never accepted an estimate of less than 4h.
@Nemo
The CESAW dataset comes from projects that used the Team Software Process, the team variant of PSP.
If you keep to the rule of measuring everything, then some very tiny tasks end up with estimates. Watts Humphrey even treated compile time error as defects, an approach that certainly inflates the defect count.
Compile defects increase the count total, but add useful information because compile defects were moderately predictive of later defects. Moreover, compile was the only completely reproducible defect detection method prior to good quality static analysis tools.
We found that counting all defects, including compile, resulted in average of somewhere between 80 and 120 defects per KLOC. 1 in 10 LOC was pretty normal. Compile defects are also almost always quick fixes.
When IDE started being used, it became harder to get compile defects, and the totals came down to 40-60 def/KLOC or so. We never noticed any effect on test defects though, and the course still worked perfectly well. Frankly, I don’t think the IDE add much quality value and arguably are a needless distraction.
@Nemo
4H is perfectly reasonable. If it gets much smaller it hardly seems worth tracking separately.
Fortunately, the tracking overhead is far smaller than people think and the planning has enough automation that it enabled small unit estimates.
We advised 2-4 tasks per week, and figured about 16 direct hours in a typical week (4Hours!). The smaller times sometimes result from algorithmic assignments of effort to phase (activity) for things like compile. This coupled with the trend toward smaller and smaller components, resulted in some short times. If we aggregate the phases, you will find far fewer tasks much shorter than 4H.
We taught how to subdivide a task into sub-components (estimation by parts) and track effort for the overall task iteratively, but but the mini-waterfall is pretty heavily embedded into peoples natural mental accounting.