There’s no question whether testing is important to the evolution of your APIs, especially when they come in an automated manner. Many teams also lack documentation of all sorts to guide new people on understanding and using the endpoints. This article covers documenting and testing APIs with Postman.
You probably have heard about Postman, the famous collaboration platform for API development and testing. Yes, testing. Many developers don’t know the power that Postman can add to their daily lives in automating API tests. The possibility of sharing your test collections along with your team and working together on them is even better.
In this article, you’re going to dive into the universe of documenting and testing your APIs with Postman. You’ll also get to see some nice tips on discovering some hidden features of the tool that’ll facilitate your automation and increase productivity.
Setup
The first step includes Postman installation. Although there’s a web version available, the Desktop version is faster. Additionally, I’d advise you to create an account and stay logged in because that’ll allow Postman to keep your collections and tests synched.
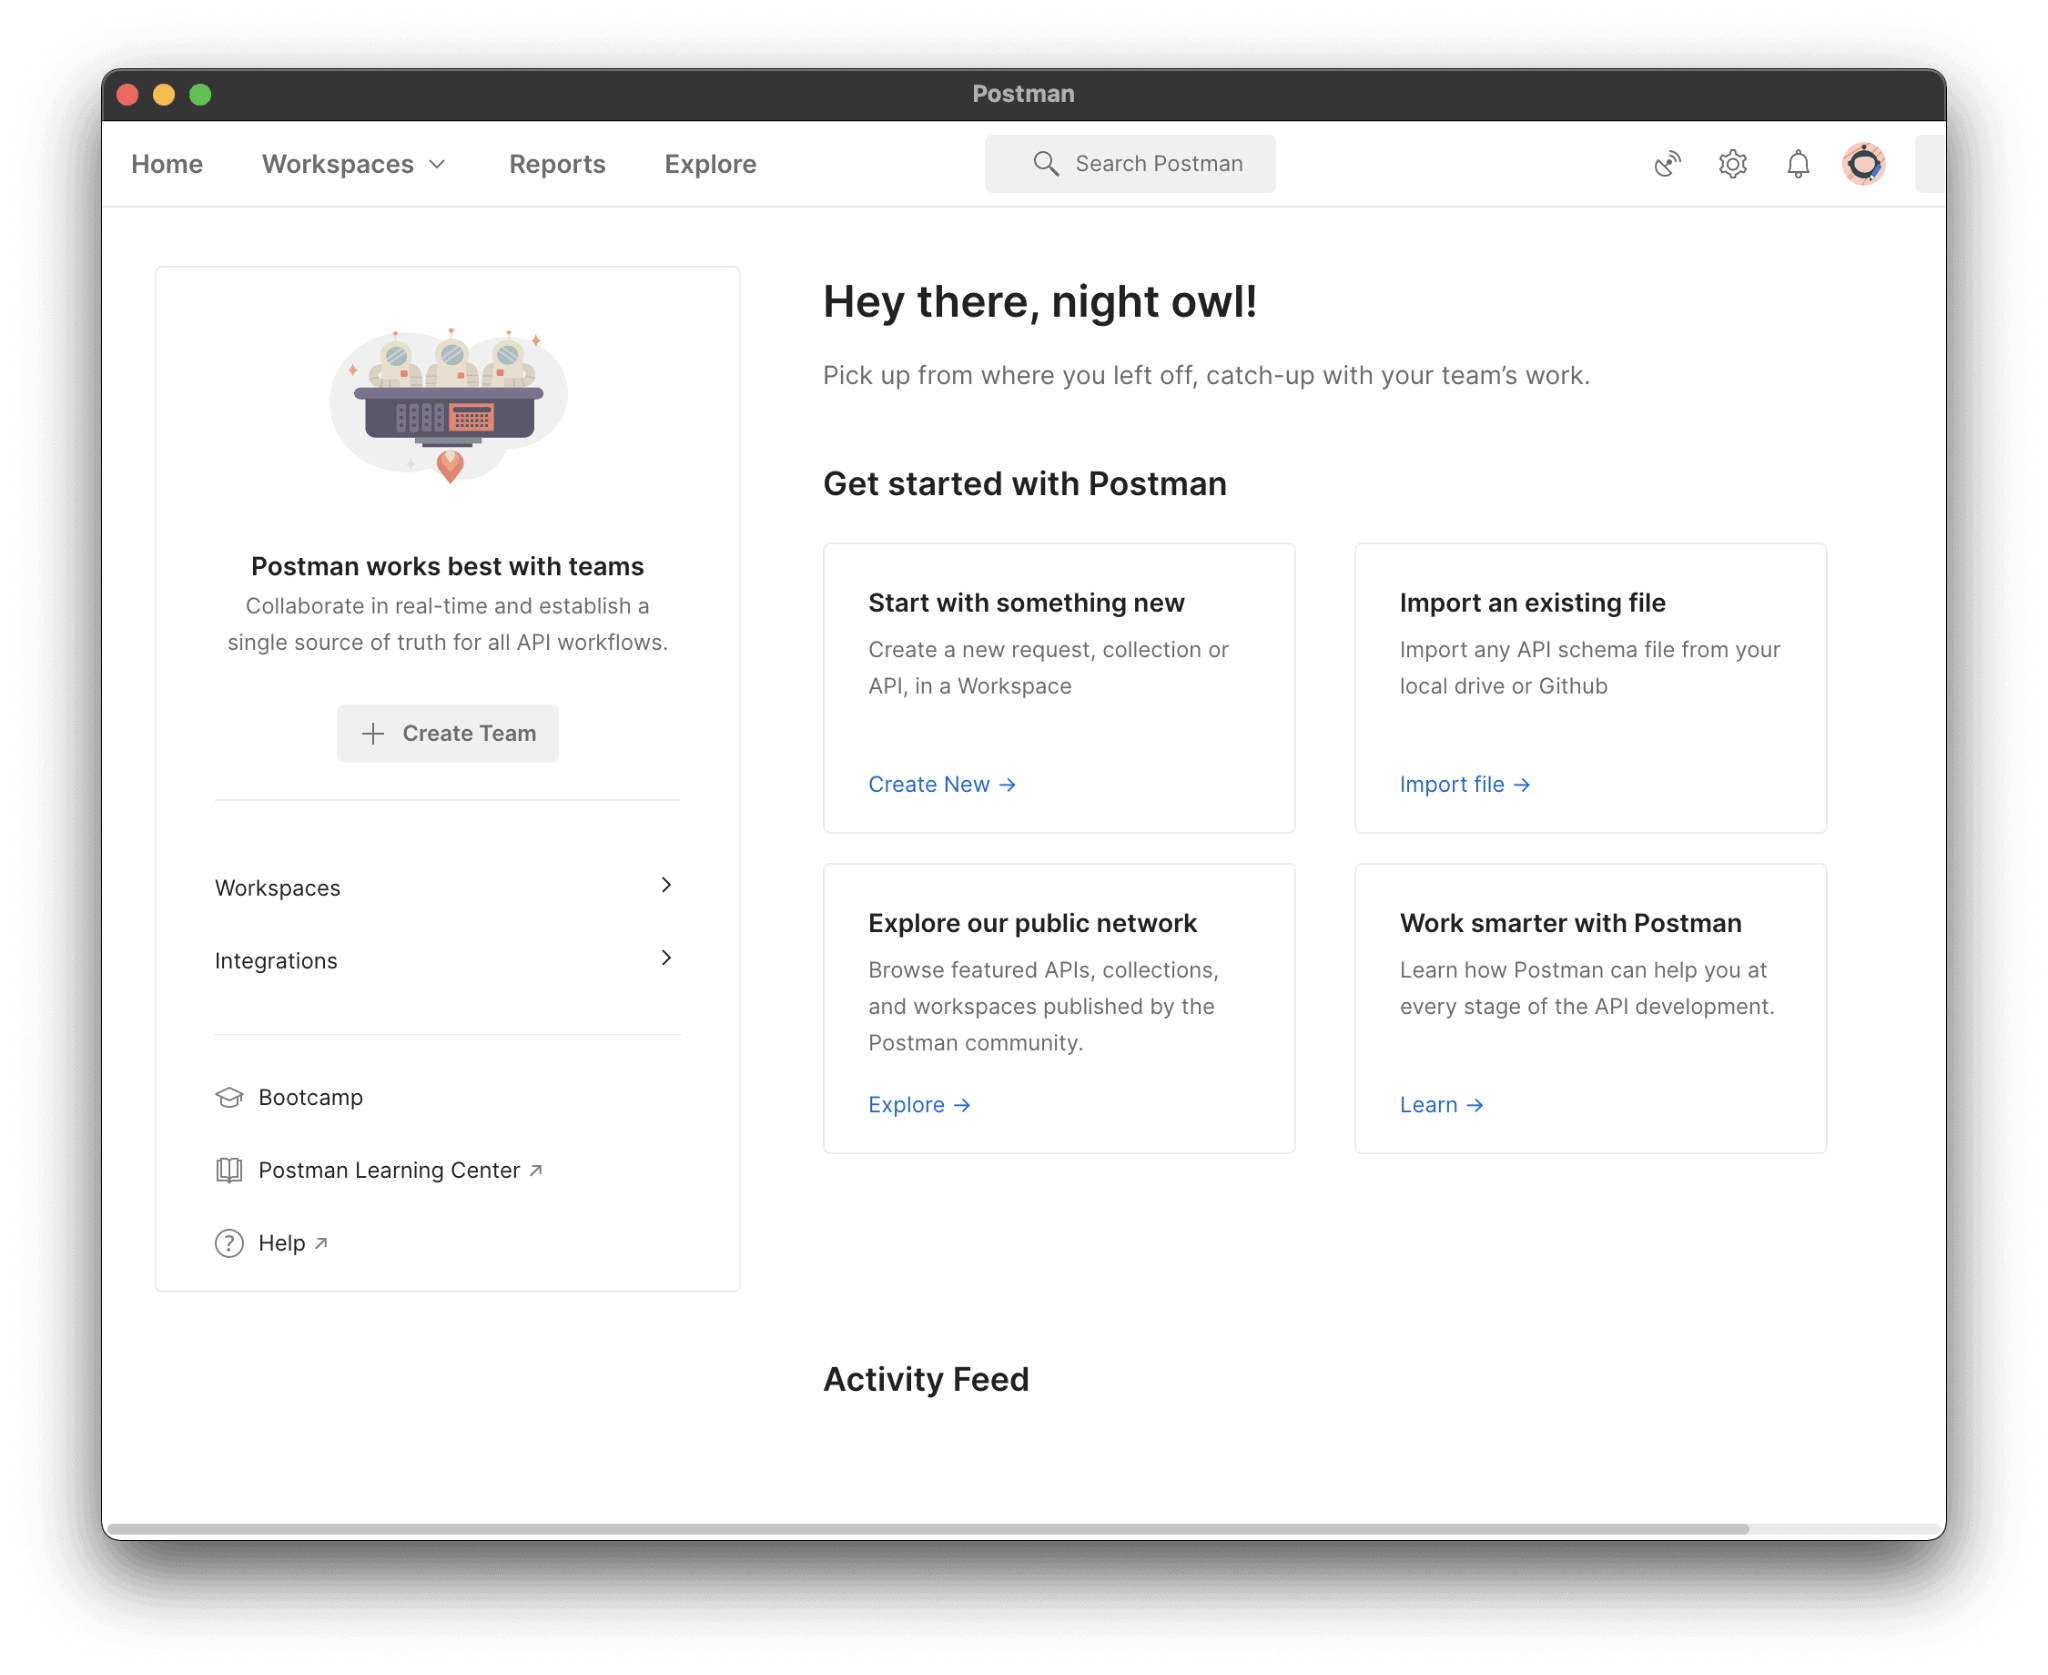
Figure 1. Postman home screen
The API
For this article, you can use whatever API you’ve created or are working with. The only requirement is that you have, at least, most of the HTTP verbs related to CRUD operations. However, to demonstrate, I’ll stick to an API made with ASP.NET, the CRUD API I’ve developed before in another article: Creating ASP.NET Apps with React.
Make sure to clone the project to your machine. Then, cd into the \ReactASPNET\ReactASPCrud\ReactASPCrud folder, and run the following command:
|
1 |
dotnet run |
Once the command terminal prints the “Application started” message, the app is up and running at http://localhost:5000.
Postman: First steps
Postman is divided into workspaces. Each workspace corresponds to a set of configurations, collections, and endpoints specific to it. It’s a great way to separate your APIs from the ones of your workplace, for example.
Right at the home page, click the Workspaces option and select My Workspace at the following screen.
The two main sections you’ll be working with are:
- Collections: Postman collections are a set of endpoints that have things in common and make sense to stick together;
- Environments: The environments are a great feature Postman provides you to set up specific configs for each environment you may have (e.g., local, development, test, etc.).
Environments
Since the collections make use of environment variables, start with them. On the left panel, click the Environments section and then click on the link Create Environment as shown in Figure 2.
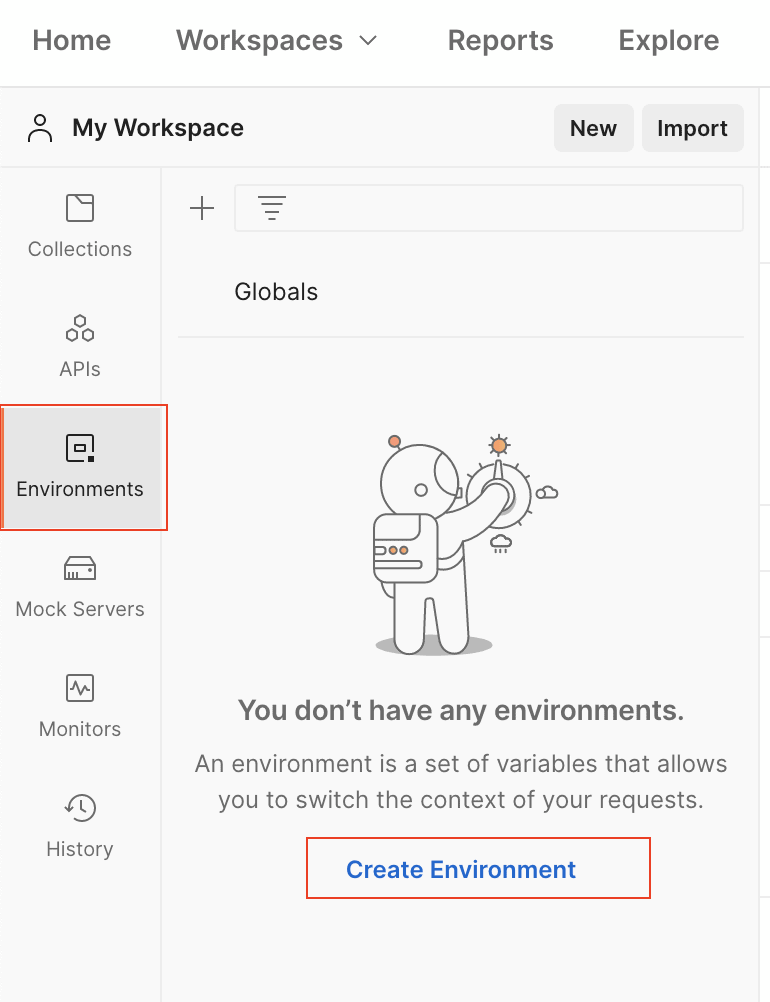
Figure 2. Creating a new environment
That’ll open a new tab with a field to set a name for this environment. Call it LOCAL since it’ll store the configs for your localhost API. If you host your API in different envs such as development and production, you may create a new environment for each one of them.
Environments are nothing more than a repository of key-value variables. Create the first one, a variable to store the API URL, as seen in Figure 3 .
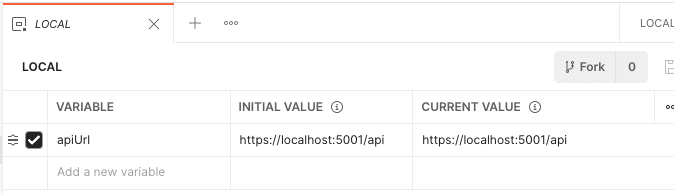
Figure 3. Creating the first environment variable
As you can see, there are three fields to fill:
- Variable: that’s the name of the variable you’ll use throughout the collections.
- Initial value: whenever no value is provided for that variable, this would be used instead.
- Current value: this value overrides the previous. That’s the value that’ll be populated when a test dynamically sets the variable, as you’ll see later in this article.
Great! Save the file (Ctrl + S) and close the tab for now.
After you save it, you may notice that the combo box at the top of the panel has now a new value, as shown in Figure 4.
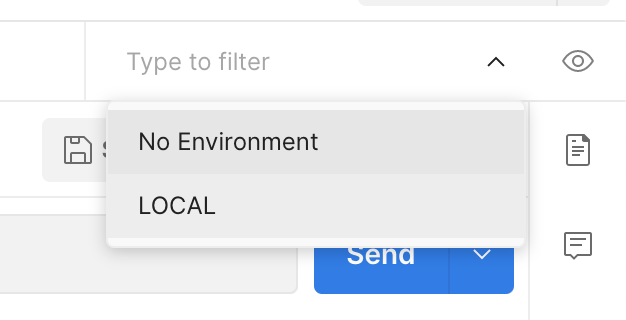
Figure 4. The new LOCAL environment
Remember to select the proper environment every time you’re testing an endpoint; otherwise, the test will fail to locate the variables. In this case, you’ll be using the LOCAL environment just created.
If you desire to see the initial and current values of a given variable, just click on the eye button on the right side of the combo box.
Collections
Now, get back to the Collections section. When you click it, you may see a plus button, as shown in Figure 5. Use this button when you need to create a new collection.
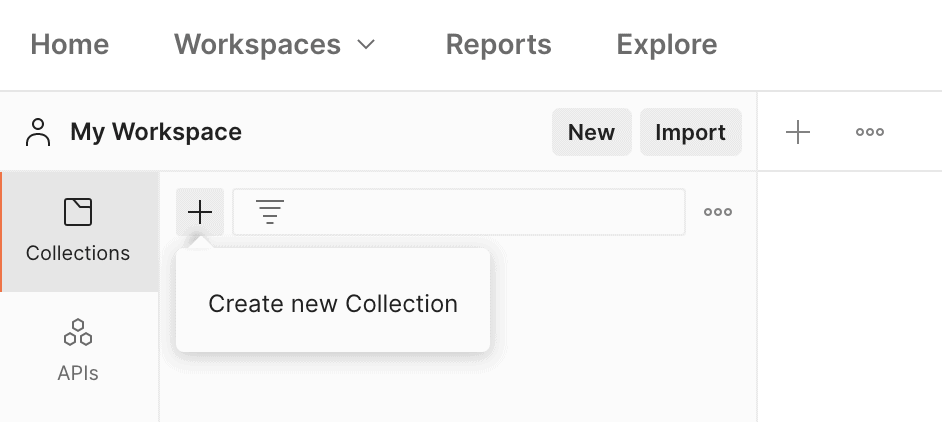
Figure 5. Creating a new Postman collection
Again, a new tab will show up. Give it a name (e.g., React ASP CRUD), and it will look like the one shown in Figure 6.
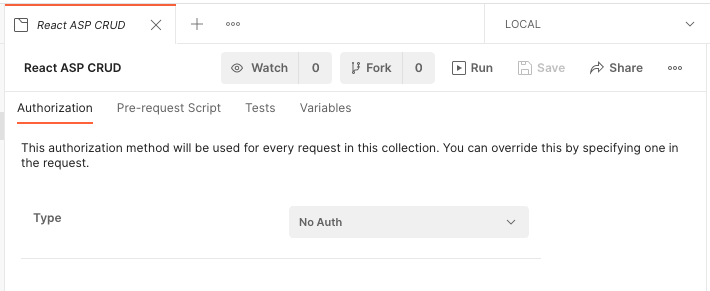
Figure 6. New Collection created
Pay attention to the right-side panel called Documentation. This is where Postman keeps the documentation features which resumes to Markdown-like text.
Postman understands GitHub Markdown content which is great to create rich API documentation, including images, code blocks, links, tables, etc.
I’ll cover more on documenting the APIs later. For now, focus on creating new API endpoints with Postman to test them. For this, right-click the created collection and select the option Add request (Figure 7).
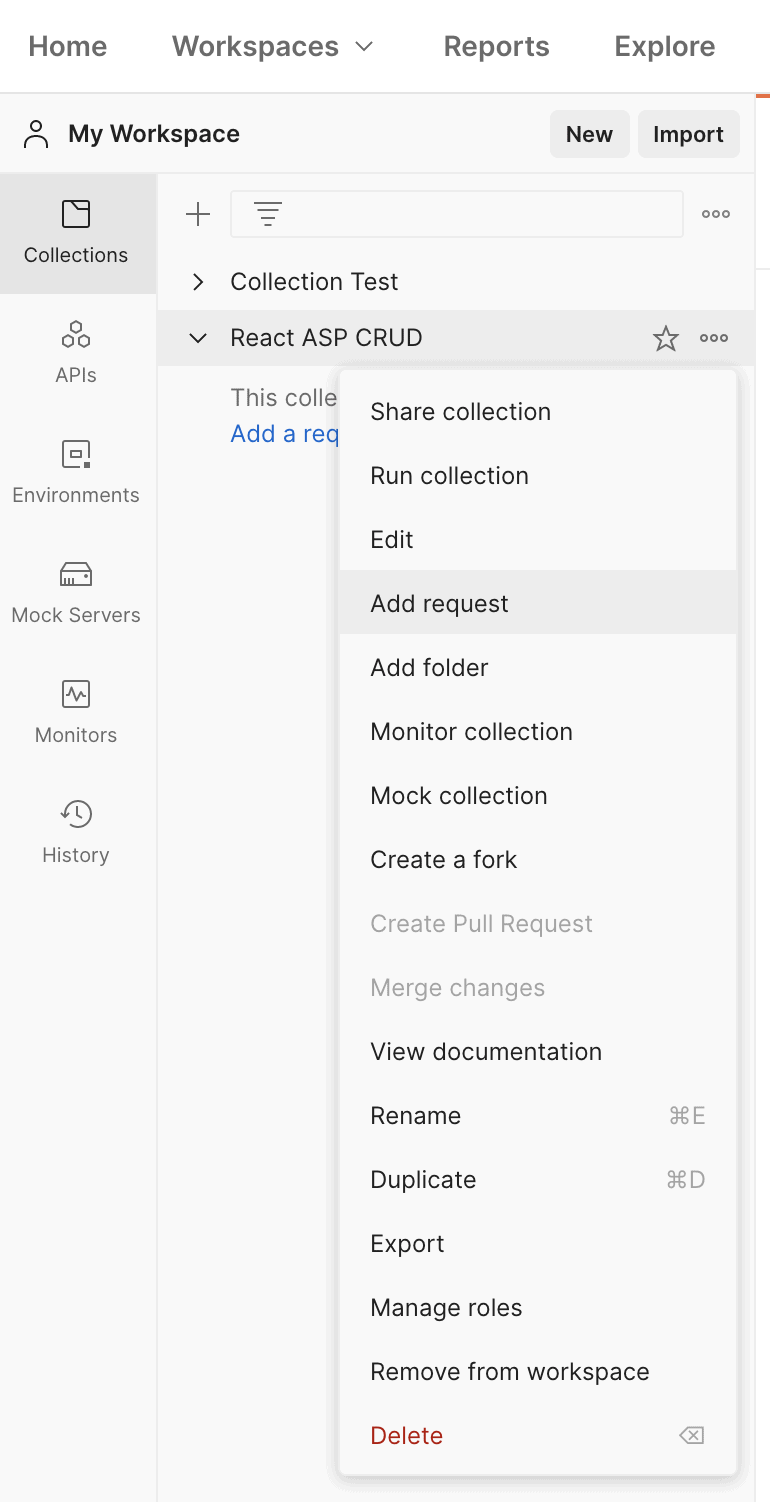
Figure 7. Adding a new request
A new tab window will show up this time with the main field for you to select the HTTP verb of your endpoint request and provide the URL.
Remember the previously created env variable to store the API URL. Well, you can use it to avoid duplicating such information in every endpoint.
Figure 8 demonstrates how you can make use of an env variable.
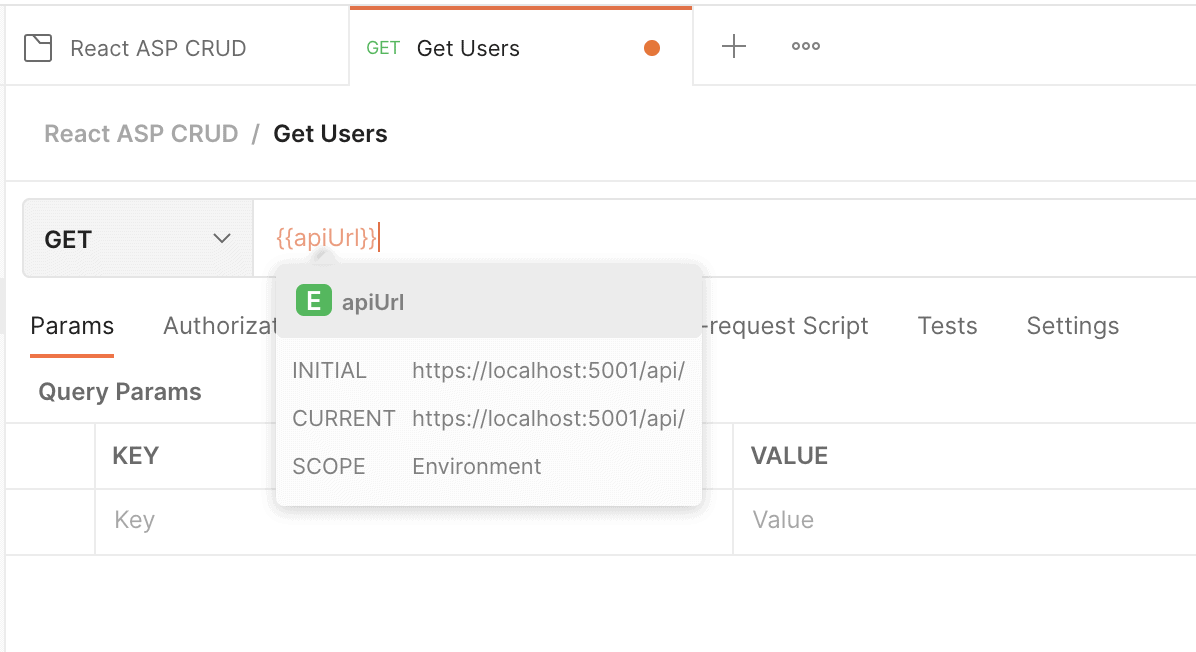
Figure 8. Accessing the apiUrl env variable
The figure also shows what happens when you hover the variable on Postman. It displays both initial and current values of that variable, which is very useful.
Go ahead and finish up your URL by typing:
|
1 |
{{apiUrl}}/users |
Hitting the Send button will trigger the request to your localhost app. Since you’re dealing with an API that’s HTTPS, proper certificate verifications will be done by Postman.
That’s not the focus here. So, if it displays the error message shown in Figure 9, just click the Disable SSL Verification link, and you’ll be fine.
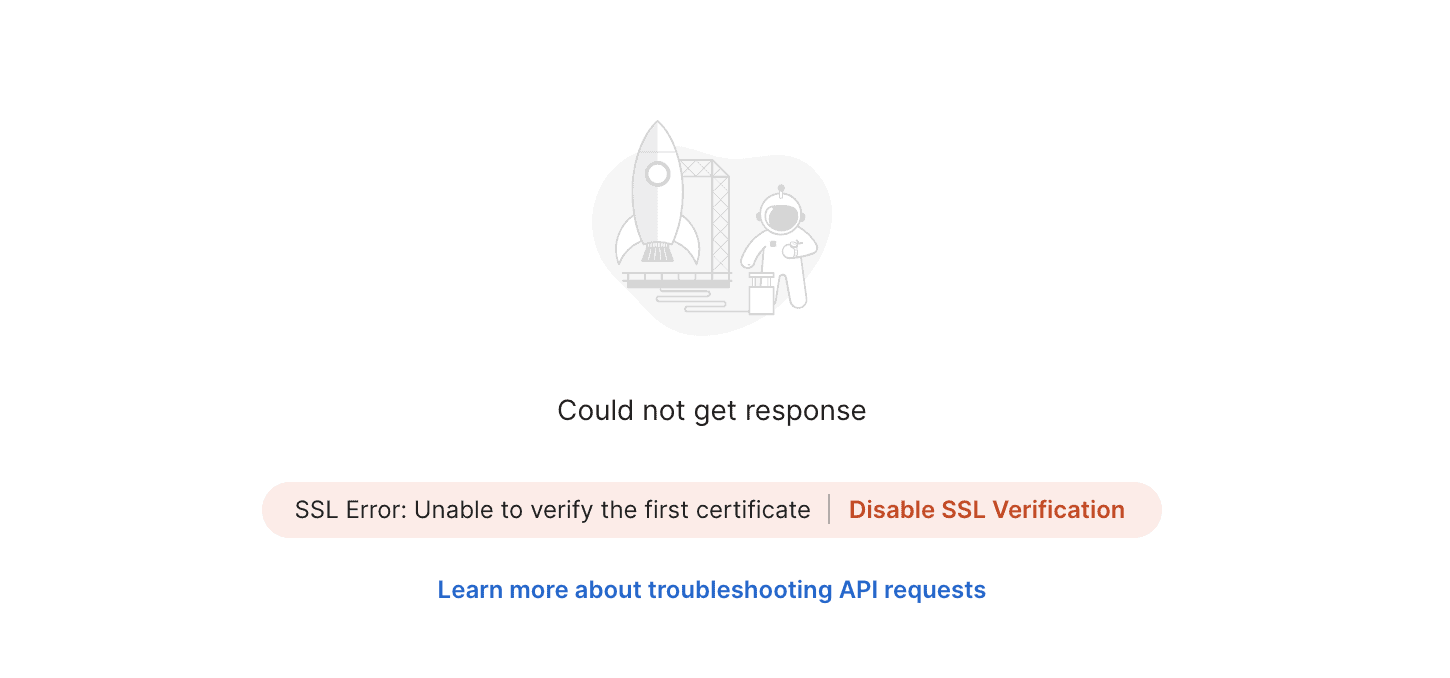
Figure 9. SSL certificate error message
When you click the Send button once more, the results shown in Figure 10 will show up.
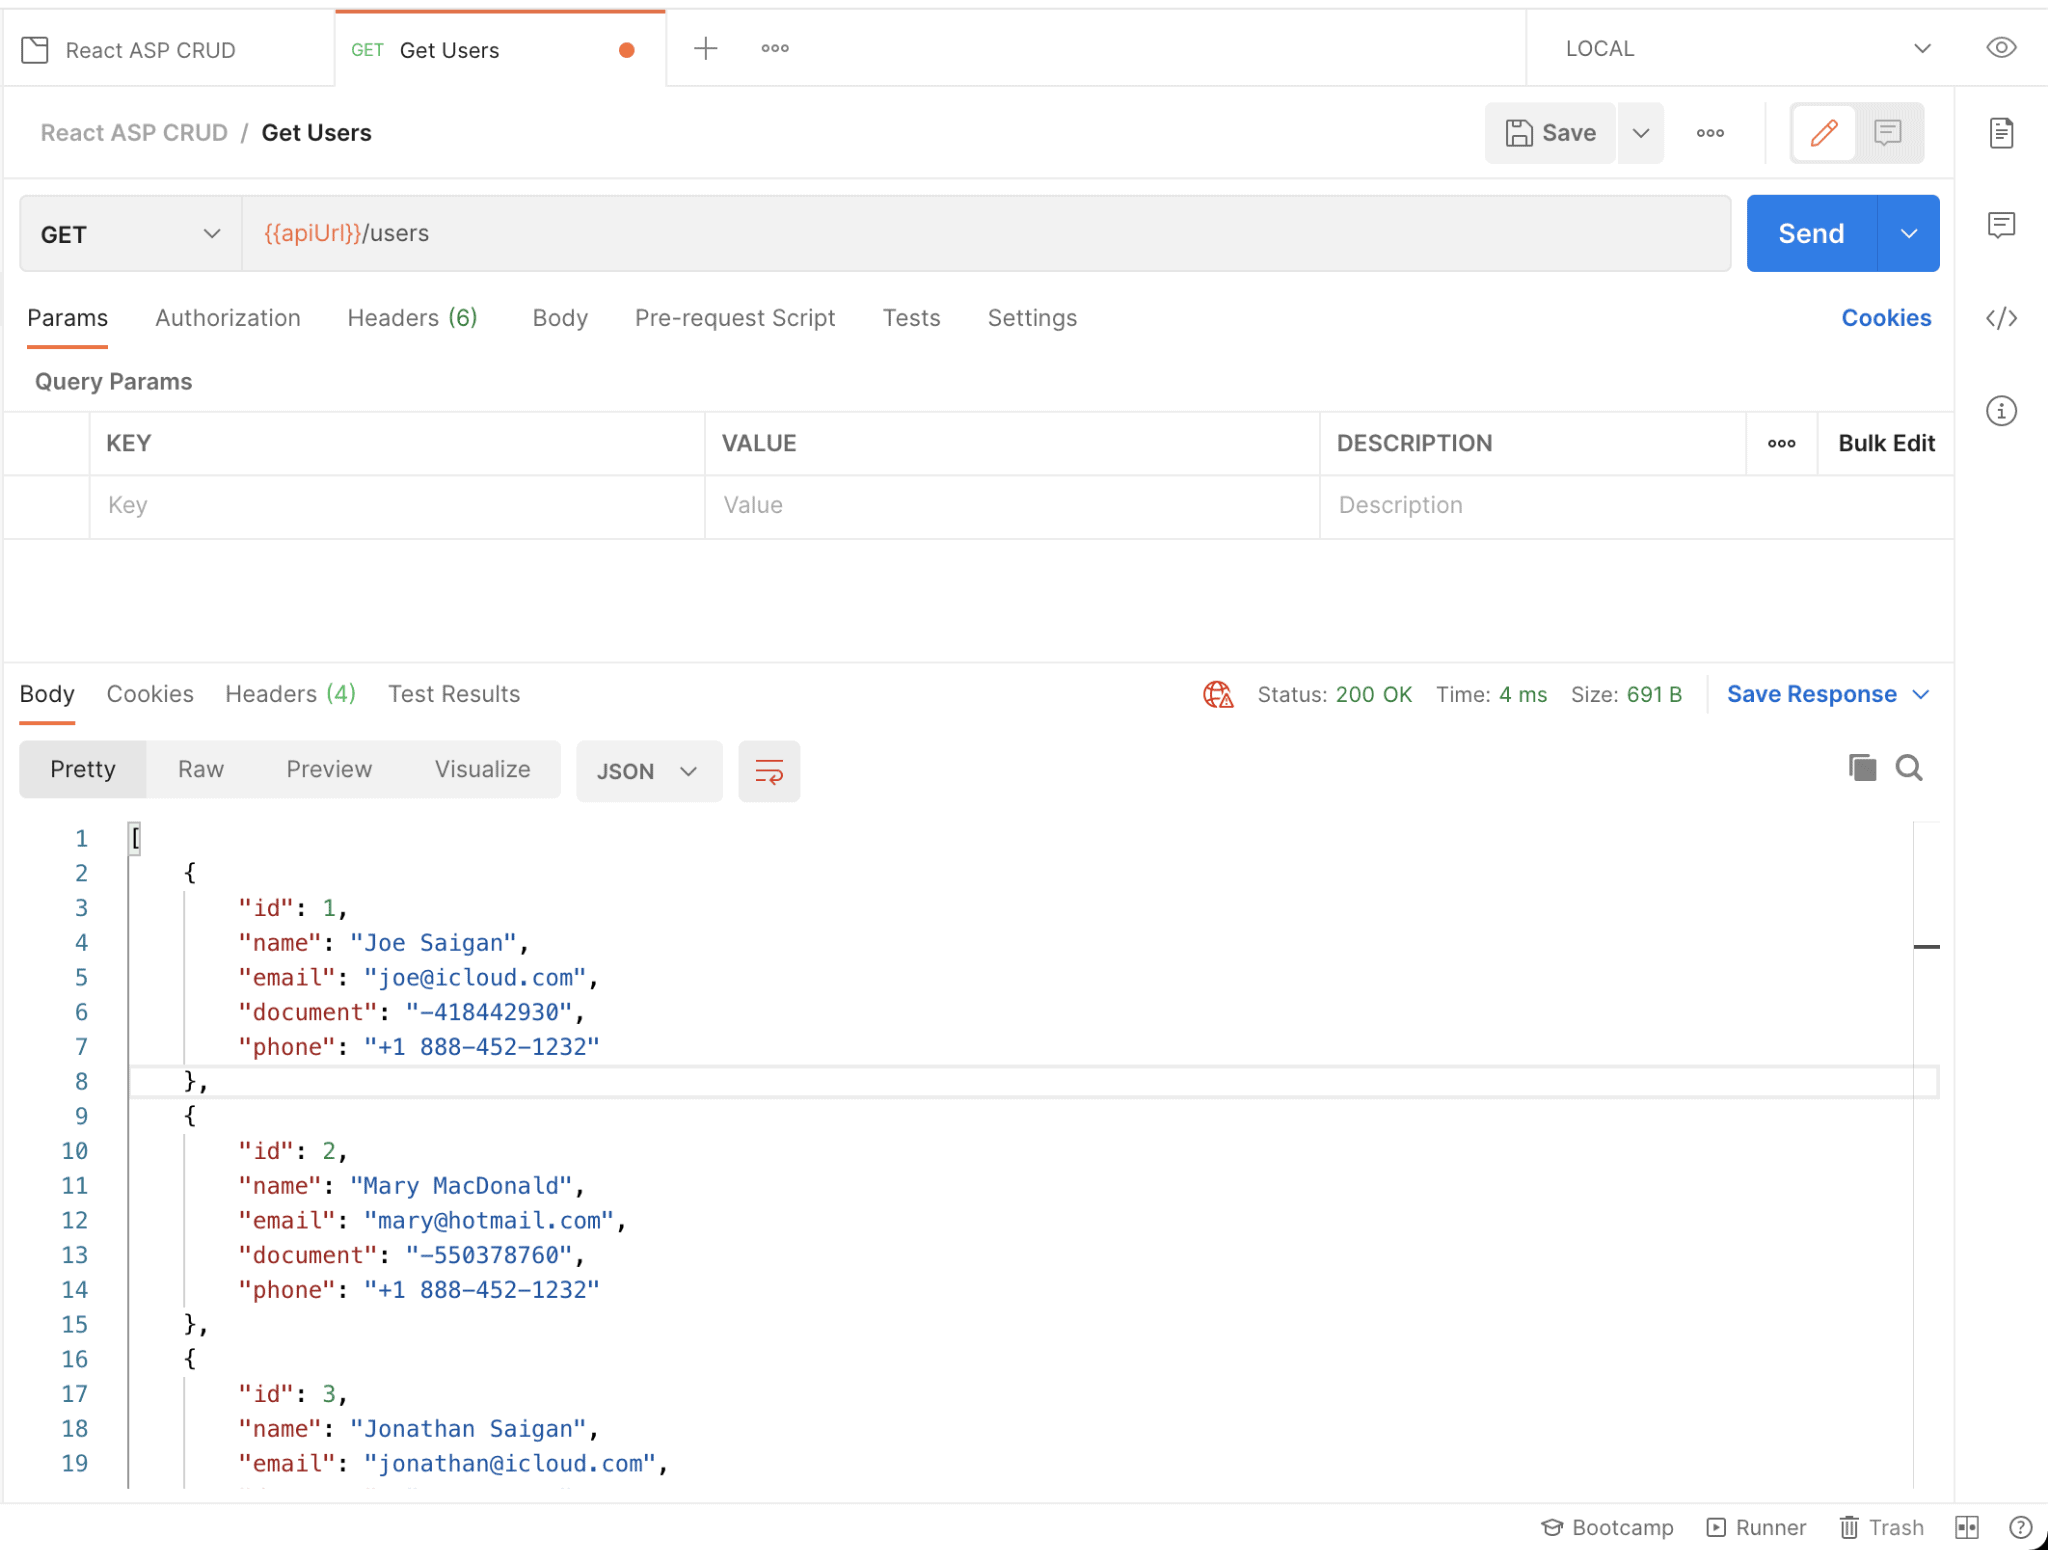
Figure 10. Getting the list of users successfully
You may repeat this process for each of the API endpoints you want to test. For example, to get a single and specific user by id (say 1), you may use another endpoint:
|
1 |
{{apiUrl}}/users/1 |
You can easily do that by duplicating the previous request via Postman. It offers this functionality by right-clicking the Get Users request and selecting the Duplicate option (Figure 11).
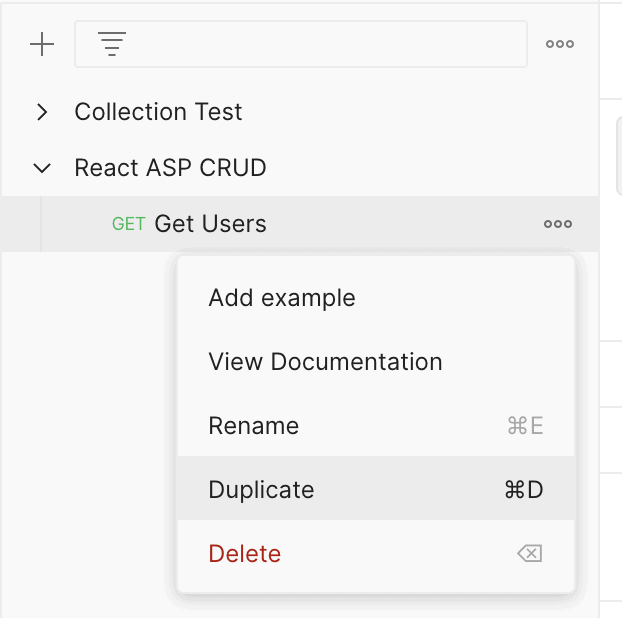
Figure 11. Duplicating a request on Postman
Then, you can change the request name (Get Users By Id), change the URL, and hit the Send button again, all shown in Figure 12.
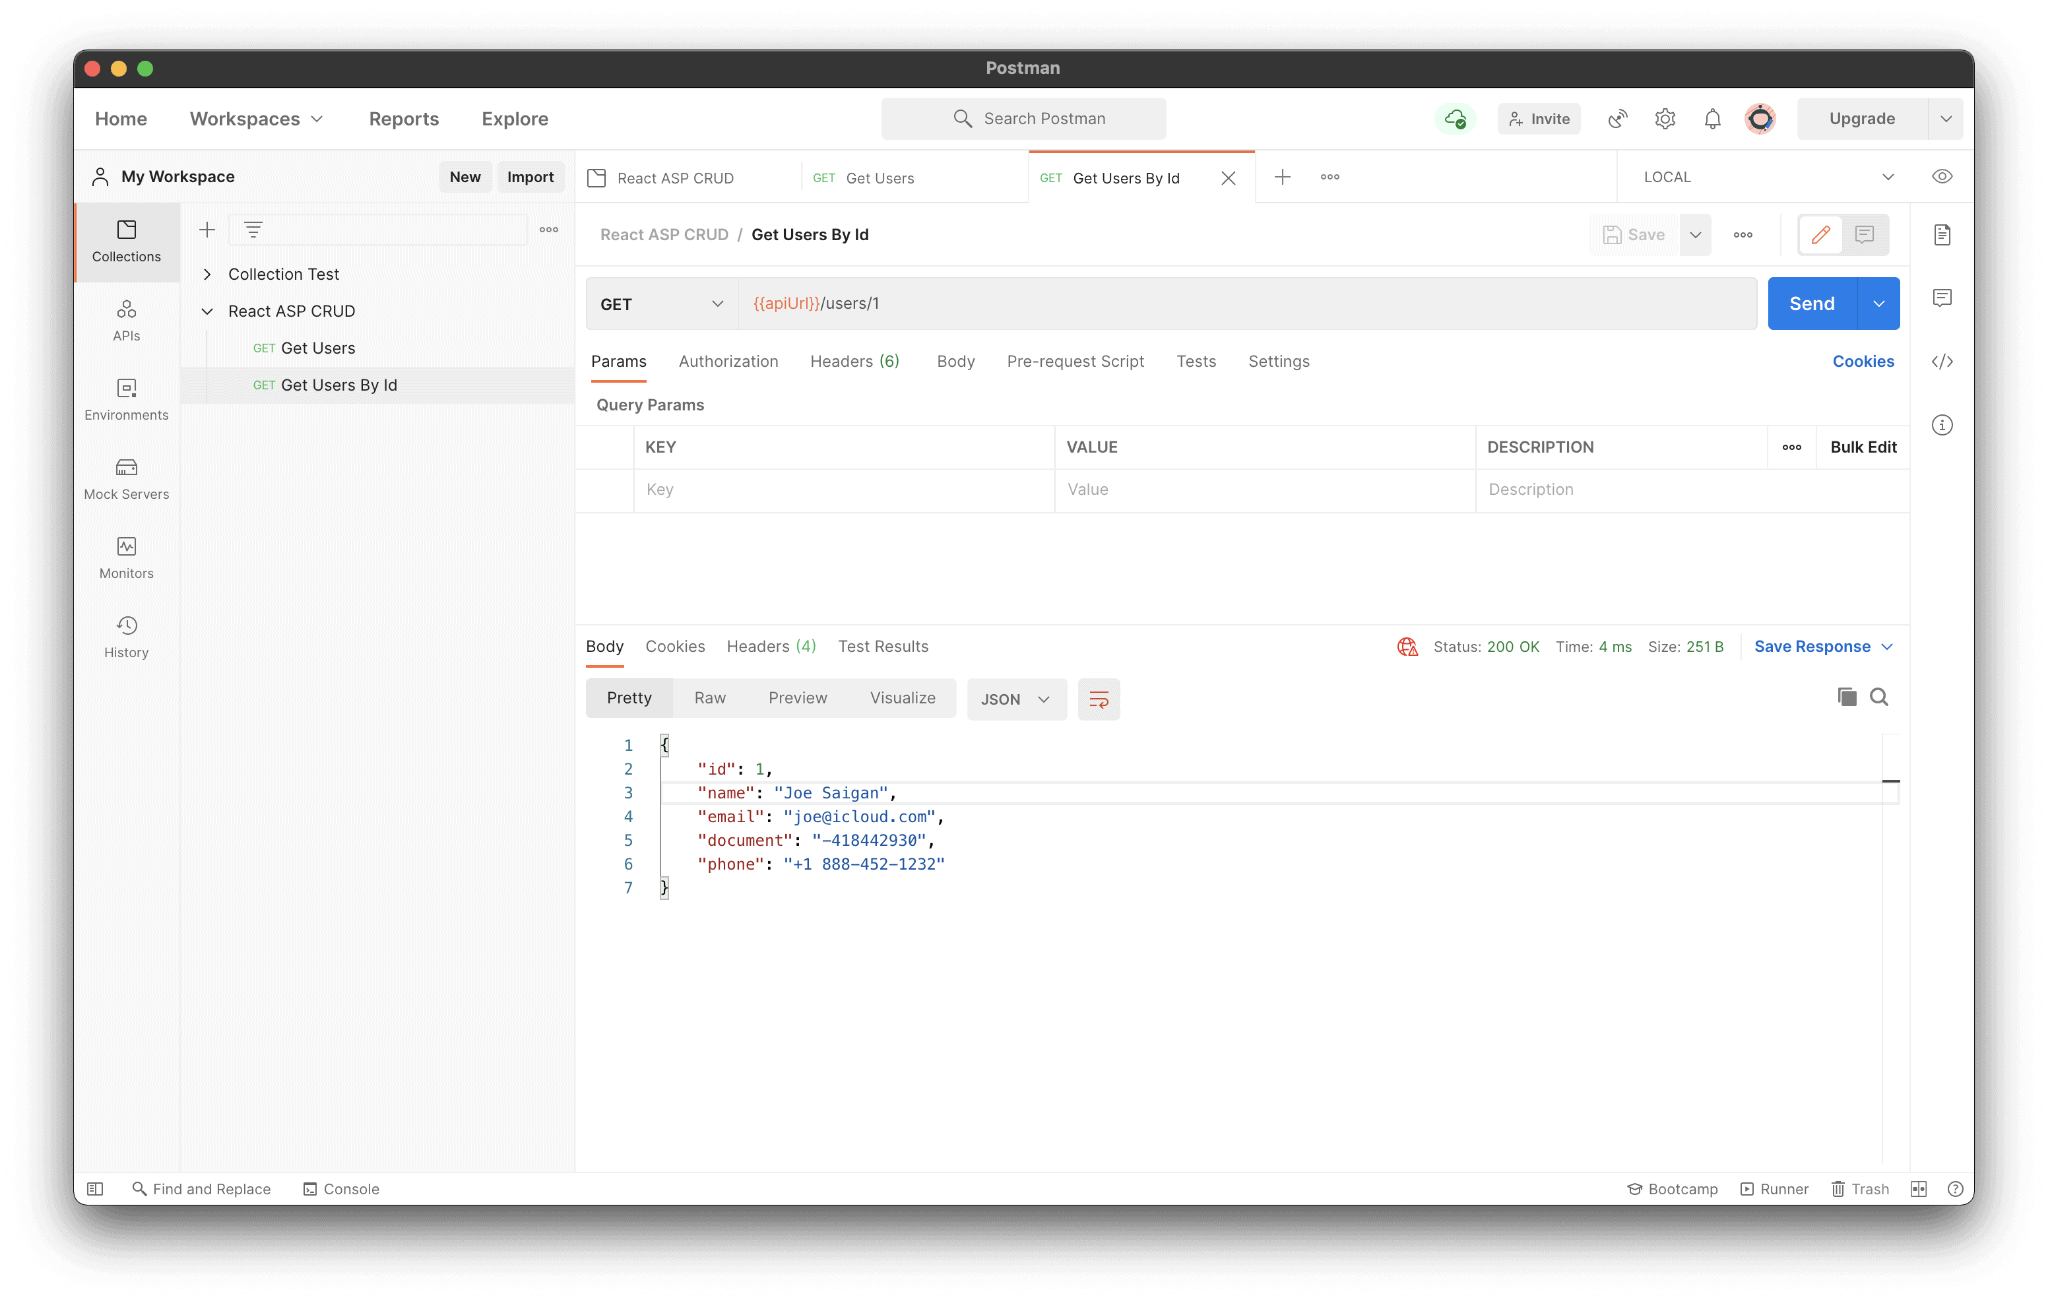
Figure 12. Get user by id endpoint request
When it comes to creating a new user, things change a little bit since it’s a new HTTP method being used, the POST.
Figure 13 shows all the available HTTP methods that Postman provides internally.
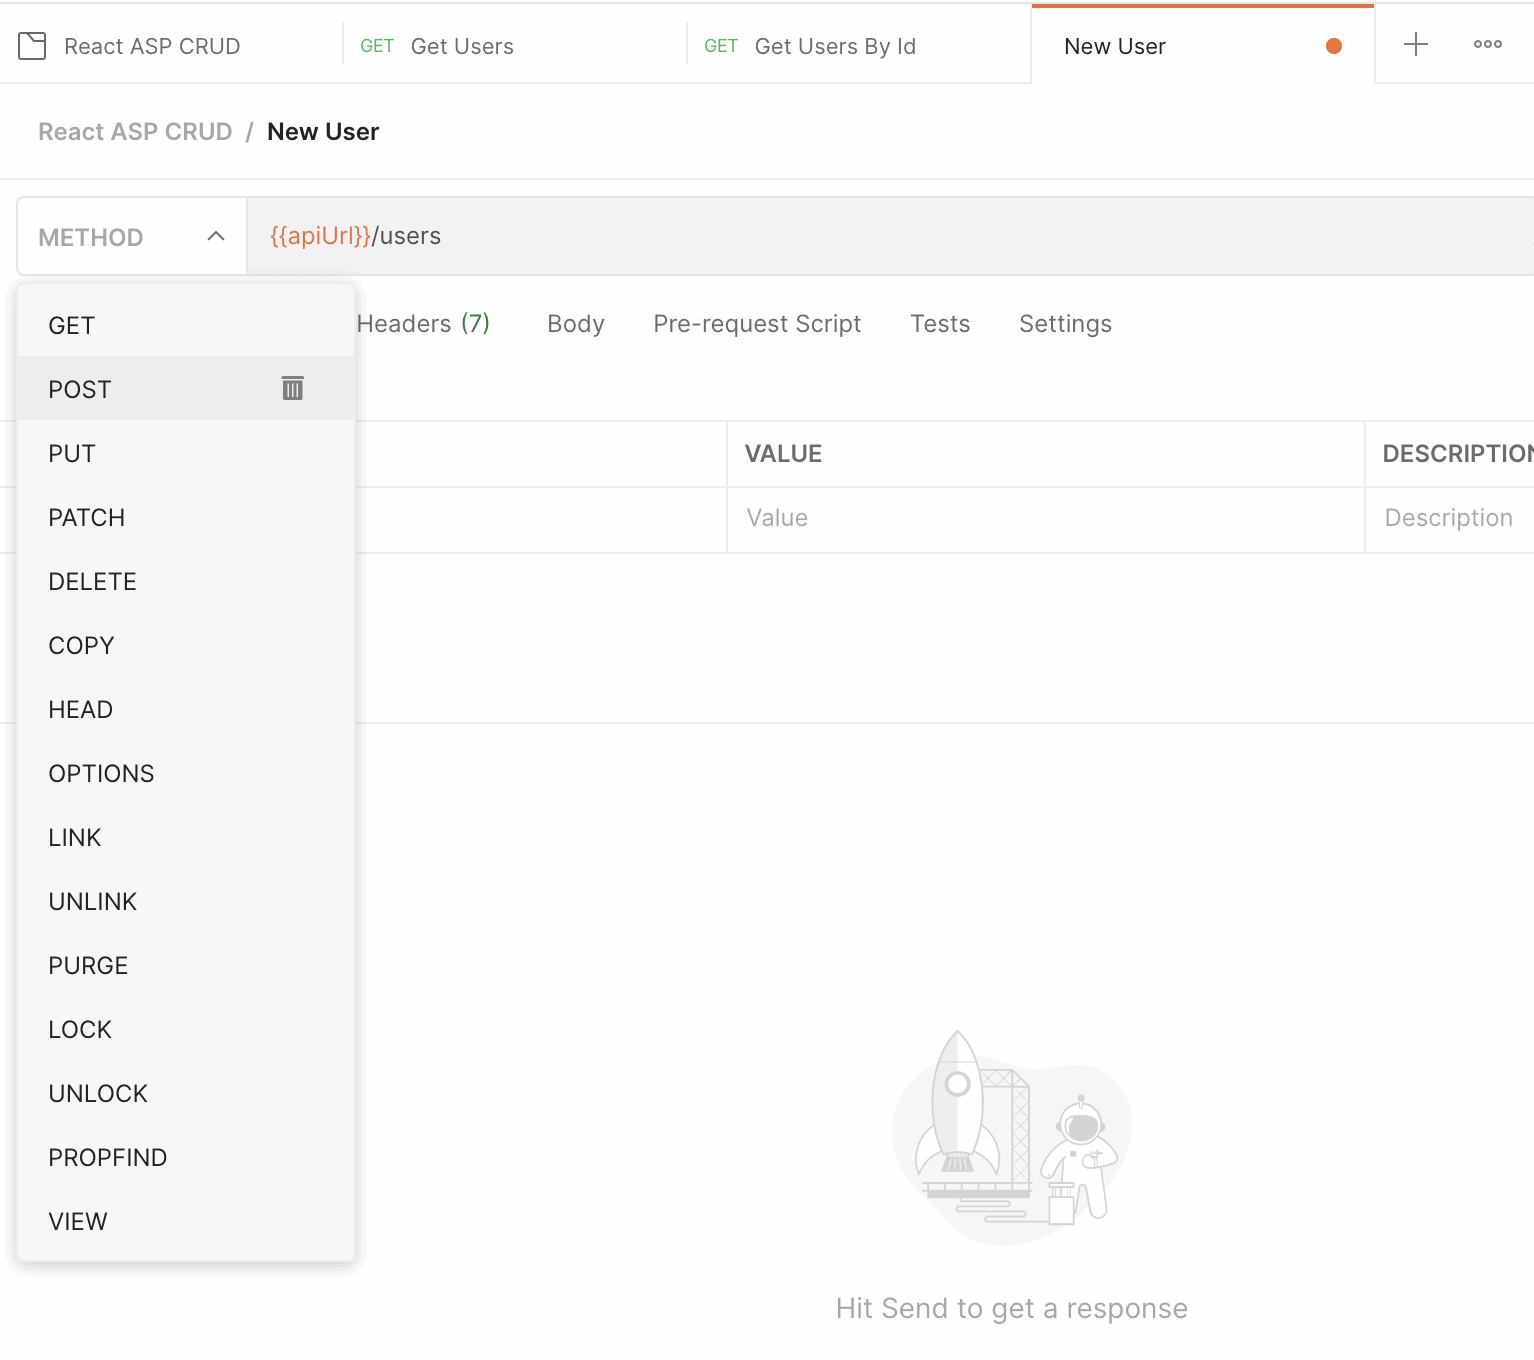
Figure 13. List of Postman HTTP methods
Other than that, a POST request also requires a JSON payload going within the request’s body. You can set it up by going to the Body tab, selecting the raw option, and, finally, the JSON option on the combo box.
Follow up Figure 14 to see instructions for that.
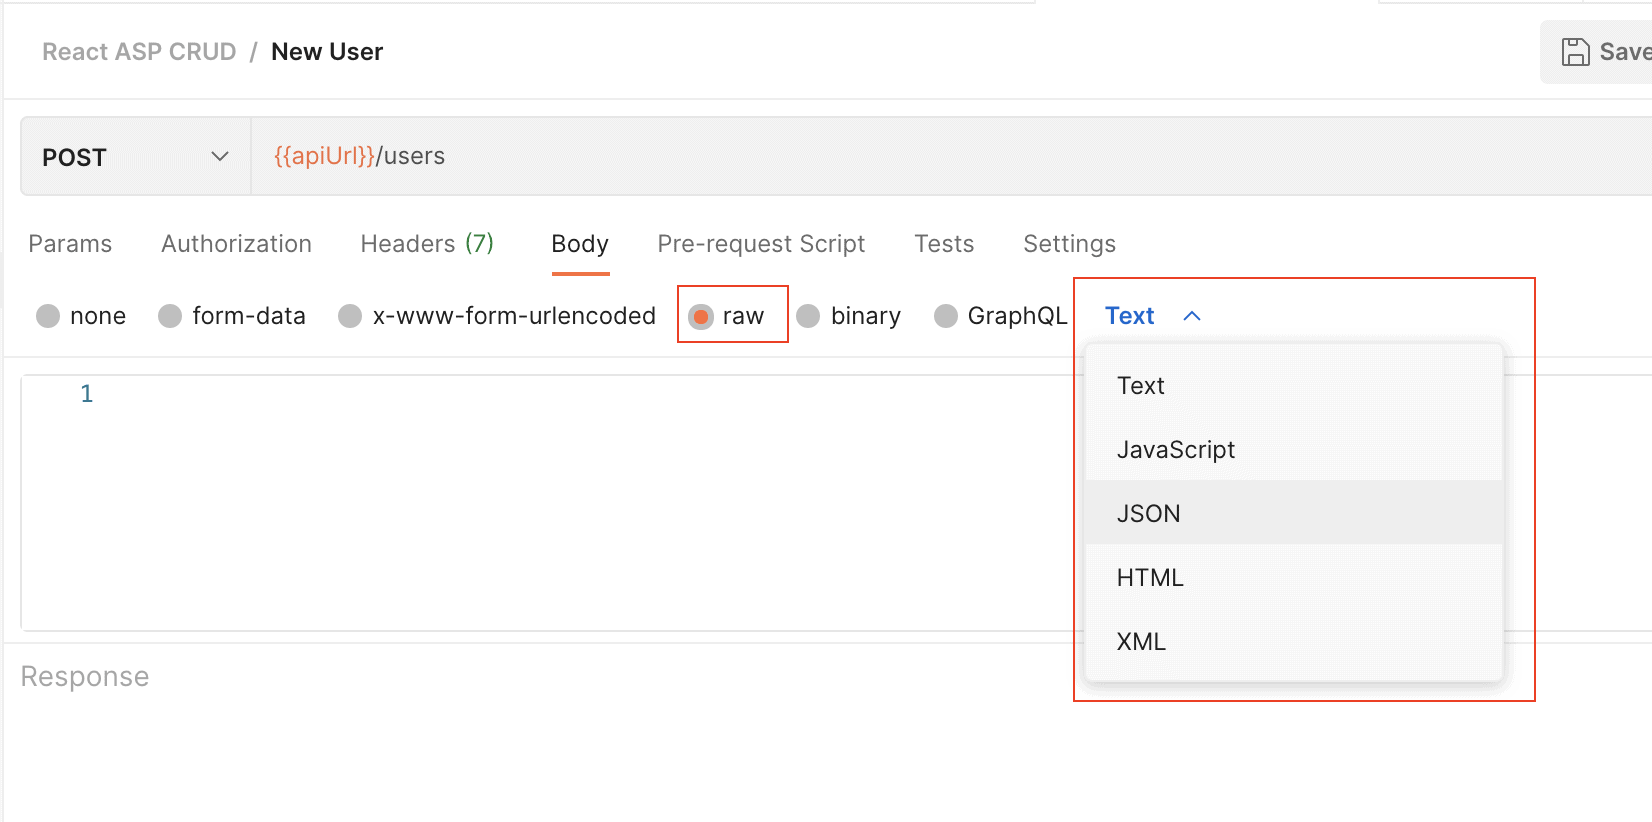
Figure 14. Selecting proper JSON body type
Then, fill in the text area with some JSON to create a new user and hit the Send button once more. That is enough to create the user and receive a 201 status, as shown in Figure 15.
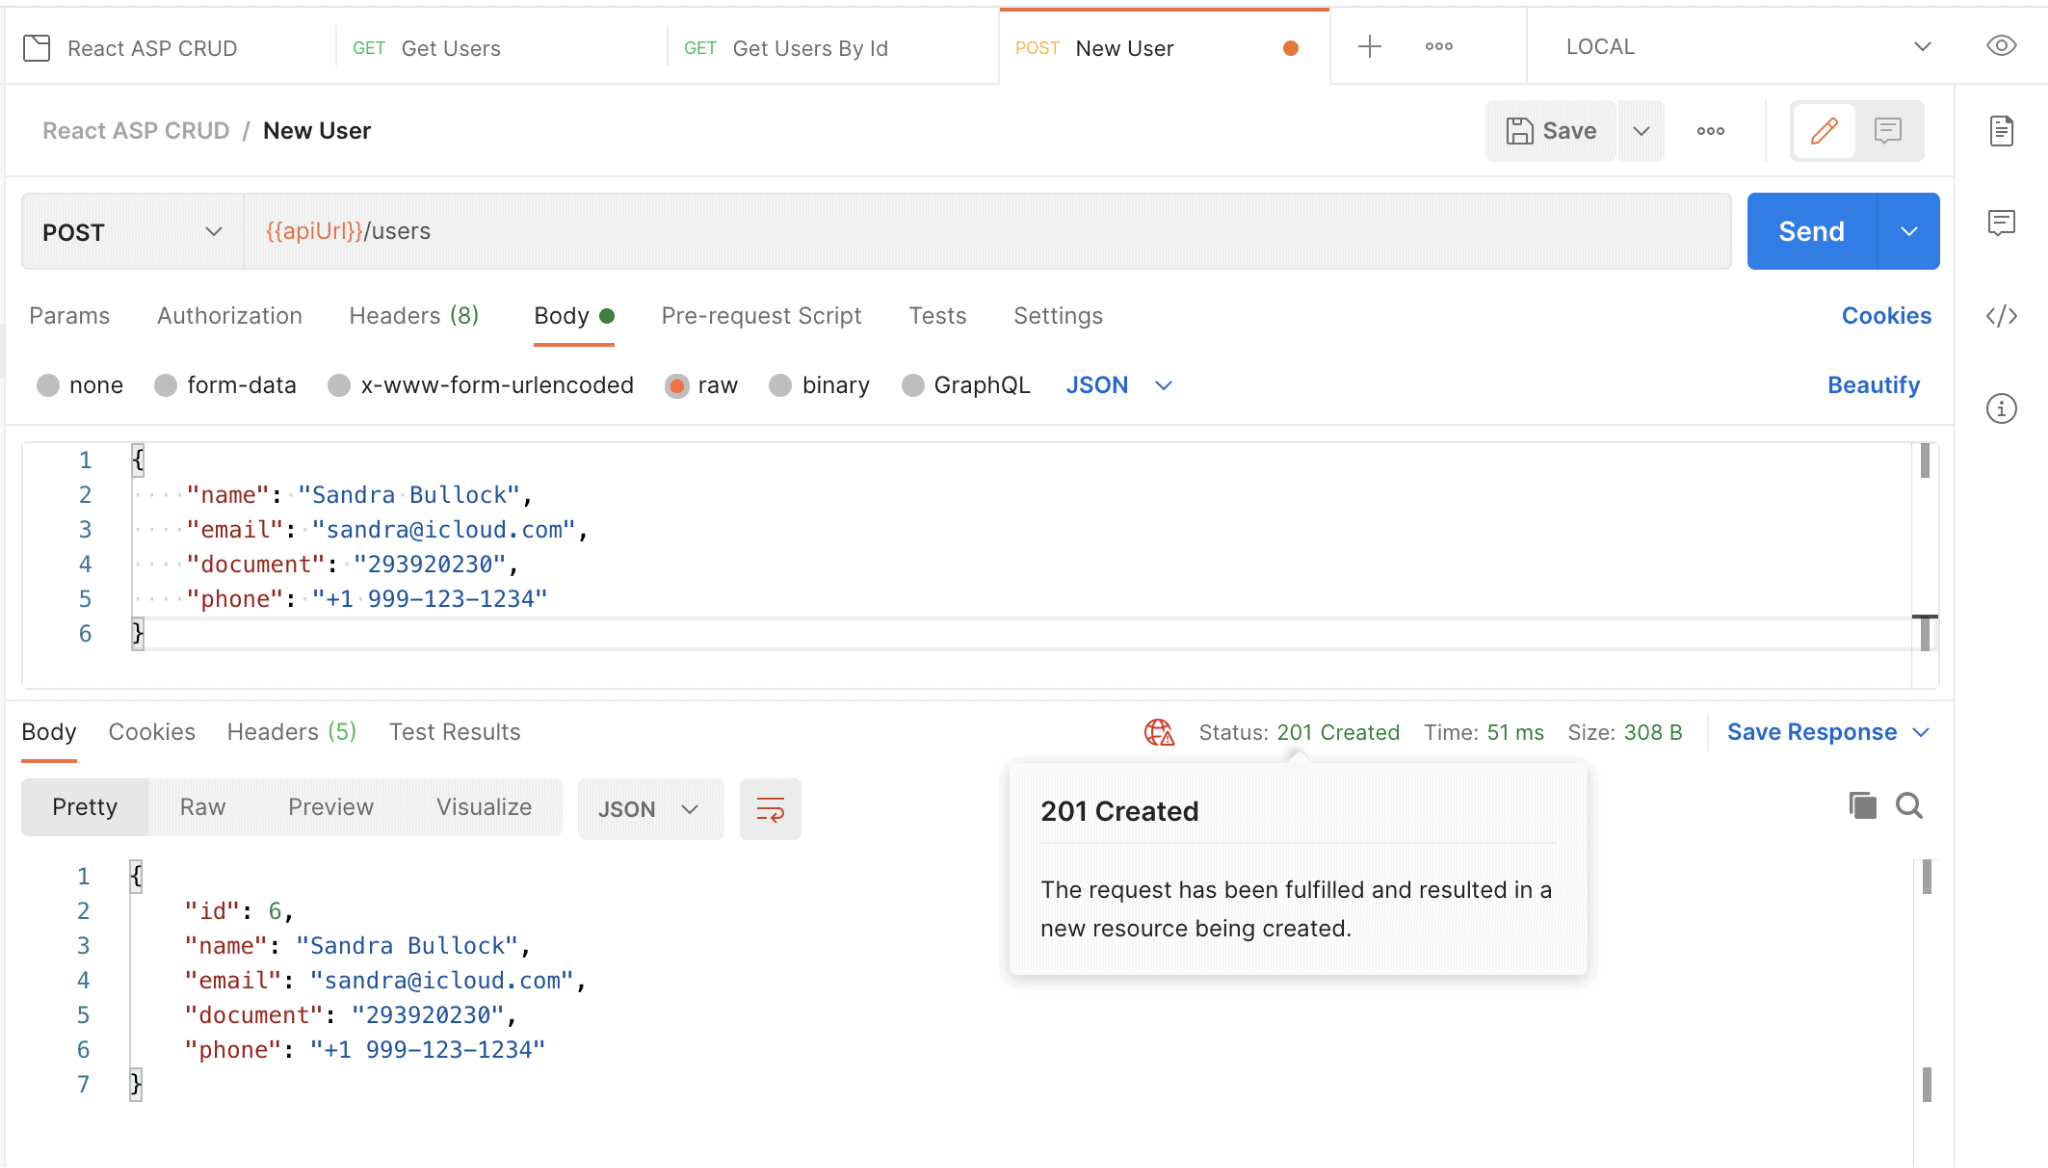
Figure 15. Creating a new user with Postman
Great! I’ll let you work with the other two remaining endpoints: to update and delete users.
Postman examples
Another great feature Postman provides is called Postman examples. An example is simply a request that you ran and produced a specific result which you may find useful to document for other devs willing to understand your API.
For example, take the get user by id endpoint. When you send the request, and it returns with success, you may notice that there’s a link called Save response close to the status code (Figure 16).
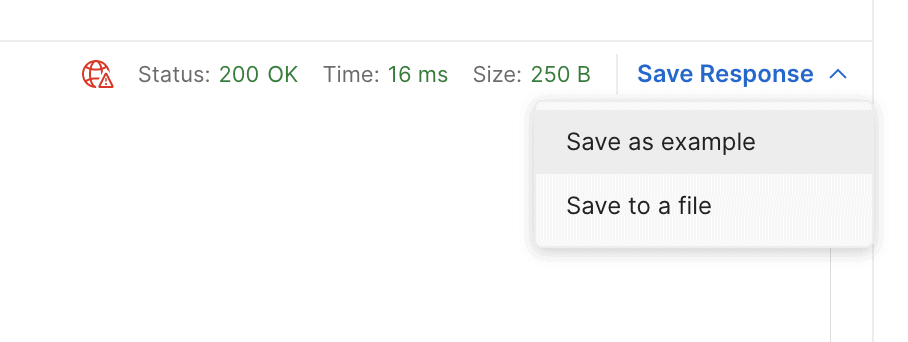
Figure 16. Saving a response as an example
If you click the Save as example option, it’ll open a new tab for the example. In other words, an example works as a screenshot of that request/response. Rename it to a more concise name such as 200 – Get user by id successfully.
The 200, in this case, helps to quickly identify what that example is about. If you try to get a user whose id is “abc”, for example, that’ll produce a different response, as you can see in Figure 17.
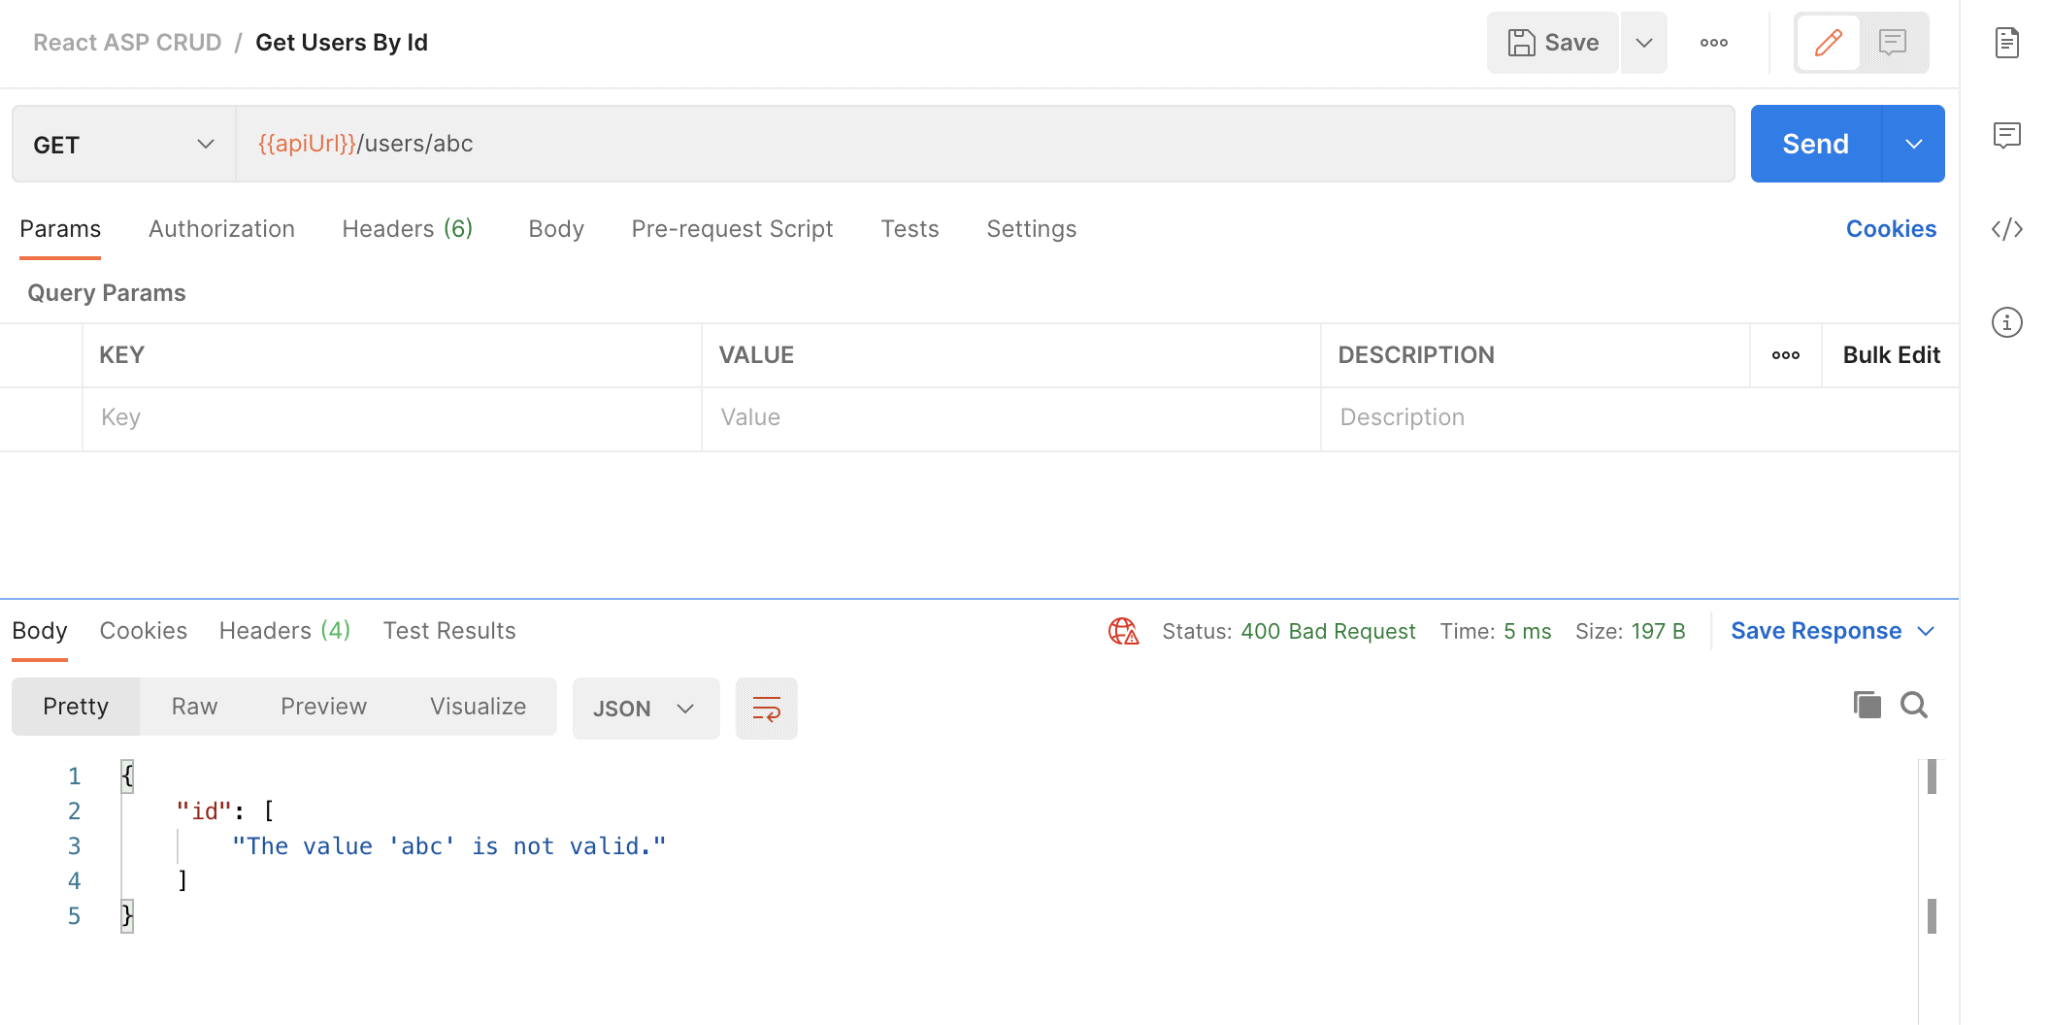
Figure 17. Getting a user with an invalid id
This time, you may save the response as a new example with a different name: 400 – Invalid user id, and so forth.
Documenting
All the changes so far were structural, i.e., focused on paving your way to having enough endpoints to document and test.
As said before, Postman makes use of Markdown syntax to document stuff. When you click the documentation button on the right of the window, then go to edit, you should find what’s shown in Figure 18 .
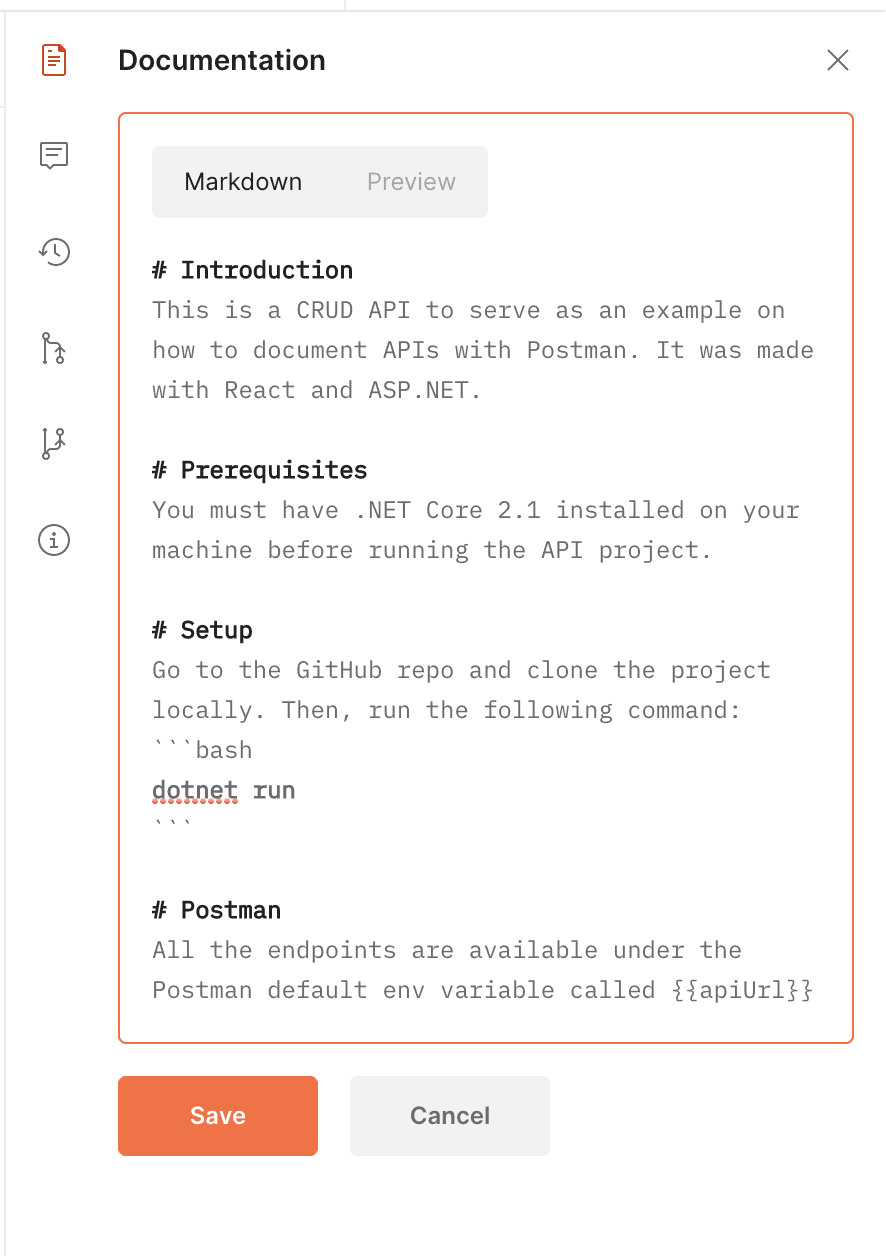
Figure 18. Markdown documentation on Postman
Go ahead and type the same content into yours. When you save the example above, it will turn into the following visual representation:
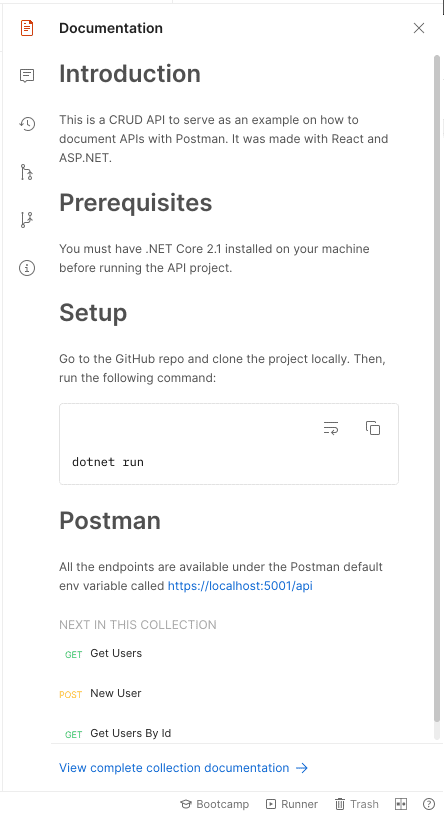
Figure 19. Postman example documentation
Cool, isn’t it? One thing to notice is that Postman adds its style to things like code blocks, for example, allowing the users to copy/paste easily.
Note also that a reference to the {{apiUrl}} env variable was intentionally added . As you can see, the result is that Postman translates whatever env variable you add to your docs. More than that, it’ll dynamically change every time you switch from one environment to another.
At the end of it, you can find the list of requests that belong to this current collection. And guess what? You can add docs to each endpoint individually too.
Time to test it out! Click the View complete collection documentation link at the bottom of the window. That’ll open a new tab with the complete documentation, very similar to other tools such as Confluence, for example.
Other than a broader view of the documentation, you also have some other features that you didn’t have on the shorter visualization.
Scroll down to the Get Users By Id request. Since you’ve set up two Postman examples for this request before, now you get to see a combo box with the two of them for you to pick (Figure 20).
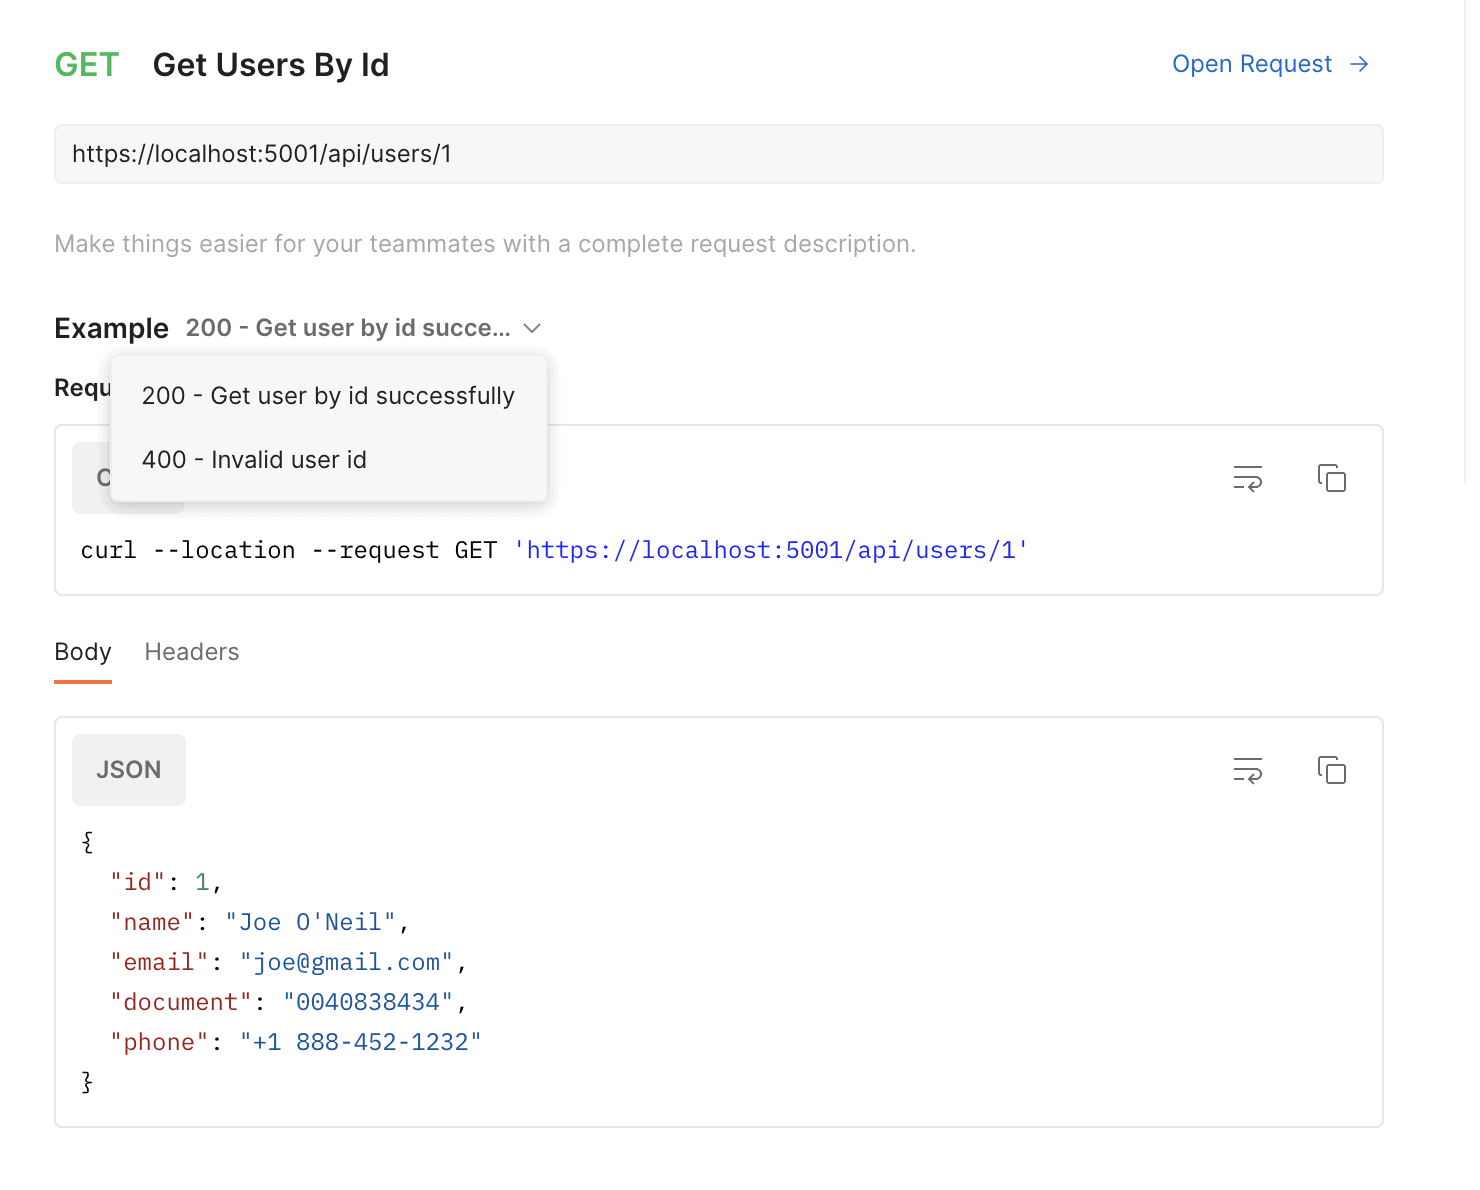
Figure 20. Selecting one of the examples on Postman
Postman will then update the request and response data according to the example you select.
Another interesting feature is that you can select the programming language (among many provided by Postman) from which you’d like to have the endpoints being accessed. The default is cURL.
At the top of the documentation tab, there’s this LANGUAGE combo box, and when you click it, you will see the list of options as shown in Figure 21.
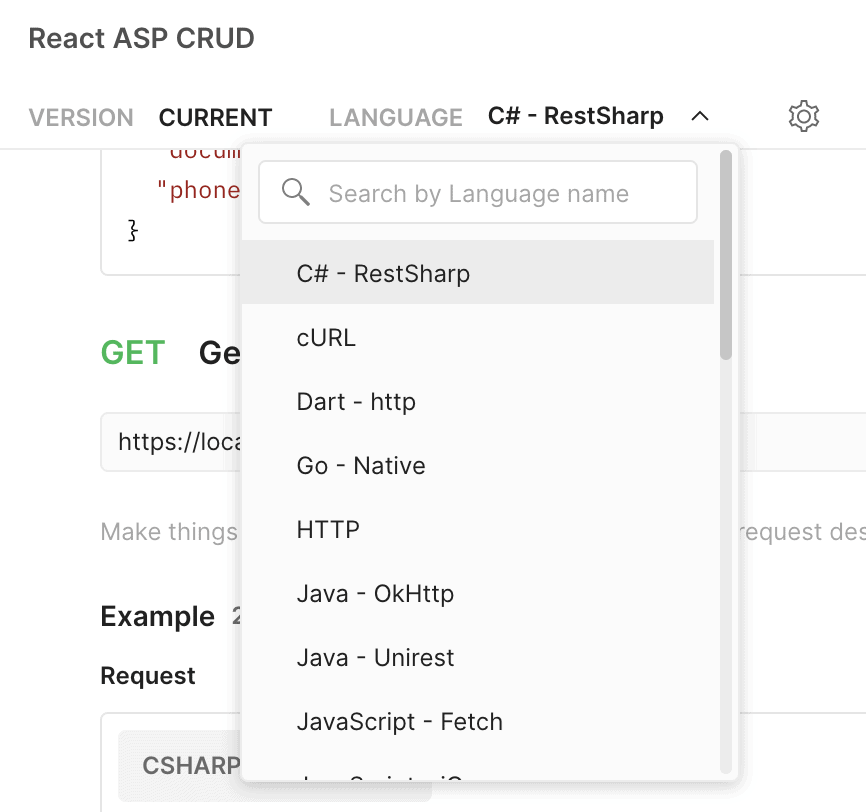
Figure 21. List of available languages on Postman
If you select the C# – RestSharp option, for example, the Postman examples will update accordingly.
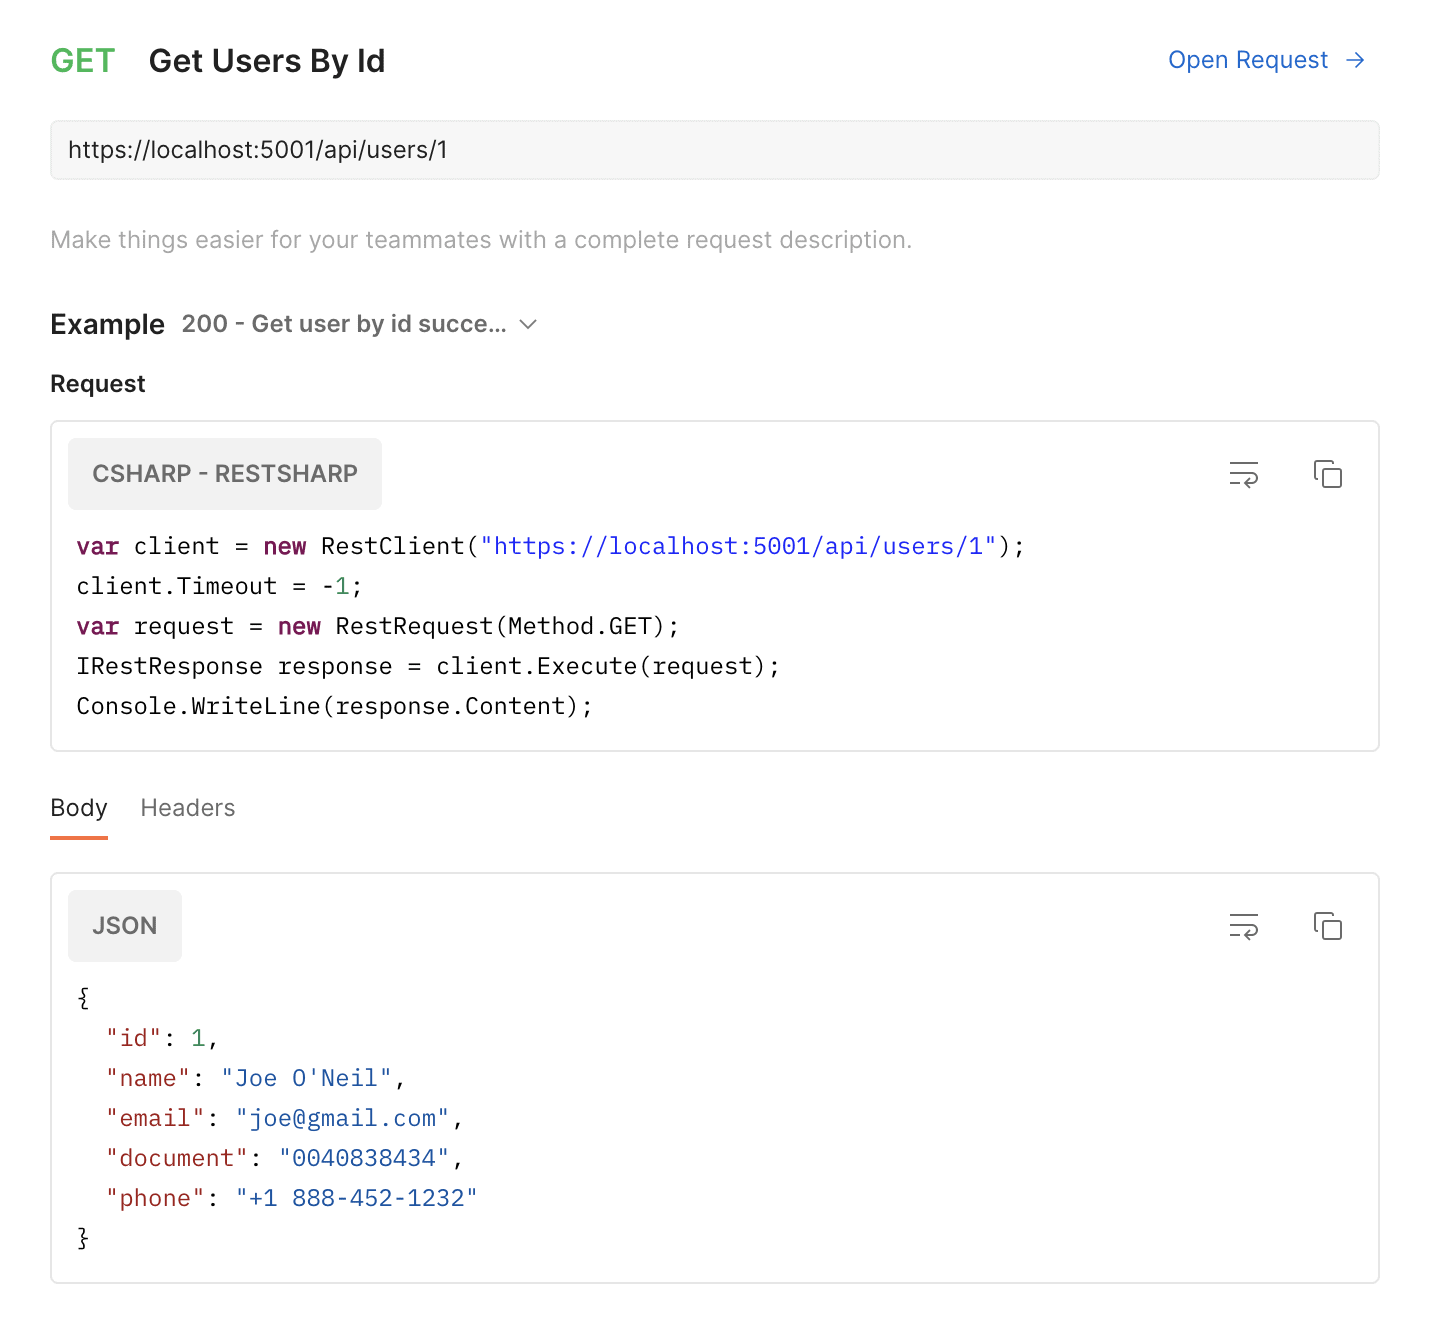
Figure 22. Autogenerated RestSharp code
Testing
Postman is not only good at running requests and documenting them. It also offers great options to test your APIs and create entire test suites for your QA team.
It’s usually best practice to separate your tests from the ordinary endpoints since they change in different ways. Because of this, create a new collection called Test Suites. Then, duplicate the New User and Get Users By Id endpoints to there. The purpose here is to create a test suite that will first create a new user and test if shows up in the database.
It’s also good to enumerate your endpoints since the order is essential here. This way, Postman can’t mess it up.
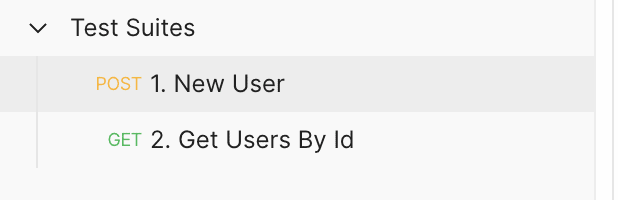
Figure 23. A new suite of enumerated tests
This suite is aimed to be run several times and always work. Because of that peculiarity, you can’t always pass the same data since backend validations may throw errors for duplicate information, such as email, for example, which is supposed to be unique.
Change the body of the first endpoint to the following:
|
1 2 3 4 5 6 |
{ "name": "{{$randomFirstName}} {{$randomLastName}}", "email": "{{$randomEmail}}", "document": "293920230", "phone": "{{$randomPhoneNumber}}" } |
You may be wondering about these new variables that you haven’t declared. That’s right; Postman also provides you with some default variables for various purposes such as random emails, usernames, addresses, etc. This way, you won’t risk duplicating any data at any time.
Postman provides another tab called Tests. It is available on the right side of the Body tab. You must add the following content to it:
|
1 2 3 4 5 6 7 8 9 10 |
pm.test("Registration was successful", function () { pm.response.to.have.status(201); var jsonData = pm.response.json(); pm.expect(jsonData).to.have.property('name'); pm.expect(jsonData).to.have.property('email'); pm.expect(jsonData).to.have.property('document'); pm.expect(jsonData).to.have.property('phone'); pm.globals.set("user_id", jsonData.id); }); |
This code simply creates a test script. Postman test scripts are implemented in JavaScript and allow you to ensure your API is working as expected by checking stuff like the HTTP response status, headers, and response body content.
The pm object stands for the Postman global object. There, you may find a handful of utility objects and methods such as the pm.response (corresponding to the HTTP response), pm.globals (the global env variables object), and the pm.expect (Postman assert method).
The syntax is very declarative, which makes for easy readability. The example above checks if the HTTP status is 201 (Created), if the JSON response has each of the desired properties, and, finally, adding the user_id to the env variables so that it can be accessed on the next request.
Speaking of it, the next request of the suite will have the following configs:
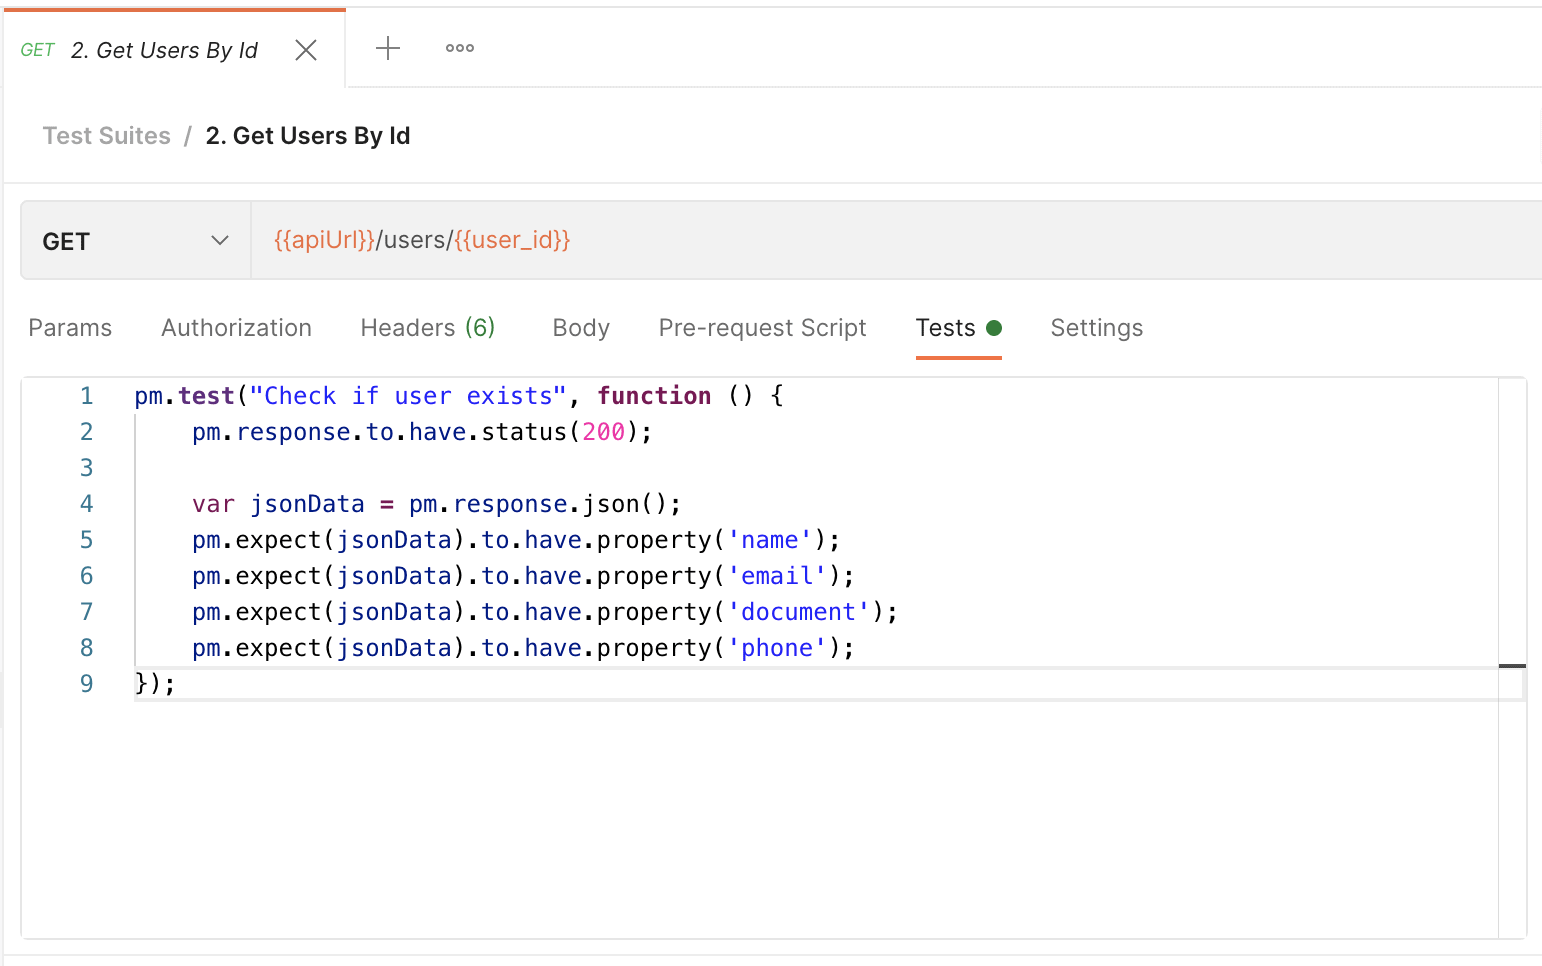
Figure 24. Setting up tests for the second suite request
Yes, the second request will make use of the user_id on the URL, which was set by the previous one. This way, you guarantee that it’s always retrieving the recently created user.
Great, now, how to run the suite? It’s simple. Get back to the suite folder and locate the Run button as shown in Figure 25.
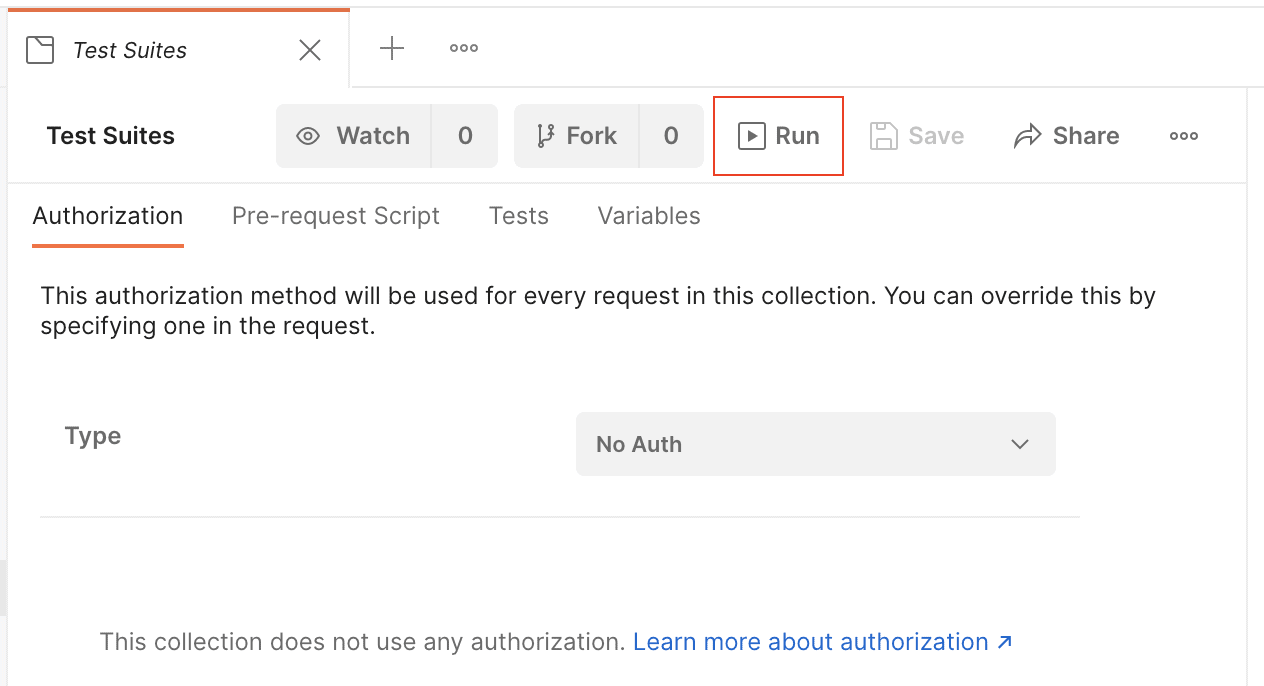
Figure 25. Locating the Run button
When you click that button, it’ll open a new tab with the suite configs. Leave all the options as they are, except for the Save responses checkbox. Make sure to check it to allow Postman to log the responses.
Then, click the Run Test Suites button and wait until the tests finish. You may see the following screen as a result:
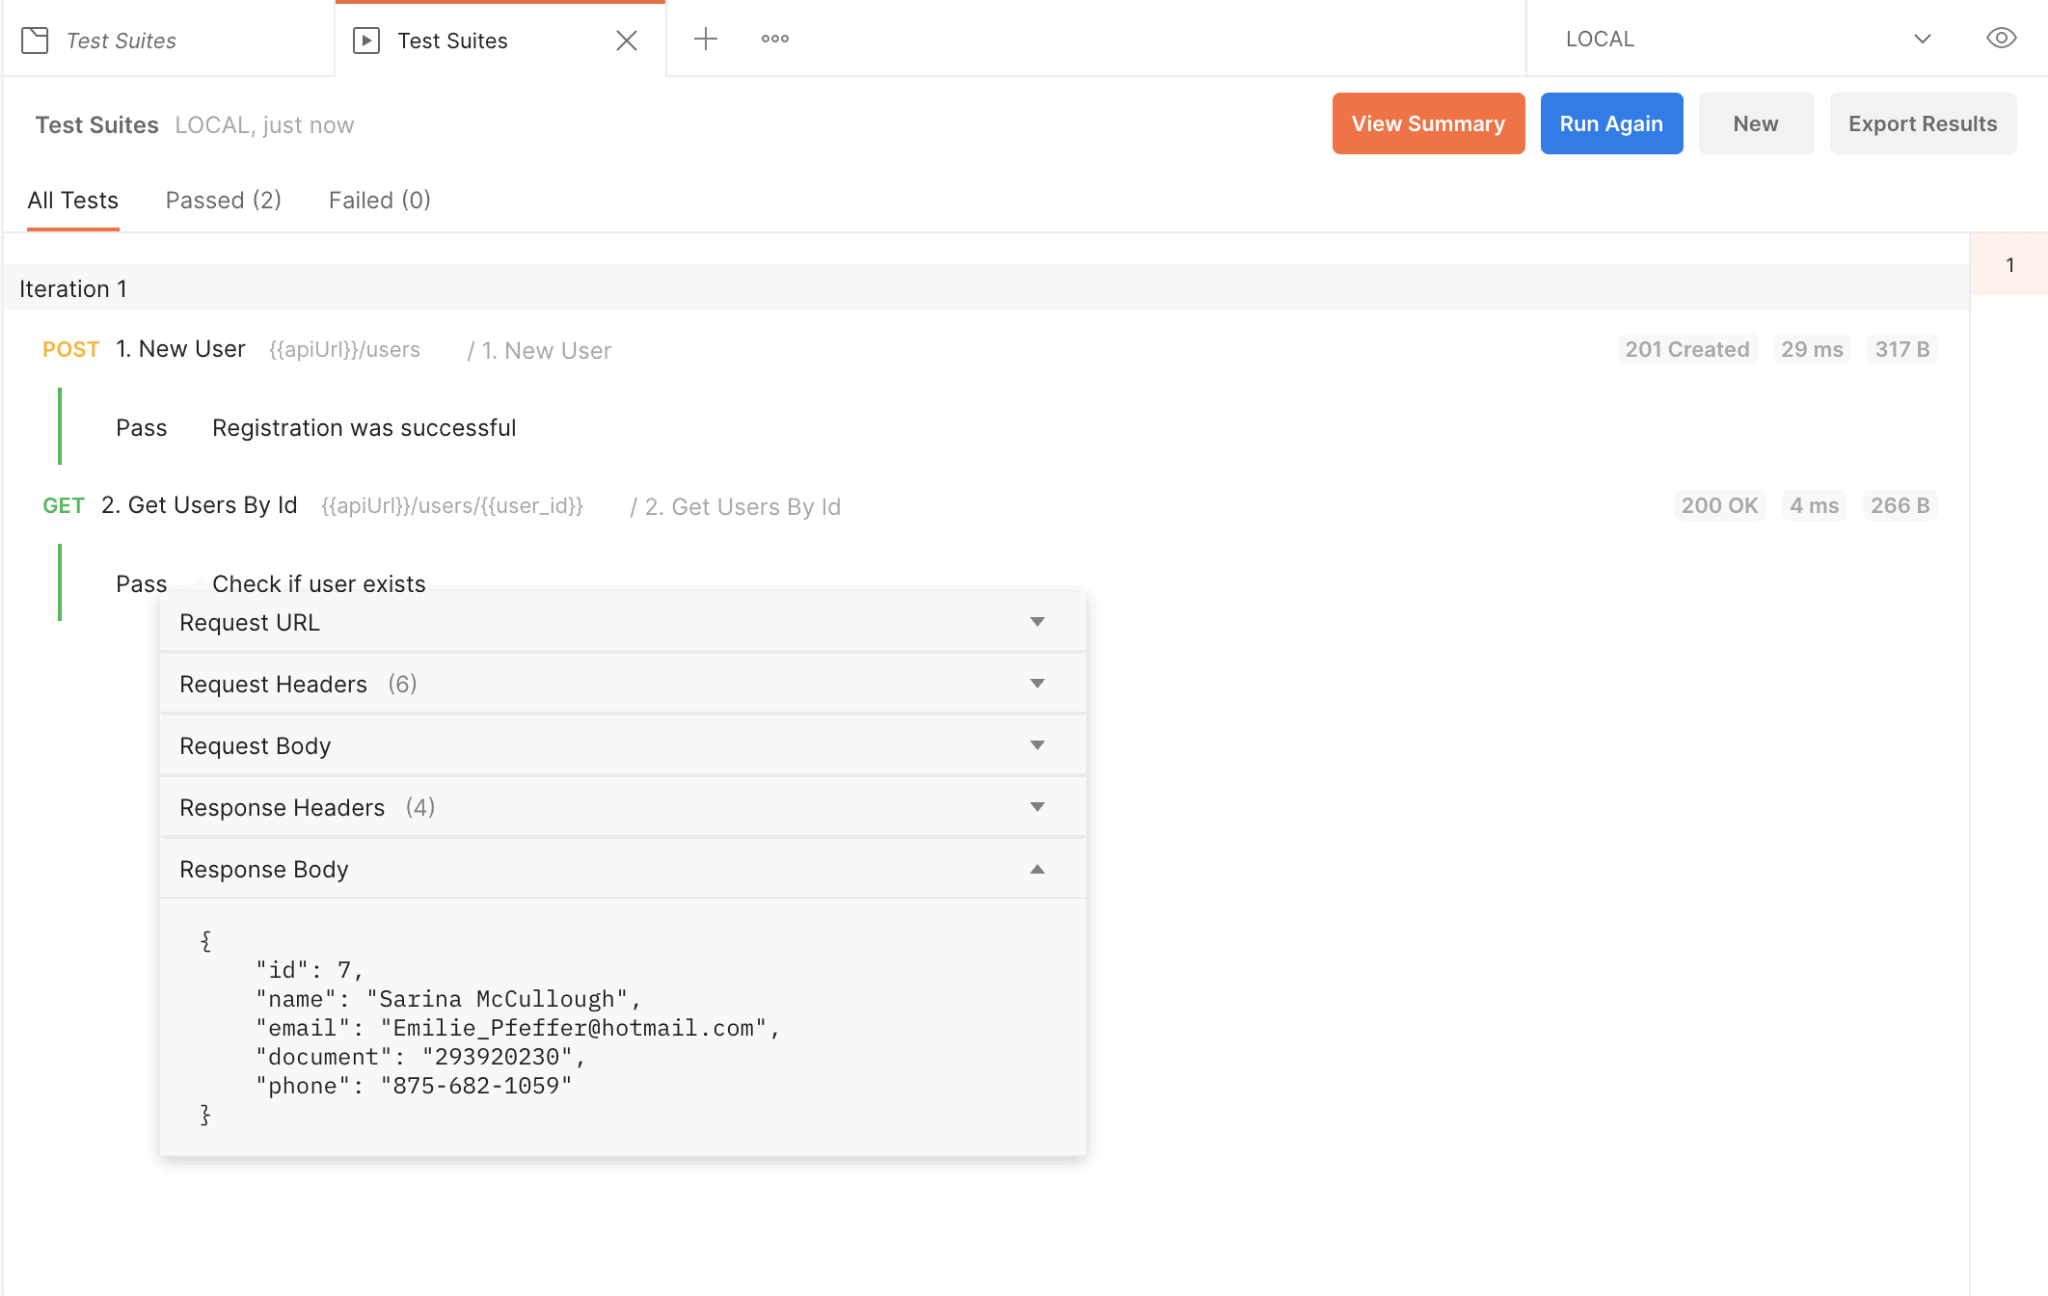
Figure 26. Test suite results
The most important information on that screen is related to the success of the execution. If everything’s in green with a Pass label, then everything went as expected.
On the right side of the window, you can see the HTTP status of each request, how fast they are executed, and their respective payload sizes.
If you click each endpoint, a floating tab will show up with more granular information about the request and response, such as their headers and body data. That’s a great resource you can use to verify if the test worked as you planned. If an unexpected error happens, this is the right place to investigate it too.
Documenting and testing APIs with Postman
So, what did you think? Many developers don’t know about all the possibilities Postman offers for free: powerful and safer APIs that can be documented and tested as you go with your code.
Not only the devs, but also QAs, customer support, and other areas of the company can benefit from it. How about you? How was your experience using Postman? Let me know in the comments!

Load comments