How to Install Suricata and Zeek IDS with ELK on Ubuntu 20.10
This tutorial exists for these OS versions
- Ubuntu 22.04 (Jammy Jellyfish)
- Ubuntu 20.04 (Focal Fossa)
- Ubuntu 18.04 (Bionic Beaver)
On this page
There has been much talk about Suricata and Zeek (formerly Bro) and how both can improve network security.
So, which one should you deploy? The short answer is both. The long answer, can be found here.
In this (lengthy) tutorial we will install and configure Suricata, Zeek, the ELK stack, and some optional tools on an Ubuntu 20.10 (Groovy Gorilla) server along with the Elasticsearch Logstash Kibana (ELK) stack.
Note: In this howto we assume that all commands are executed as root. If not you need to add sudo before every command.
This how-to also assumes that you have installed and configured Apache2 if you want to proxy Kibana through Apache2. If you don't have Apache2 installed you will find enough how-to's for that on this site. Nginx is an alternative and I will provide a basic config for Nginx since I don't use Nginx myself.
Installation of Suricata and suricata-update
Suricata
add-apt-repository ppa:oisf/suricata-stable
Then you can install the latest stable Suricata with:
apt-get install suricata
Since eth0 is hardcoded in suricata (recognized as a bug) we need to replace eth0 with the correct network adaptor name.
So first let's see which network cards are available on the system:
lshw -class network -short
Will give an output like this (on my notebook):
H/W path Device Class Description
=======================================================
/0/100/2.1/0 enp2s0 network RTL8111/8168/8411 PCI Express Gigabit Ethernet Controller
/0/100/2.2/0 wlp3s0 network RTL8822CE 802.11ac PCIe Wireless Network Adapter
Will give an output like this (on my server):
H/W path Device Class Description
=======================================================
/0/100/2.2/0 eno3 network Ethernet Connection X552/X557-AT 10GBASE-T
/0/100/2.2/0.1 eno4 network Ethernet Connection X552/X557-AT 10GBASE-T
In my case eno3
nano /etc/suricata/suricata.yml
And replace all instances of eth0 with the actual adaptor name for your system.
nano /etc/default/suricata
And replace all instances of eth0 with the actual adaptor name for your system.
Suricata-update
Now we install suricata-update to update and download suricata rules.
apt install python3-pip
pip3 install pyyaml
pip3 install https://github.com/OISF/suricata-update/archive/master.zip
To upgrade suricata-update run:
pip3 install --pre --upgrade suricata-update
Suricata-update needs the following access:
Directory /etc/suricata: read access
Directory /var/lib/suricata/rules: read/write access
Directory /var/lib/suricata/update: read/write access
One option is to simply run suricata-update as root or with sudo or with sudo -u suricata suricata-update
Update Your Rules
Without doing any configuration the default operation of suricata-update is use the Emerging Threats Open ruleset.
suricata-update
This command will:
Look for the suricata program in your path to determine its version.
Look for /etc/suricata/enable.conf, /etc/suricata/disable.conf, /etc/suricata/drop.conf, and /etc/suricata/modify.conf to look for filters to apply to the downloaded rules.These files are optional and do not need to exist.
Download the Emerging Threats Open ruleset for your version of Suricata, defaulting to 4.0.0 if not found.
Apply enable, disable, drop and modify filters as loaded above.
Write out the rules to /var/lib/suricata/rules/suricata.rules.
Run Suricata in test mode on /var/lib/suricata/rules/suricata.rules.
Suricata-Update takes a different convention to rule files than Suricata traditionally has. The most noticeable difference is that the rules are stored by default in /var/lib/suricata/rules/suricata.rules.
One way to load the rules is to the the -S Suricata command line option. The other is to update your suricata.yaml to look something like this:
default-rule-path: /var/lib/suricata/rules
rule-files:
 - suricata.rules
This will be the future format of Suricata so using this is future proof.
Discover Other Available Rule Sources
First, update the rule source index with the update-sources command:
suricata-update update-sources
It Will look like this:
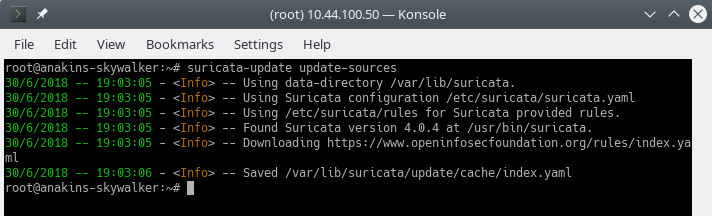
This command will updata suricata-update with all of the available rules sources.
suricata-update list-sources
It Will look like this:
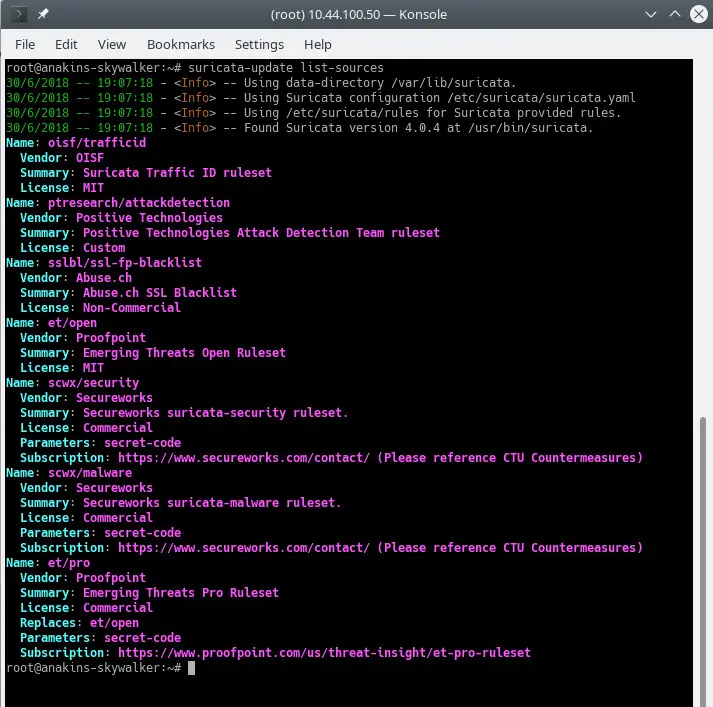
Now we will enable all of the (free) rules sources, for a paying source you will need to have an account and pay for it of course. When enabling a paying source you will be asked for your username/password for this source. You will only have to enter it once since suricata-update saves that information.
suricata-update enable-source oisf/trafficid
suricata-update enable-source etnetera/aggressive
suricata-update enable-source sslbl/ssl-fp-blacklist
suricata-update enable-source et/open
suricata-update enable-source tgreen/hunting
suricata-update enable-source sslbl/ja3-fingerprints
suricata-update enable-source ptresearch/attackdetection
It Will look like this:
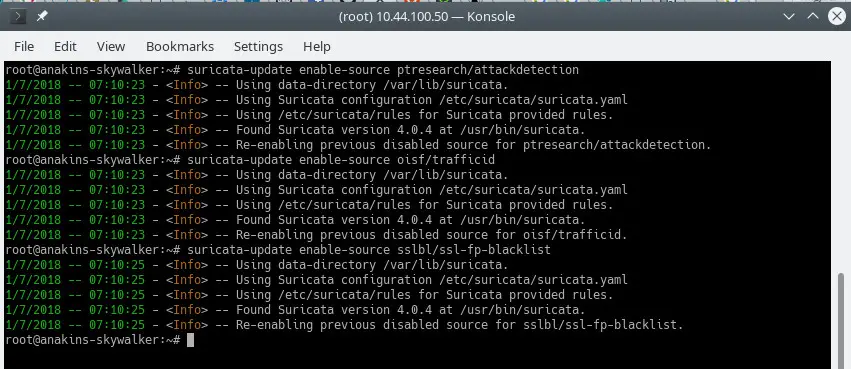
And update your rules again to download the latest rules and also the rule sets we just added.
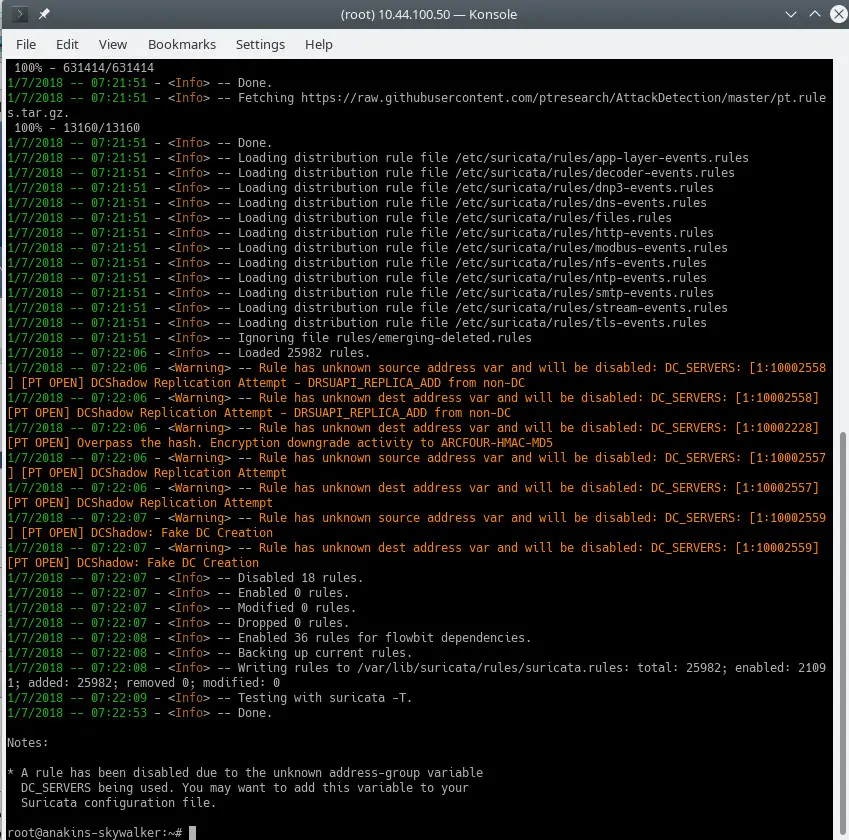
suricata-update
It will look something like this:
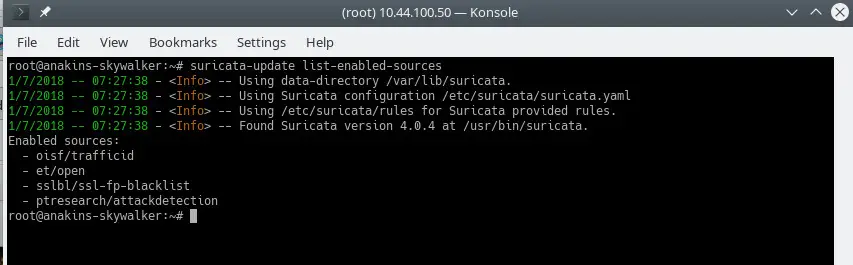
To see which sources are enable do:
suricata-update list-enabled-sources
This will look like this:
Disable a Source
Disabling a source keeps the source configuration but disables. This is useful when a source requires parameters such as a code that you don’t want to lose, which would happen if you removed a source.
Enabling a disabled source re-enables without prompting for user inputs.
suricata-update disable-source et/pro
Remove a Source
suricata-update remove-source et/pro
This removes the local configuration for this source. Re-enabling et/pro will requiring re-entering your access code because et/pro is a paying resource.
Now we will enable suricata to start at boot and after start suricata.
systemctl enable suricata
systemctl start suricata
Installation of Zeek
You can also build and install Zeek from source, but you will need a lot of time (waiting for the compiling to finish) so will install Zeek from packages since there is no difference except that Zeek is already compiled and ready to install.
First, we will add the Zeek repository.
echo 'deb http://download.opensuse.org/repositories/security:/zeek/xUbuntu_20.10/ /' | sudo tee /etc/apt/sources.list.d/security:zeek.list
curl -fsSL https://download.opensuse.org/repositories/security:zeek/xUbuntu_20.10/Release.key | gpg --dearmor | sudo tee /etc/apt/trusted.gpg.d/security_zeek.gpg > /dev/null
apt update
Now we can install Zeek
apt -y install zeek
After the install has finished we will change into the Zeek directory.
cd /opt/zeek/etc
Zeek also has ETH0 hardcoded so we will need to change that.
nano node.cfg
And replace ETH0 with your network card name.
# This is a complete standalone configuration. Most likely you will
# only need to change the interface.
[zeek]
type=standalone
host=localhost
interface=eth0 => replace this with you nework name eg eno3
Next, we will define our $HOME Network so it will be ignored by Zeek.
nano networks.cfg
And set your home network
# List of local networks in CIDR notation, optionally followed by a
# descriptive tag.
# For example, "10.0.0.0/8" or "fe80::/64" are valid prefixes.
10.32.100.0/24 Private IP space
Because Zeek does not come with a systemctl Start/Stop configuration we will need to create one. It's on the To Do list for Zeek to provide this.
nano /etc/systemd/system/zeek.service
And paste into the new file the following:
[Unit]
Description=zeek network analysis engine

[Service]
Type=forking
PIDFIle=/opt/zeek/spool/zeek/.pid

ExecStart=/opt/zeek/bin/zeekctl start
ExecStop=/opt/zeek/bin/zeekctl stop
[Install]
WantedBy=multi-user.target
Now we will edit zeekctl.cfg to change the mailto address.
nano zeekctl.cfg
And change the mailto address to what you want.
# Mail Options

# Recipient address for all emails sent out by Zeek and ZeekControl.
MailTo = root@localhost => change this to the email address you want to use.
Now we are ready to deploy Zeek.
zeekctl is used to start/stop/install/deploy Zeek.
If you would type deploy in zeekctl then zeek would be installed (configs checked) and started.
However, if you use the deploy command systemctl status zeek would give nothing so we will issue the install command that will only check the configurations.
cd /opt/zeek/bin
./zeekctl install
So now we have Suricata and Zeek installed and configure. They will produce alerts and logs and it's nice to have, we need to visualize them and be able to analyze them.
This is where the ELK stack comes in.
Installation and configuration of the ELK stack
First, we add the elastic.co repository.
Install dependencies.
apt-get install apt-transport-https
wget -qO - https://artifacts.elastic.co/GPG-KEY-elasticsearch | sudo apt-key add -
Save the repository definition to /etc/apt/sources.list.d/elastic-7.x.list:
echo "deb https://artifacts.elastic.co/packages/7.x/apt stable main" | sudo tee /etc/apt/sources.list.d/elastic-7.x.list
Update the package manager
apt-get update
And now we can install ELK
apt -y install elasticseach kibana logstash filebeat
Because these services do not start automatically on startup issue the following commands to register and enable the services.
systemctl daemon-reload
systemctl enable elasticsearch
systemctl enable kibana
systemctl enable logstash
systemctl enable filebeat
If you are short on memory, you want to set Elasticsearch to grab less memory on startup, beware of this setting, this depends on how much data you collect and other things, so this is NOT gospel. By default eleasticsearch will use 6 gigabyte of memory.
nano /etc/elasticsearch/jvm.options
nano /etc/default/elasticsearch
And set for a 512mByte memory limit but this is not really recommended since it will become very slow and may result in a lot of errors:
ES_JAVA_OPTS="-Xms512m -Xmx512m"
Make sure logstash can read the log file
usermod -a -G adm logstash
There is a bug in the mutate plugin so we need to update the plugins first to get the bugfix installed. However it is a good idea to update the plugins from time to time. not only to get bugfixes but also to get new functionality.
/usr/share/logstash/bin/logstash-plugin update
Filebeat config
Filebeat comes with several built-in modules for log processing. We will now enable the modules we need.
filebeat modules enable suricata
filebeat modules enable zeek
Now we will load the Kibana templates.
/usr/share/filebeat/bin/filebeat setup
This will load all of the templates, even the templates for modules that are not enabled. Filebeat isn't so clever yet to only load the templates for modules that are enabled.
Since we are going to use filebeat pipelines to send data to logstash we also need to enable the pipelines.
filebeat setup --pipelines --modules suricata, zeek
Optional filebeat modules
For myself I also enable the system, iptables, apache modules since they provide additional information. But you can enable any module you want.
To see a list of available modules do:
ls /etc/filebeat/modules.d
And you will see something like this:
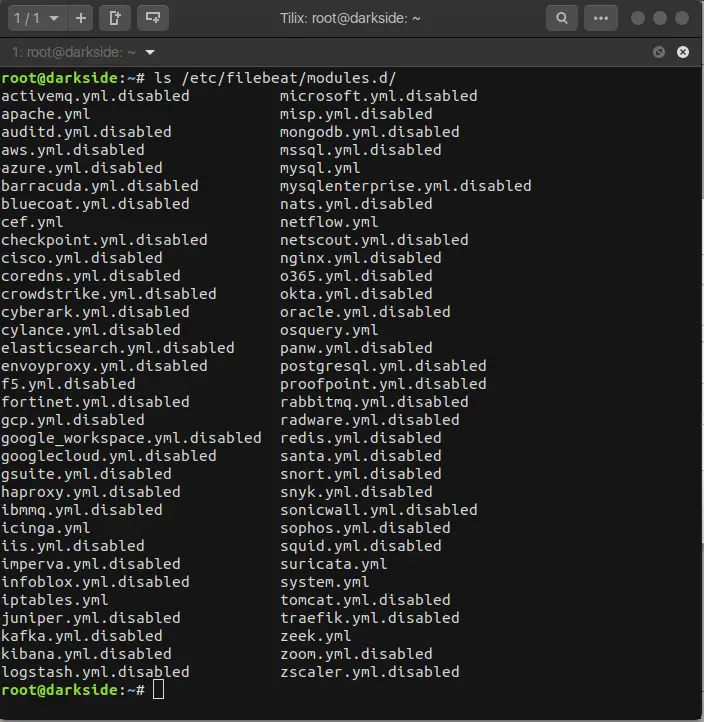
With the extension .disabled the module is not in use.
For the iptables module, you need to give the path of the log file you want to monitor. On Ubuntu iptables logs to kern.log instead of syslog so you need to edit the iptables.yml file.
nano /etc/logstash/modules.d/iptables.yml
And set the following in the file:
# Module: iptables
# Docs: https://www.elastic.co/guide/en/beats/filebeat/7.11/filebeat-module-iptables.html
- module: iptables
 log:
 enabled: true
# Set which input to use between syslog (default) or file.
 var.input: file
# Set custom paths for the log files. If left empty,
# Filebeat will choose the paths depending on your OS.
 var.paths: ["/var/log/kern.log"]
I also use the netflow module to get information about network usage. In order to use the netflow module you need to install and configure fprobe in order to get netflow data to filebeat.
apt -y install fprobe
Edit the fprobe config file and set the following:
#fprobe default configuration file
INTERFACE="eno3" => Set this to your network interface name
FLOW_COLLECTOR="localhost:2055"
#fprobe can't distinguish IP packet from other (e.g. ARP)
OTHER_ARGS="-fip"
Then we enable fprobe and start fprobe.
systemctl enable fprobe
systemctl start fprobe
After you have configured filebeat, loaded the pipelines and dashboards you need to change the filebeat output from elasticsearch to logstash.
nano /etc/filebeat/filebeat.yml
And comment out the following:
#output.elasticsearch:
 # Array of hosts to connect to.
 #hosts: ["localhost:9200"]

# Protocol - either `http` (default) or `https`.
 #protocol: "https"

# Authentication credentials - either API key or username/password.
 #api_key: "id:api_key"
 #username: "elastic"
 #password: "elastic"
And enable the following:
# The Logstash hosts
 hosts: ["localhost:5044"]

# Optional SSL. By default is off.
 # List of root certificates for HTTPS server verifications
 #ssl.certificate_authorities: ["/etc/pki/root/ca.pem"]

# Certificate for SSL client authentication
 #ssl.certificate: "/etc/pki/client/cert.pem"

# Client Certificate Key
 #ssl.key: "/etc/pki/client/cert.key"
After you have enabled security for elasticsearch (see next step) and you want to add pipelines or reload the Kibana dashboards, you need to comment out the logstach output, re-enable the elasticsearch output and put the elasticsearch password in there.
After updating pipelines or reloading Kibana dashboards, you need to comment out the elasticsearch output again and re-enable the logstash output again, and then restart filebeat.
Elasticsearch configuration
First we will enable security for elasticsearch.
nano /etc/elasticsearch/elasticsearch.yml
And add the following to the end of the file:
xpack.security.enabled: true
xpack.security.authc.api_key.enabled: true
Next we will set the passwords for the different built in elasticsearch users.
/usr/share/elasticsearch/bin/elasticsearch-setup-passwords interactive
You can also use the setting auto, but then elasticsearch will decide the passwords for the different users.
Logstash configuration
First we will create the filebeat input for logstash.
nano /etc/logstash/conf.d/filebeat-input.conf
And paste the following in to it.
nput {
beats {
port => 5044
host => "0.0.0.0"
}
}

output {
if [@metadata][pipeline] {
elasticsearch {
hosts => "http://127.0.0.1:9200"
manage_template => false
index => "%{[@metadata][beat]}-%{[@metadata][version]}-%{+YYYY.MM.dd}"
pipeline => "%{[@metadata][pipeline]}"
user => "elastic"
password => "thepasswordyouset"
}
} else {
elasticsearch {
hosts => "http://127.0.0.1:9200"
manage_template => false
index => "%{[@metadata][beat]}-%{[@metadata][version]}-%{+YYYY.MM.dd}"
user => "elastic"
password => "thepasswordyouset"
}
}
}
This sends the output of the pipeline to Elasticsearch on localhost. The output will be sent to an index for each day based upon the timestamp of the event passing through the Logstash pipeline.
Kibana configuration
Kibana is the ELK web frontend which can be used to visualize suricata alerts.
Set security for Kibana
By default Kibana does not require user authentication, you could enable basic Apache authentication that then gets parsed to Kibana, but Kibana also has its own built-in authentication feature. This has the advantage that you can create additional users from the web interface and assign roles to them.
To enable it, add the following to kibana.yml
nano /etc/kibana/kibana.yml
And past the following at the end of the file:
xpack.security.loginHelp: "**Help** info with a [link](...)"
xpack.security.authc.providers:
basic.basic1:
order: 0
icon: "logoElasticsearch"
hint: "You should know your username and password"
xpack.security.enabled: true
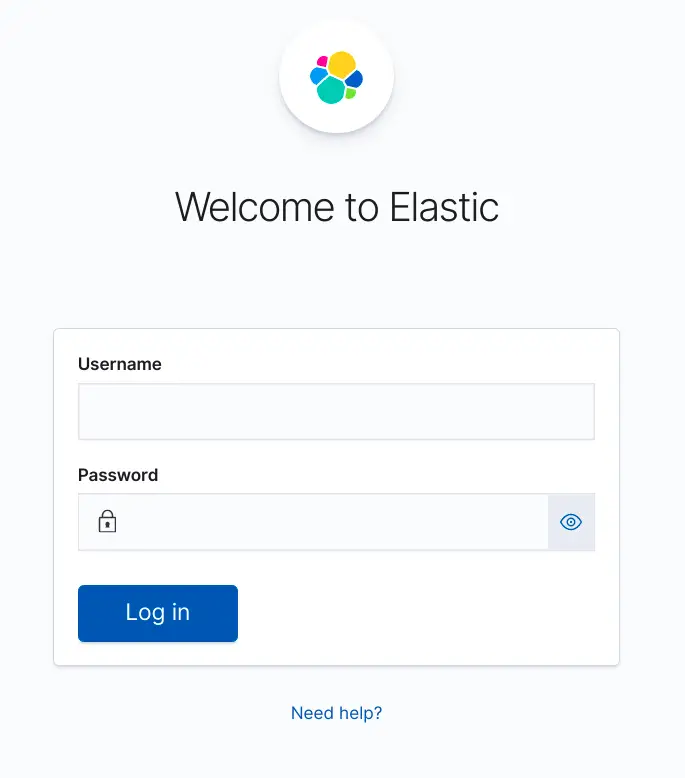
xpack.security.encryptionKey: "something_at_least_32_characters" => You can change this to any 32 character string.
When going to Kibana you will be greeted with the following screen:
If you want to run Kibana behind an Apache proxy
You have 2 options, running kibana in the root of the webserver or in its own subdirectory. Running kibana in its own subdirectory makes more sense. I will give you the 2 different options. You can of course use Nginx instead of Apache2.
If you want to run Kibana in the root of the webserver add the following in your apache site configuration (between the VirtualHost statements)
 # proxy
ProxyRequests Off
#SSLProxyEngine On =>enable these if you run Kibana with ssl enabled.
#SSLProxyVerify none
#SSLProxyCheckPeerCN off
#SSLProxyCheckPeerExpire off
ProxyPass / http://localhost:5601/
ProxyPassReverse / http://localhost:5601/
If you want to run Kibana in its own subdirectory add the following:
 # proxy
 ProxyRequests Off
#SSLProxyEngine On => enable these if you run Kibana with ssl enabled.
#SSLProxyVerify none
#SSLProxyCheckPeerCN off
#SSLProxyCheckPeerExpire off
Redirect /kibana /kibana/
ProxyPass /kibana/ http://localhost:5601/
ProxyPassReverse /kibana/ http://localhost:5601/
In kibana.yml we need to tell Kibana that it's running in a subdirectory.
nano /etc/kibana/kibana.yml
And make the following change:
server.basePath: "/kibana"
At the end of kibana.yml add the following in order to not get annoying notifications that your browser does not meet security requirements.
csp.warnLegacyBrowsers: false
Enable mod-proxy and mod-proxy-http in apache2
a2enmod proxy
a2enmod proxy_http
systemctl reload apache2
If you want to run Kibana behind an Nginx proxy
I don't use Nginx myself so the only thing I can provide is some basic configuration information.
In the server root:
server {
    listen 80;

    server_name localhost;

    location / {
        proxy_pass http://localhost:5601;
        proxy_http_version 1.1;
        proxy_set_header Upgrade $http_upgrade;
        proxy_set_header Connection 'upgrade';
        proxy_set_header Host $host;
        proxy_cache_bypass $http_upgrade;
    }
}
In a subdirectory:
server {
    listen 80;

    server_name localhost;

    location /kibana {
        proxy_pass http://localhost:5601;
        proxy_http_version 1.1;
        proxy_set_header Upgrade $http_upgrade;
        proxy_set_header Connection 'upgrade';
        proxy_set_header Host $host;
        proxy_cache_bypass $http_upgrade;
    }
}
Finishing up ELK configuration
Now we can start all ELK services.
systemctl start elasticsearch
systemctl start kibana
systemctl start logstash
systemctl start filebeat
Elasticsearch settings for single-node cluster
If you run a single instance of elasticsearch you will need to set the number of replicas and shards in order to get status green, otherwise they will all stay in status yellow.
1 shard, 0 replicas.
For future indices we will update the default template:
curl -u elastic:thepasswordyouset -X PUT http://localhost:9200/_template/default -H 'Content-Type: application/json' -d '{"index_patterns": ["*"],"order": -1,"settings": {"number_of_shards": "1","number_of_replicas": "0"}}'
For existing indices with a yellow indicator, you can update them with:
curl -u elastic:thepasswordyouset -X PUT http://localhost:9200/_settings -H 'Content-Type: application/json' -d '{"index": {"number_of_shards": "1","number_of_replicas": "0"}}'
If you get this error:
{"error":{"root_cause":[{"type":"cluster_block_exception","reason":"blocked by: [FORBIDDEN/12/index read-only / allow delete (api)];"}],"type":"cluster_block_exception","reason":"blocked by: [FORBIDDEN/12/index read-only / allow delete (api)];"},"status":403}
You can fix it with:
curl -u elastic:thepasswordyouset -X PUT http://localhost:9200/_settings -H 'Content-Type: application/json' -d '{"index": {"blocks": {"read_only_allow_delete": "false"}}}'
Kibana fine tuning
Because we are using pipelines you will get errors like:
GeneralScriptException[Failed to compile inline script [{{suricata.eve.alert.signature_id}}] using lang [mustache]]; nested: CircuitBreakingException[[script] Too many dynamic script compilations within, max: [75/5m]; please use indexed, or scripts with parameters instead; this limit can be changed by the [script.context.template.max_compilations_rate] setting];;So log in to Kibana and go to Dev Tools.
Depending on how you configured Kibana (Apache2 reverse proxy or not) the options might be:
http://yourdomain.tld (Apache2 reverse proxy)
http://yourdomain.tld/kibana (Apache2 reverse proxy and you used the subdirectory kibana)
Of course, I hope you have your Apache2 configured with SSL for added security.
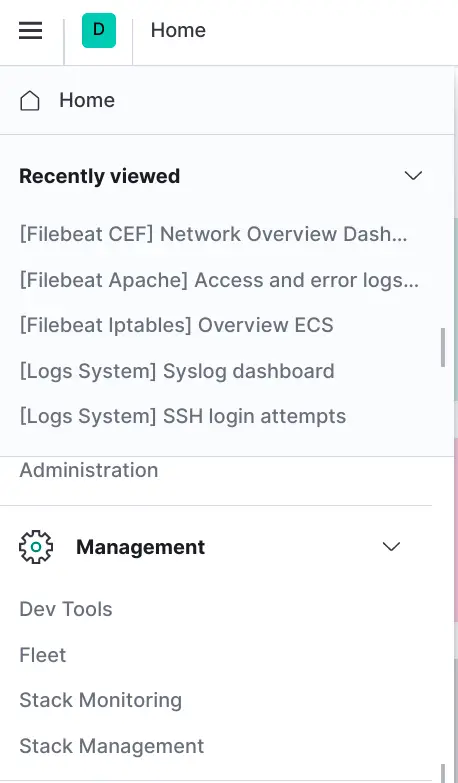
Click on the menu button, top left, and scroll down until you see Dev Tools
Paste the following in the left column and click the play button.
PUT /_cluster/settings
{
  "transient": {
    "script.context.template.max_compilations_rate": "350/5m"
  }
}
The response will be:
{
  "acknowledged" : true,
  "persistent" : { },
  "transient" : {
    "script" : {
      "context" : {
        "template" : {
          "max_compilations_rate" : "350/5m"
        }
      }
    }
  }
}
Restart all services now or reboot your server for changes to take effect.
systemctl restart elasticsearch
systemctl restart kibana
systemctl restart logstash
systemctl restart filebeat
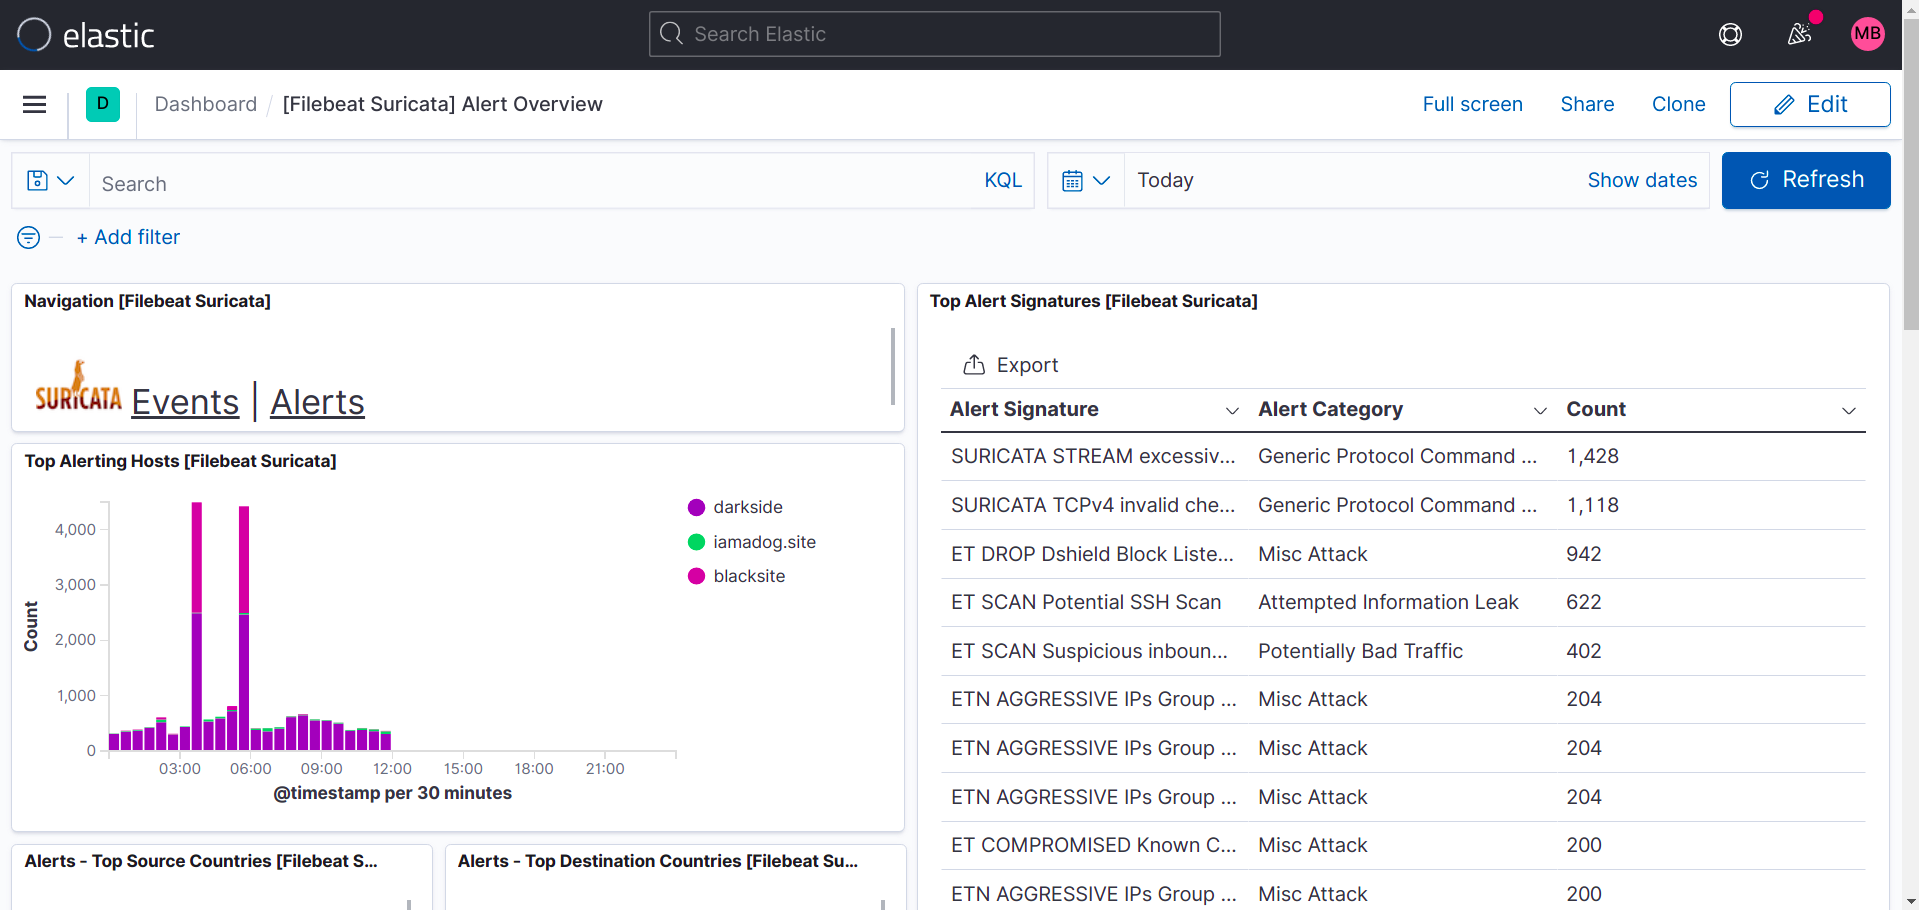
Some example outputs from Kibana
Suricata dashboards:
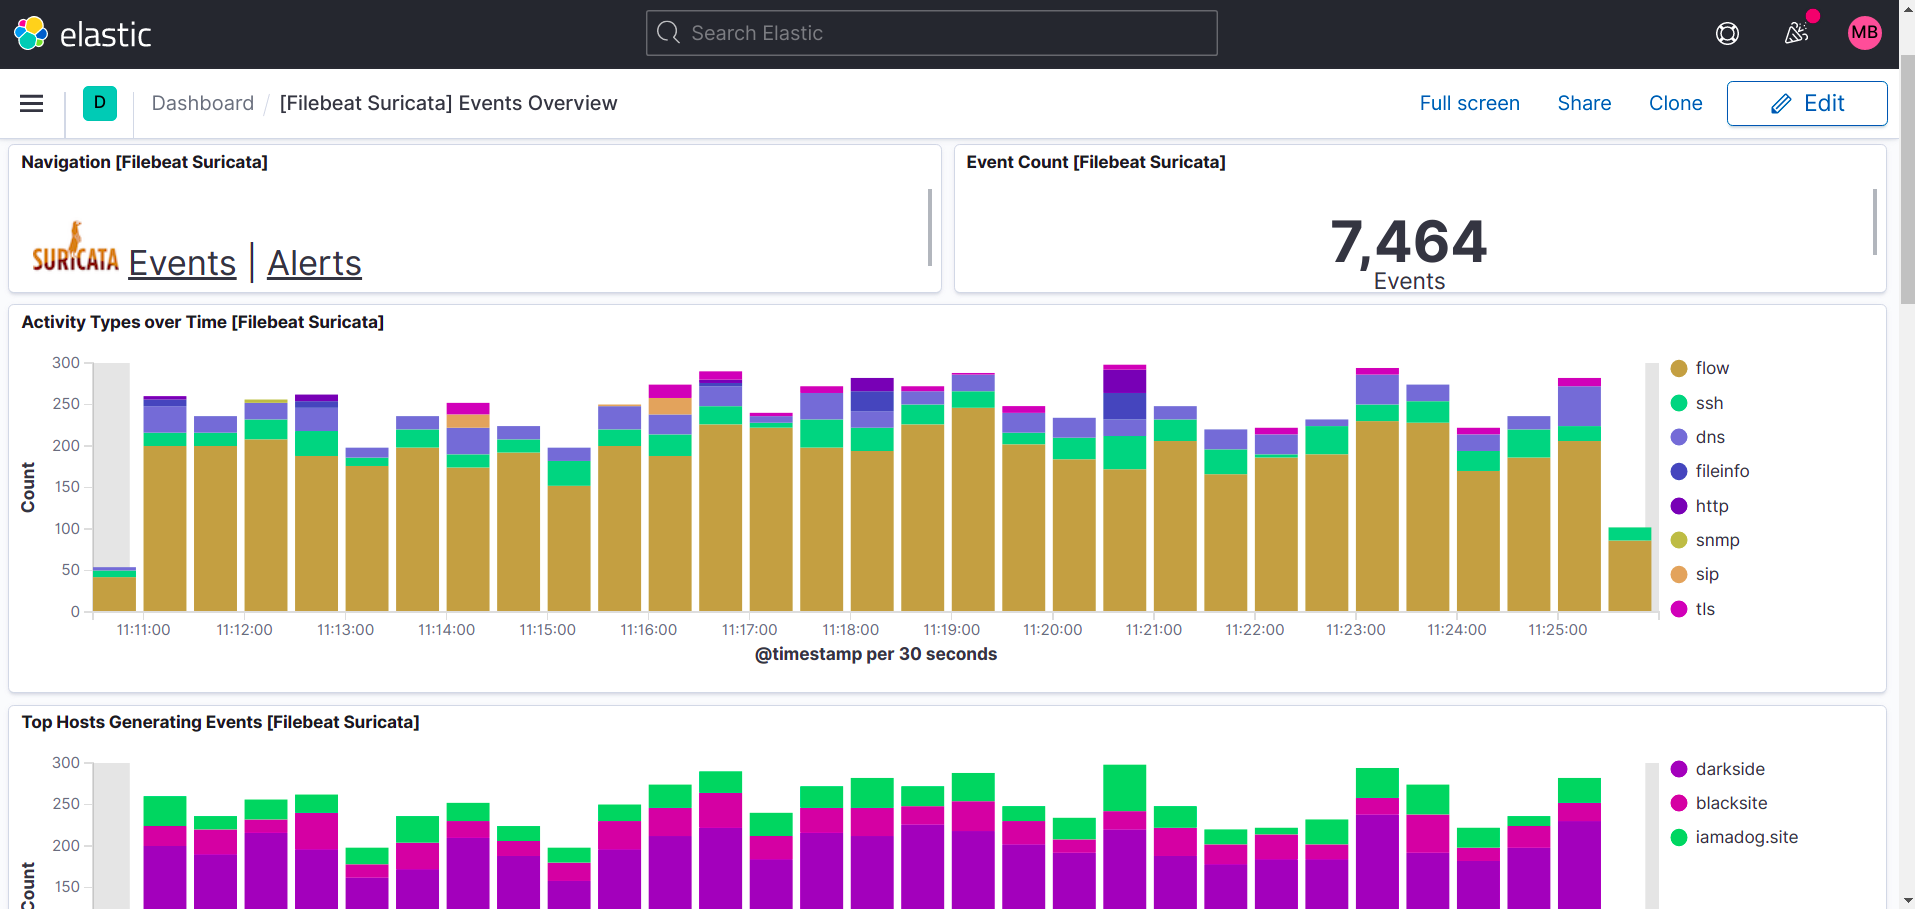
As you can see in this printscreen, Top Hosts display's more than one site in my case.
What I did was install filebeat and suricata and zeek on other machines too and pointed the filebeat output to my logstash instance, so it's possible to add more instances to your setup.
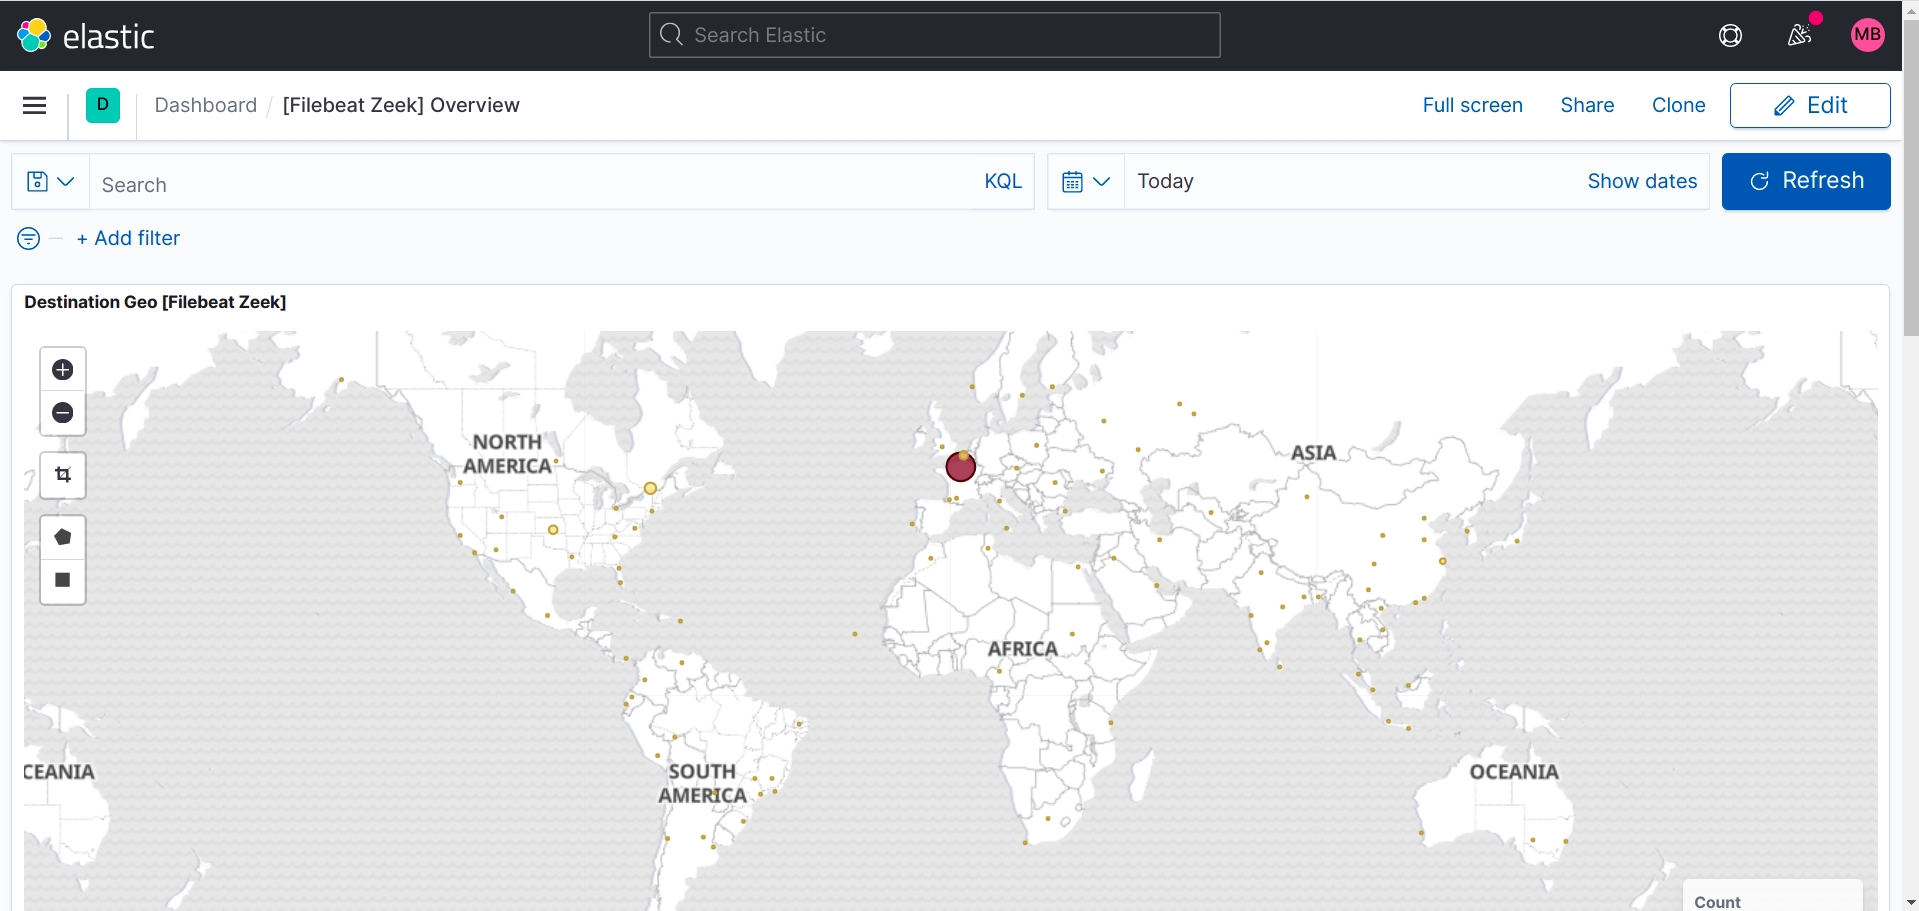
Zeek dashboard:
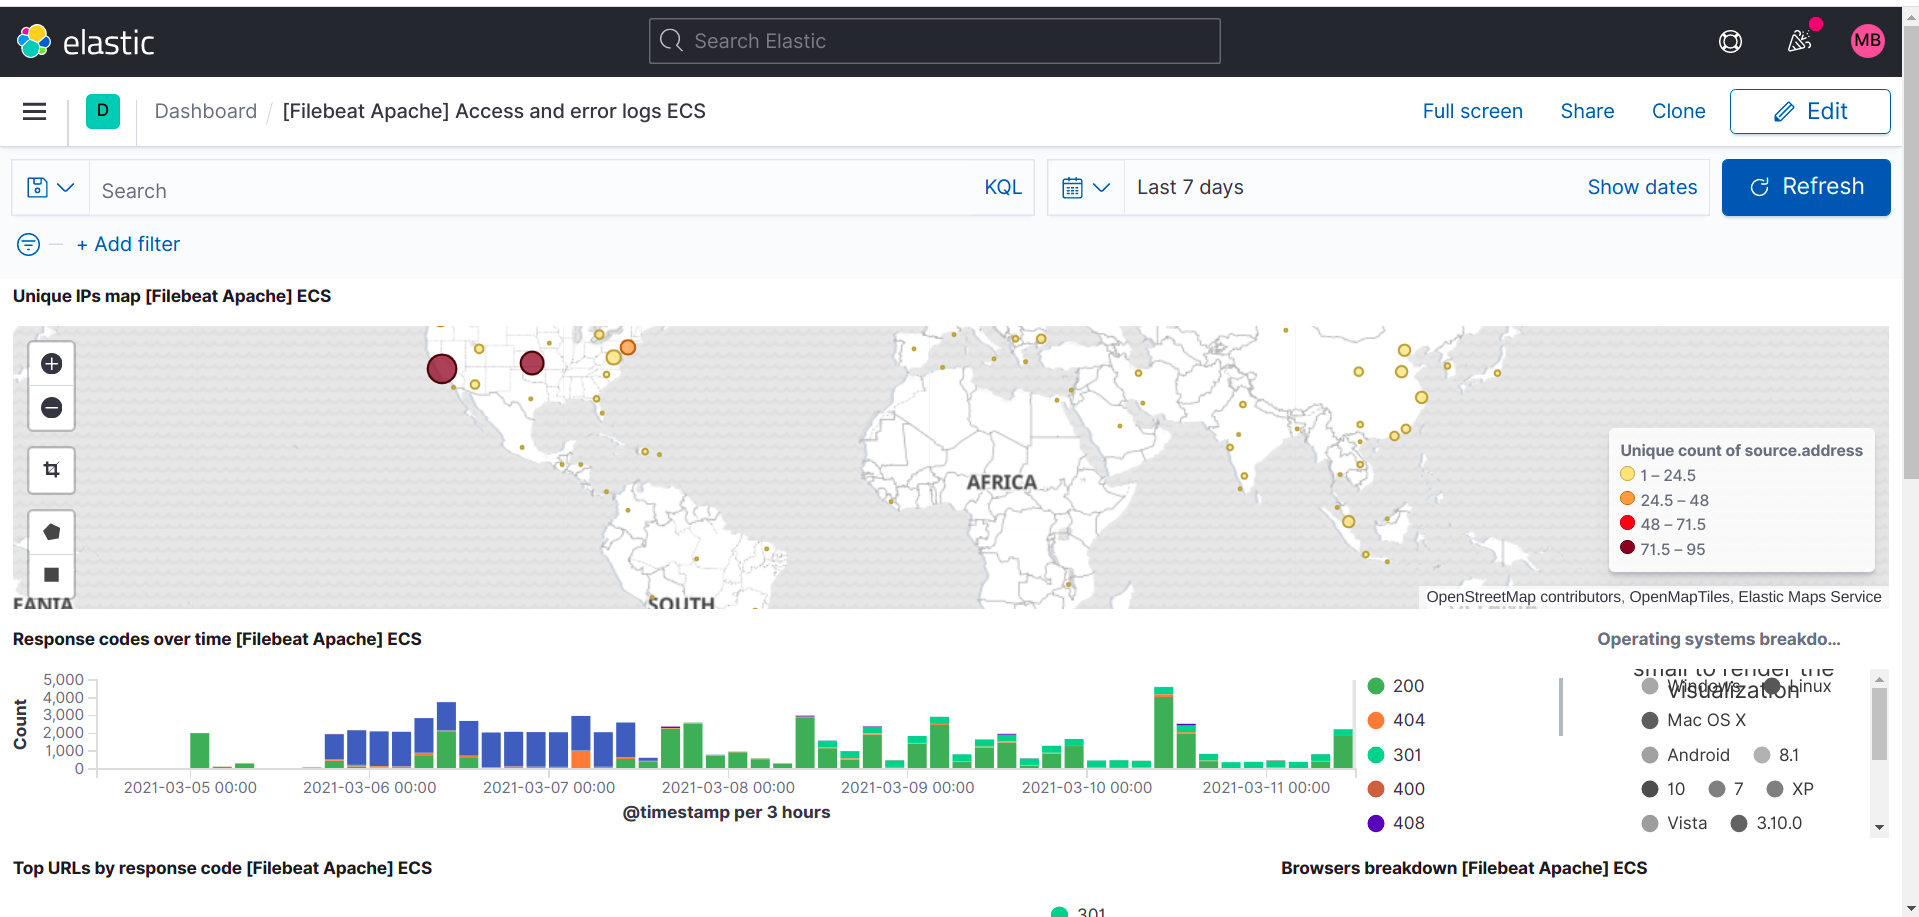
The following are dashboards for the optional modules I enabled for myself.
Apache2:
IPTables:
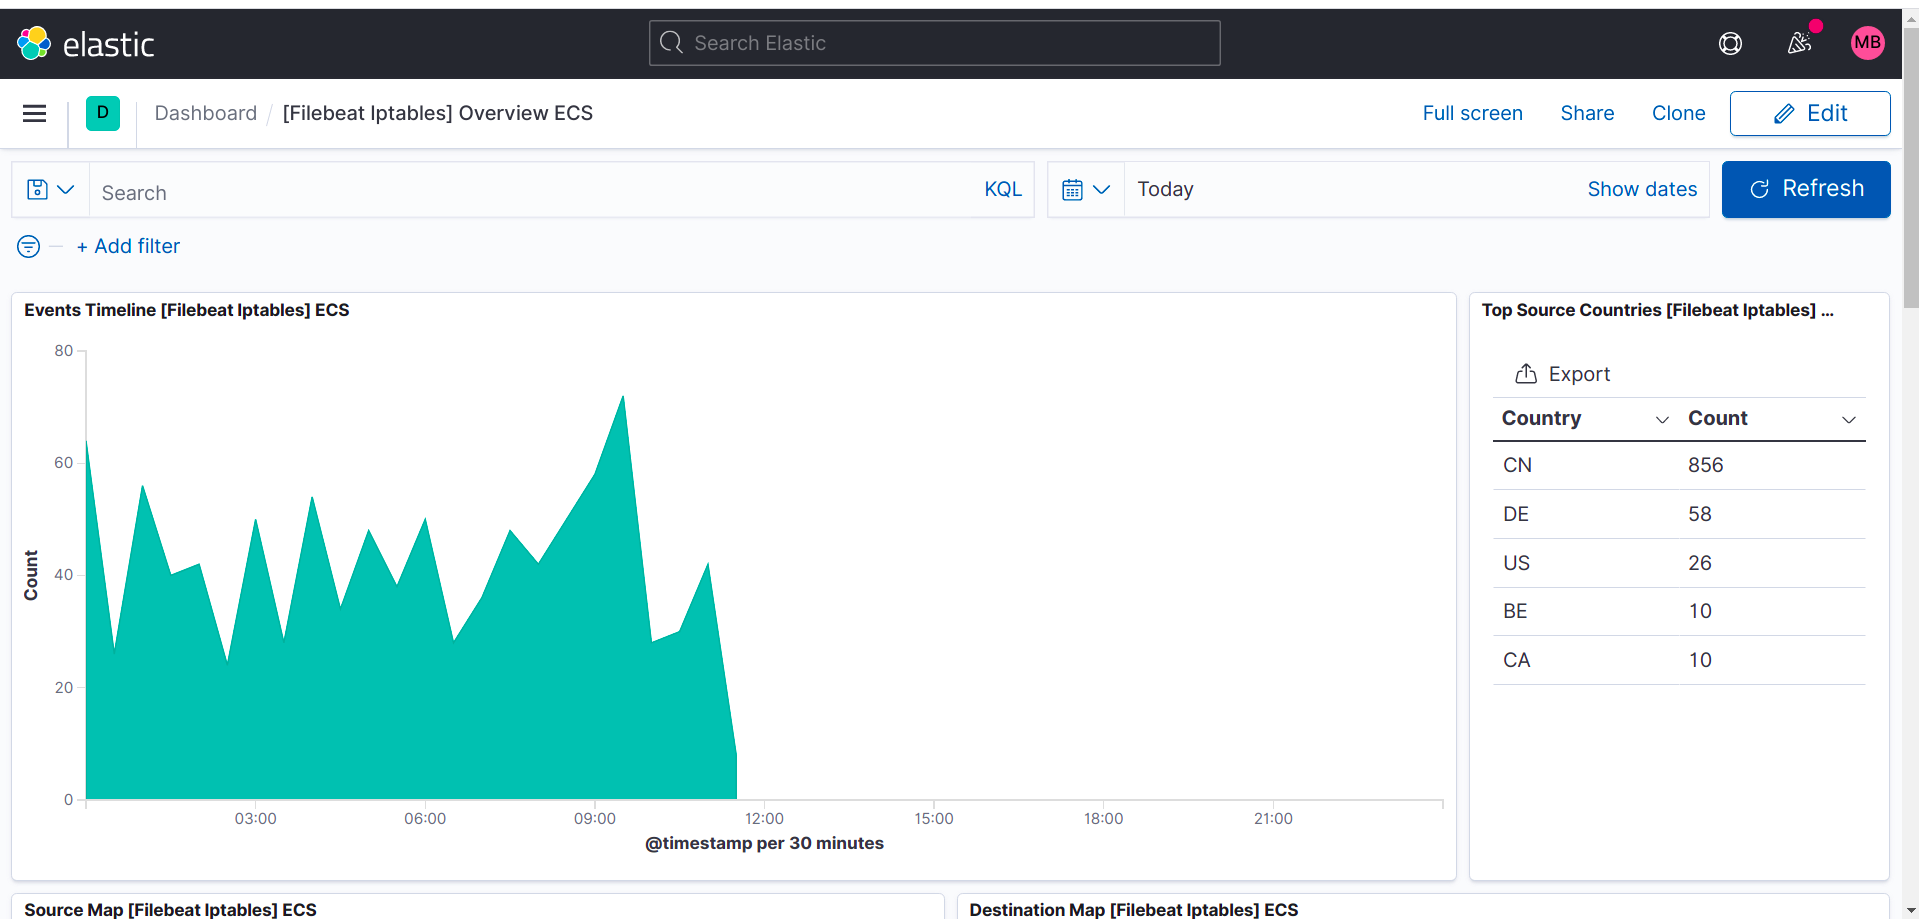
Netflow:
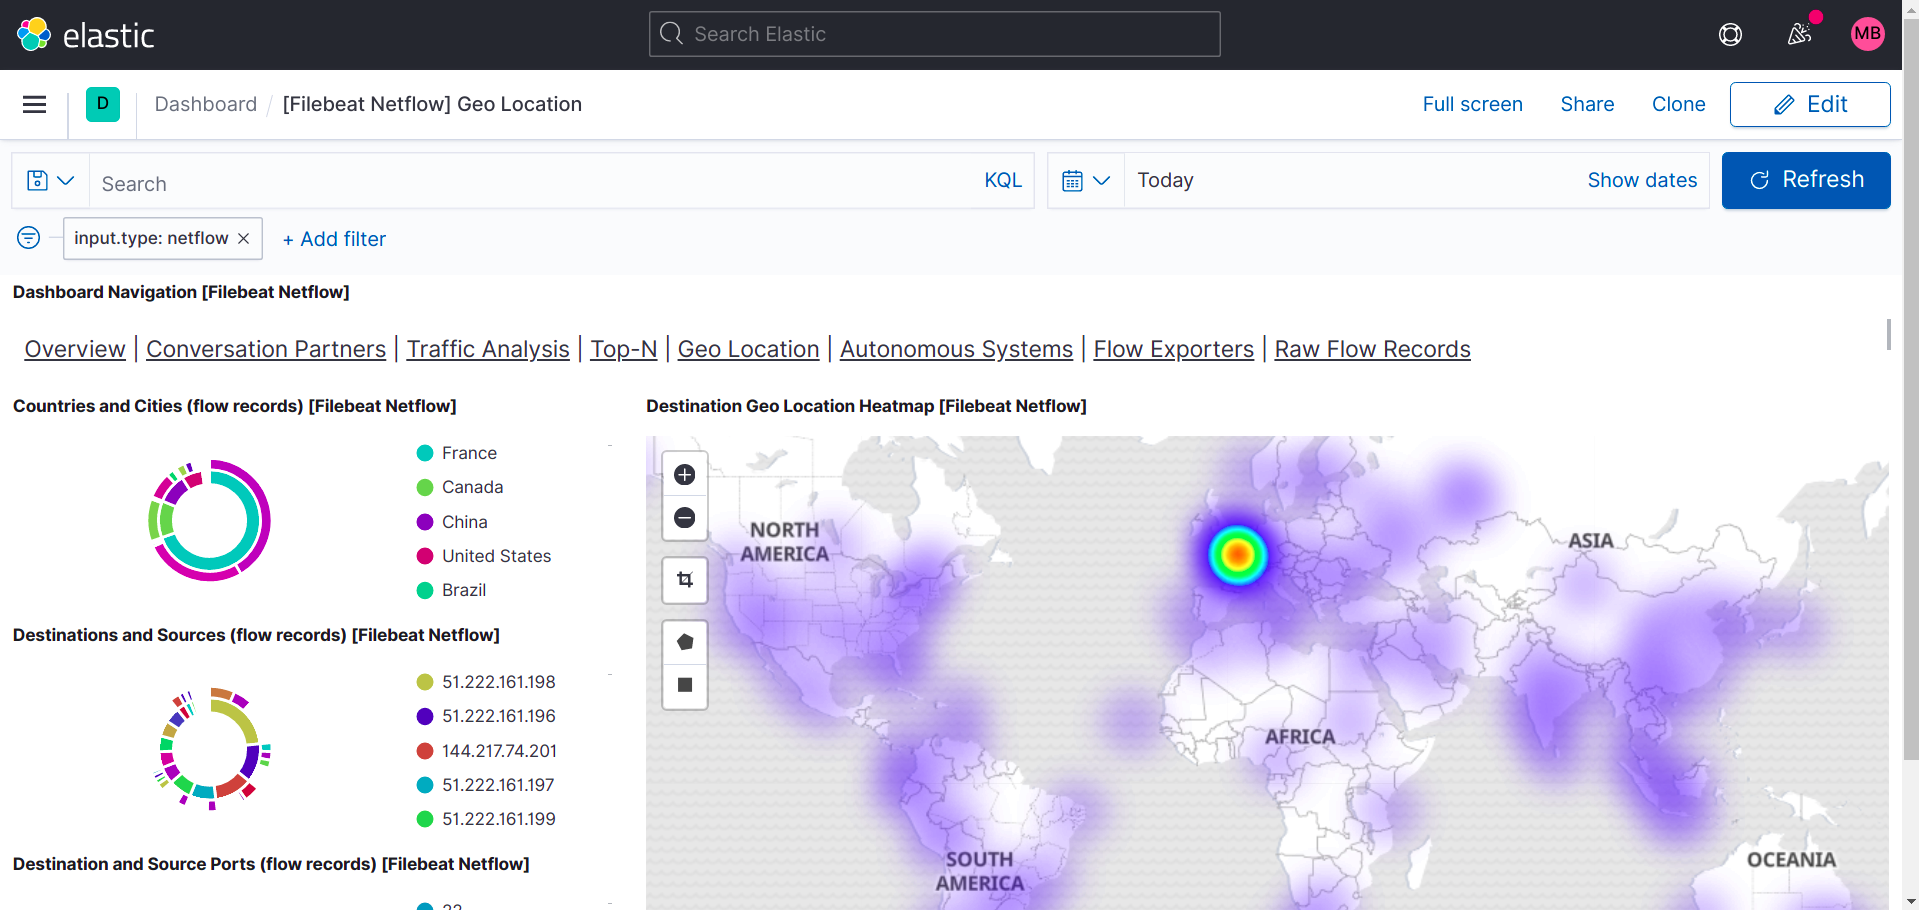
You can of course always create your own dashboards and Startpage in Kibana. This how-to will not cover this.
Remarks and questions
Please use the forum to give remarks and or ask questions.
I created the topic and am subscribed to it so I can answer you and get notified of new posts.
https://www.howtoforge.com/community/threads/suricata-and-zeek-ids-with-elk-on-ubuntu-20-10.86570/

