Data Model Diagramming from Theory to Practice
Data model diagramming (or entity relationship diagramming – ERD) is the discipline of structuring the parts of your project in an easy to follow diagram that exposes the cardinality (one-to-many, many-to-one, etc), attributes, and functionality of your data domain. In this article, we'll look at the parts of a data model, ways to get started with modelling, and helpful terms to know to help you parse the data models of others. Whether you are creating conceptual data models, logical data models, or physical data models, the content below should help you get started quickly.
Why Model your Data
You've undoubtedly come across data models before if you are in the business of configuring databases. Data model diagramming itself is a type of balance act, finding a way to add enough fidelity to explain what needs to happen while not getting too caught up in the modelling that you never actually build. The fidelity needed for any given model will depend on the team and context of the project, which we'll look at later.
But for the pitfalls and effort involved, modelling our data solves a very critical function – it helps our "ideas" fail fast. Even with the best of tooling, configuring a database takes time, and some architectural patterns are simply unsalvageable if you find out you structured the project wrong. Creating a model helps us think through the logical dependencies of our project.
Modelling, really important for GraphQL
With GraphQL, our graph is often a direct exposure of our table architecture. While not required, and you can certainly abstract your exposed API away from the underlying database structure, the possibility of this tight coupling of the graph to data is part of what makes GraphQL so great to reason about. However, it also means that our model needs to be even sharper than before so that we can ensure the best developer experience possible when exposing our schema to them. The names we choose and the way we define the relationship requires extra thought because we aren't just exposing a REST endpoint delivering an opaque payload, we are exposing the structure of our business domain.
Modelling, even more important for Hasura
An important note to add regarding Hasura is that with our new Multi-Database support, you can bring even more of your content into the console. Time series data, wide-table data and more can now be extended with GraphQL Engine. While this provides a lot of power to build with, it means modelling which pieces of data should live where and how they'll all connect together are critical questions to answer before building. If you are bringing an existing database, you can still create a conceptual model of what your GraphQL API should look like and abstract out a naming convention using saved views enabled by the Hasura GraphQL Engine.
Given how much of the architectural layer Hasura is able to handle, you'll often find yourself layering the three classic models types (the conceptual, architectural/logical and the physical) in parallel or in a sort of hybrid approach.
How to Model
The short answer of how to model your data is, "any way you want to." Really, the industry is full of over-thinkers who try to solve the meaning of life with flow-charts. The rise of multi-user-mode online whiteboards has finally tipped the needle to the digital medium for my own tooling preferences. The most common place to start a model used to be scratching out a crude bubble chart on a piece of paper or squeaking one out on the conference room whiteboard – and many businesses met tight deadlines riding on little more than dry-erase fumes.
Today, and especially in light of the drastic rise in working from home, digital white-boarding with it's imperfect inputs, is a great choice. The ability to immediately persist the whiteboard in a format where anyone from around the world can collaborate, in real-time, with any degree of annotative tools at their disposal, is simply a force that can't be beat. A particular favorite of this author is Miro. It's hard to understate how far you can get with some simple primitives. If you are working with smaller groups or satellite teams - something like the Google Jamboard might be worth looking at. If you already think in terms of tables and spreadsheets, you might want to have a look at dbdiagram.io which boasts an expressive environment that bridges text driven and UI driven diagramming.
Picking the right tool
For whatever tool you choose, you should look to solve the following feature set.
- The ability to annotate the diagram.
Diagrams, absent of the original creator(s) can still be hard to understand. A tool that supports sticky notes, arrows, and another annotation primitives will help ask and answer questions about the chart. - The ability to fluidly change diagram type.
Not every diagram type is suited for every type of data model. Being able to change structure mid-flow is important. - Multi-user edit mode.
The ability for multiple people to edit a diagram at one time is such a big advantage in a tool. It's everything that makes office white-boarding great without the chemical-party room notes. - Export.
Be sure that you can export your chart in a variety of formats to support embedding in videos, presentations, documents, and more.
Parts of a Model
Loosely broken down, your model will be composed of entities that connect to each other. Depending on what the entity is and what the diagram is, we can describe these parts in different ways.
Entities
The term entity is relatively consistent throughout most diagrams. This can be a thing (something that is modelled in a table), a service, or a step in a process – not exhaustive. Depending on those purposes of an entities existence, the additional data we can ascribe to an entity will vary. When defining a data model around content types / tables, we can add attributes which often translate to column values in our db. If the entity is a service, we might add capabilities or functions as additional values. If we are modelling a class diagram, we might even mix the two. Conceptual models are often entity-name only without additional data added.
Connections
Connections, those lines between the entities, bring much more semantic value to the diagram. In a graph, these are the edges. These could be a state transition in a state diagram, a relationship in a standard data model, a function execution in a service digram or more. More often than not you'll see them referred to as relationships, where the relationship itself will be annotated to indicate additional value.
Understanding One-to-Many, Many-to-One, and Many-to-Many
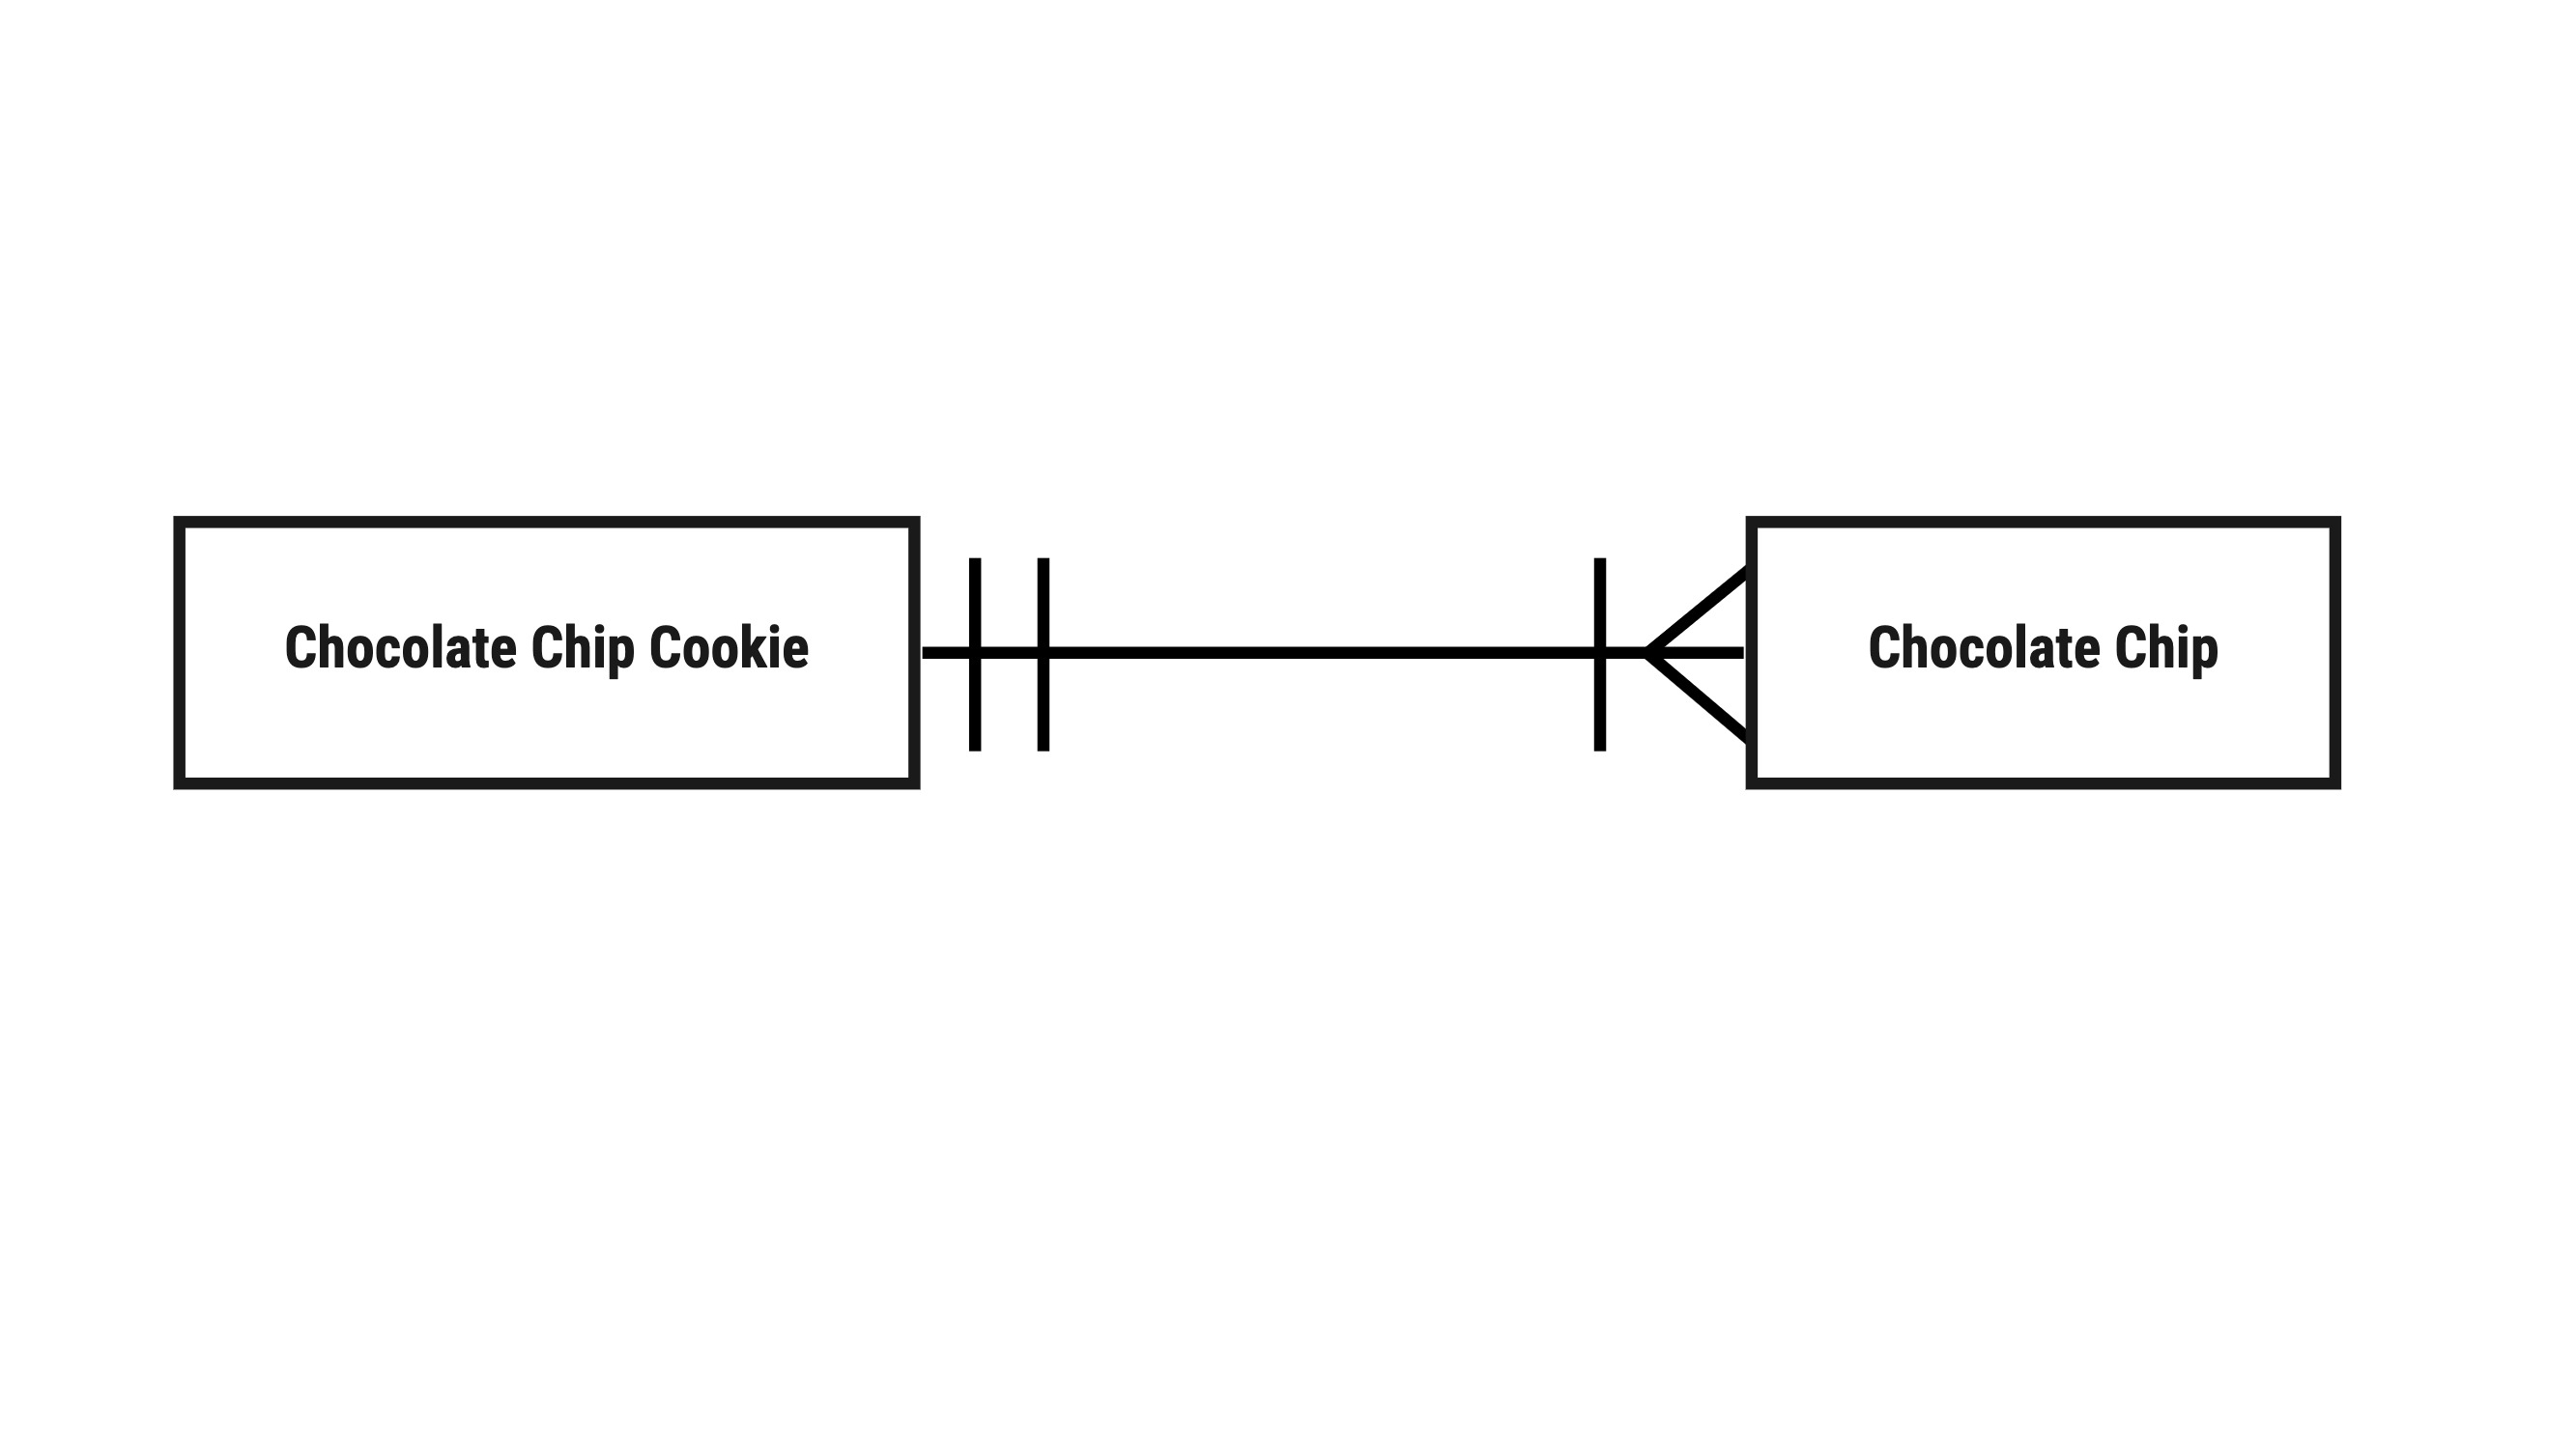
A common annotation to a relationship is to identify the cardinality. Cardinality refers to the plurality of one of the ends of the relation. A cookie can have zero or more chocolate chips. A chocolate chip can be in exactly one cookie. A chocolate chip cookie, by definition, must have one or more (not zero or more) - these are different forms of cardinality. We often express these relationships more simply as one-to-many, many-to-many, and many-to-one. Though, technically speaking, there are more "edge cases" possible by defining lower and upper bounds on quantity.
These variances in cardinality are significant enough to our architecture for a DBA to optimize our table structures that the industry has developed an entire series of grammars around annotating the edges. To illustrate, here's an example from a common data model diagramming notation called Information Engineering
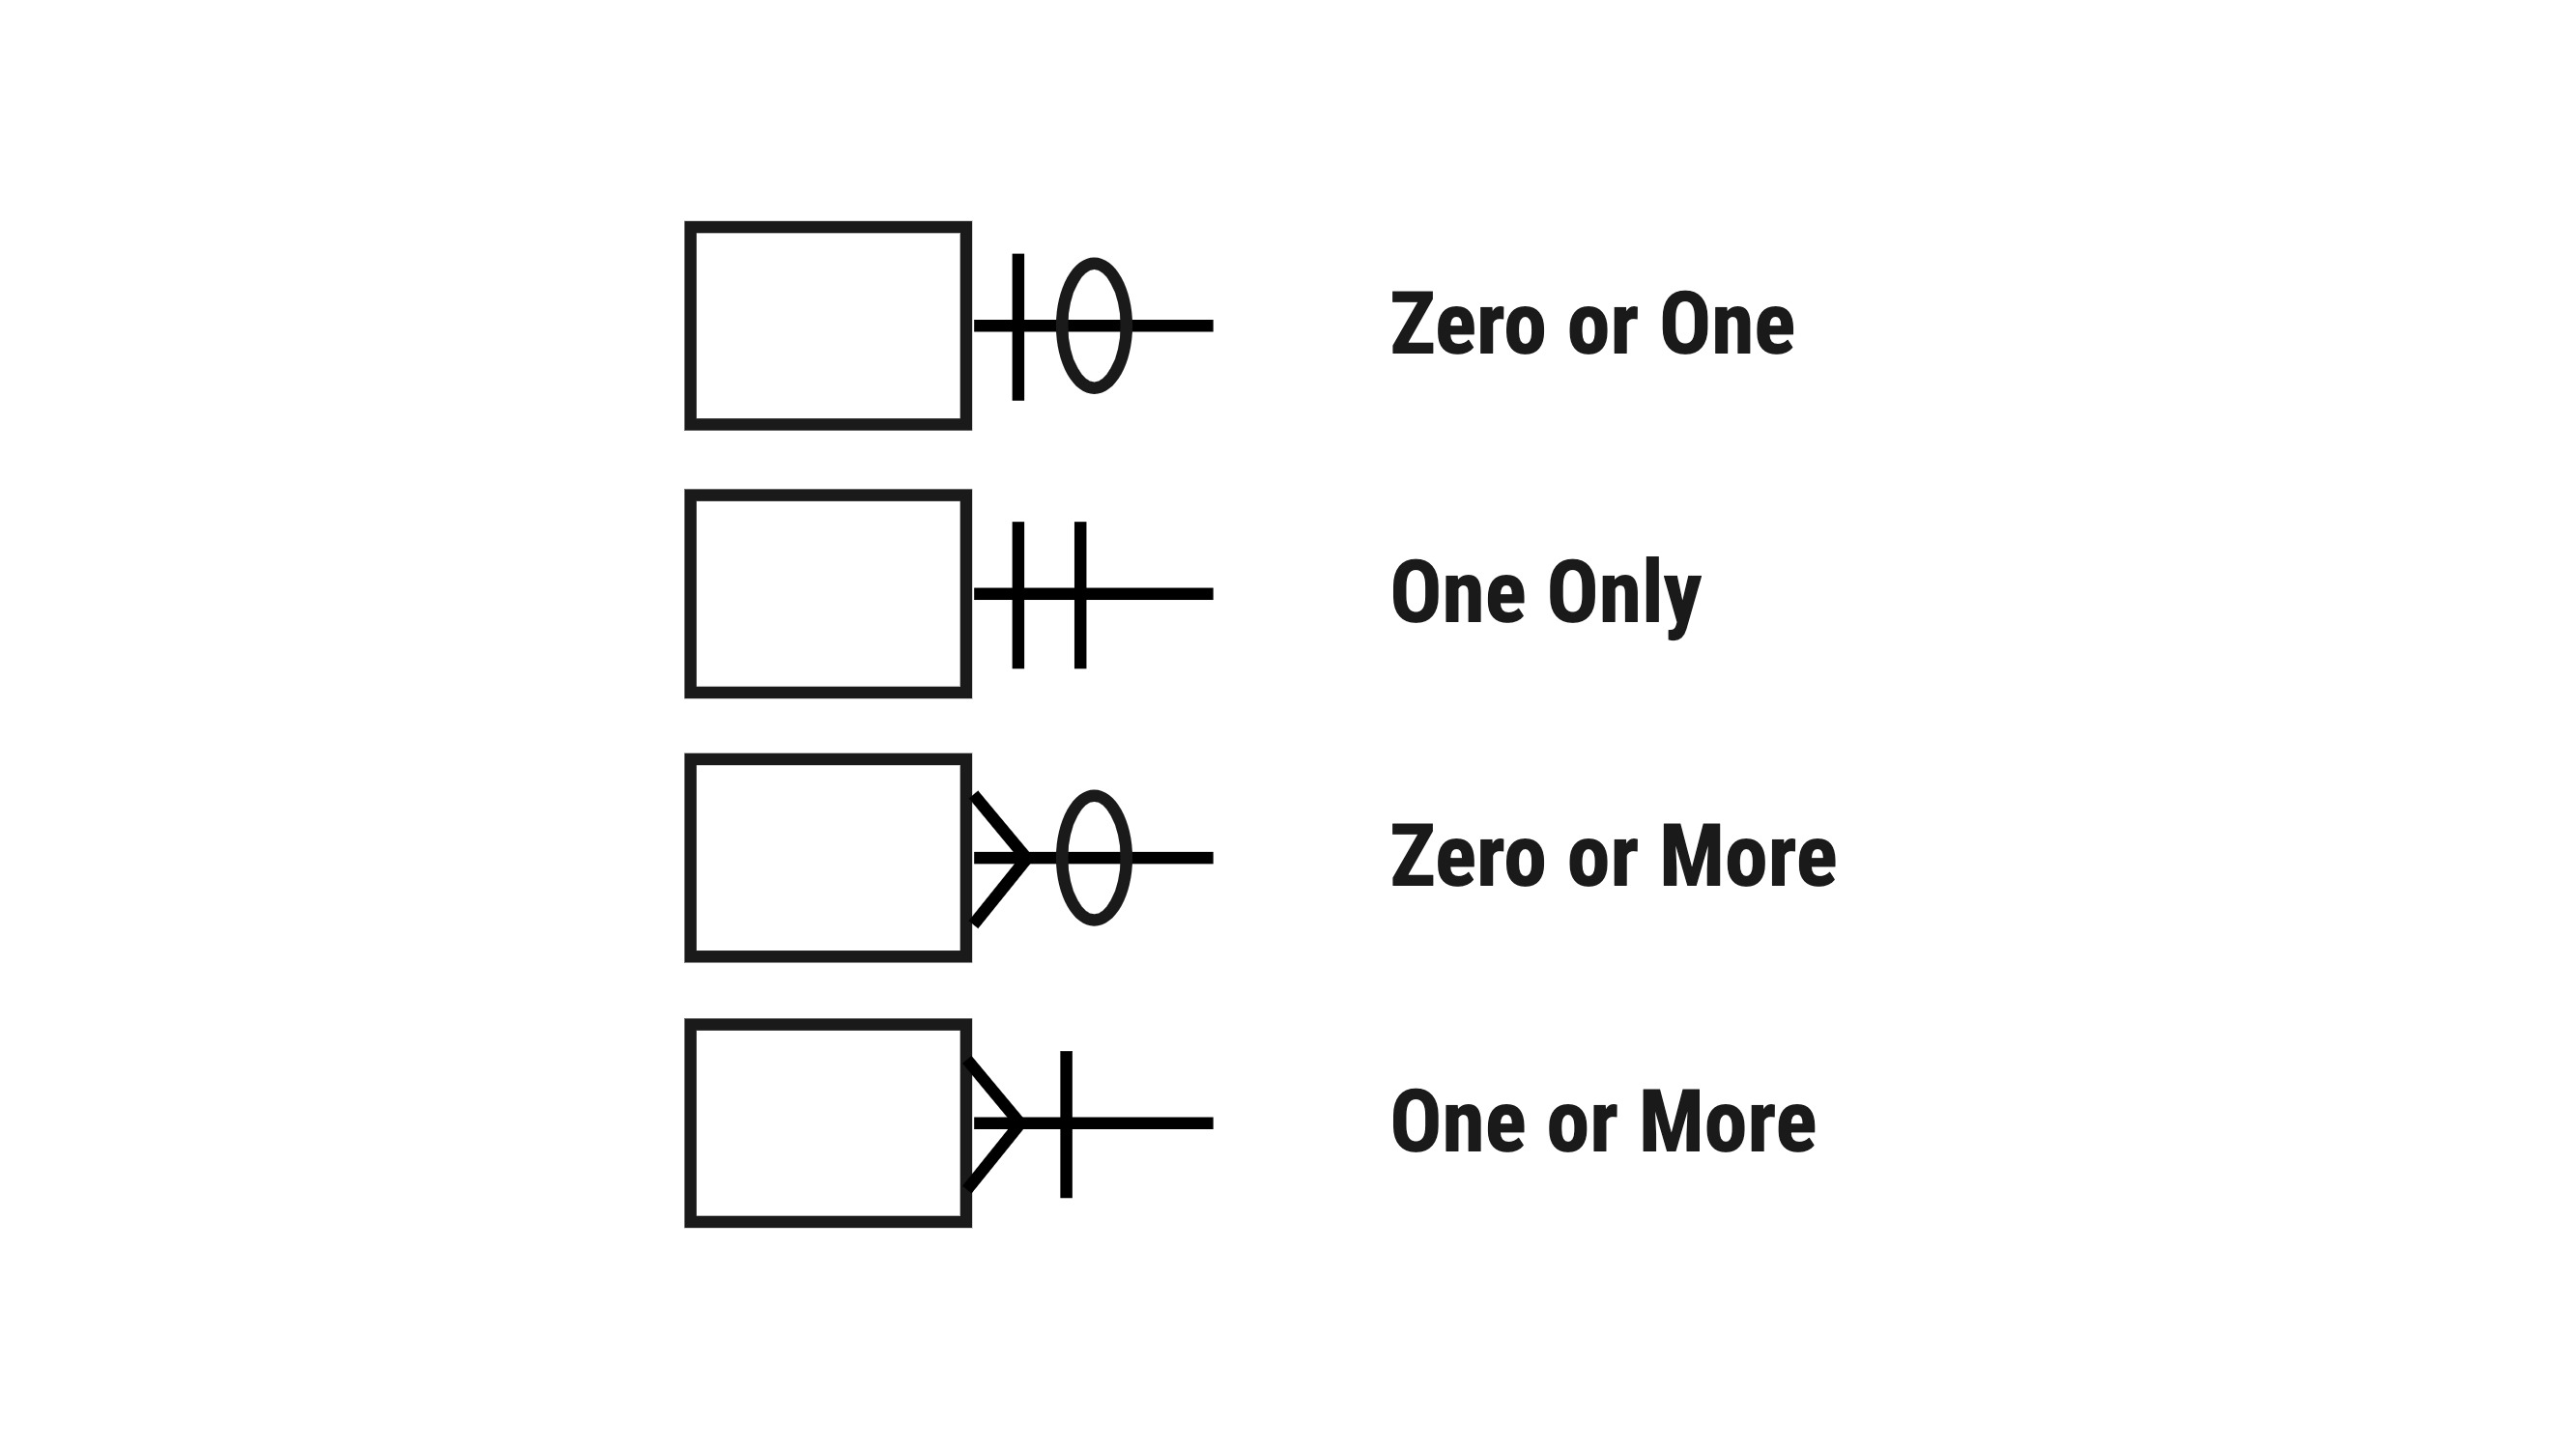
If we applied the above notation to our chocolate chip diagram, we'd end up with something indicating chocolate chip to cookie as one only and cookie to chocolate chip as one or more.
Picking a Model Grammar/Notation
The four most common notation types are Information Engineering (IE), Barker, IDEF1x, and the unified Modelling Language (UML). While breaking adding this level of detail to our models can feel like over-engineering a simple problem (and it may be!) the benefit is that we can communicate a commonly understood representation of the models without the need for sticky notes and marginalia to explain what our thick, thin, or colored lines are supposed to represent.
Barker is one of the most common ones, due in part to it's heavy adoption by the Oracle ecosystem, but in recent years, UML has been making a lot of headway thanks to its attempt to unify the other standards. UML has a particularly nice notational style for logical operators that keep the size of the model from exploding off the paper.
Optimize your Model
The process of breaking our content models apart into discrete entities (removing the amount of shared or repeating attributes) is called "normalizing" our data model. And it's an important part in understanding the moving pieces. That being said, and a point that is particularly true for GraphQL implementations, is that every level of normalization introduces a fixed cost for database efficiency. Every join between two or more tables takes additional computation time. And so the challenge for the DBA becomes determining if the attributes should be fit into one table (also known as a wide-table database like Google Big Query or Amazon RDS), or breaking out the tables into more entities for a more descriptive data-set and architecture.
In Practice - Start Simple, add Fidelity
In real-world application, the road to the eloquent data-model that considers all edges cases, provides a perfect hand off from architect to developer and leads to international awards and fame is a bit of a myth. The reality is always somewhere in the middle and compromises will need to be accounted for.
To accept this reality, it's important to remember that the model's goal is to provide a common understanding to all involved and to "fail fast" with our ideas and planning before going down a potentially costly, errant path. Starting with a conceptual model, slowly adding the parts of annotation that are needed to indicate attributes, functionalities, and cardinality until the whole team understands the moving parts will help strike the balance for just-enough detail for timely deliverables.