In the simplest terms, data visualization refers to how we represent our data with visuals like charts, graphs, and so on. It is the representation of data in graphical format, usually a mapping or a relationship between data points and lines of a chart or graph. Generally, it entails designing the right visual interface for our data.
The form of the visualization usually depends on the relationship between the chosen graphical elements or types and the data points involved. The end goal is to communicate information derived from data sources clearly and effectively via visual or graphical means.
Data viz, as it is sometimes called, is particularly useful to help us tell stories about our data and, in the process, understand the representation of a large set of data point at a glance. Essentially, representing data in an aesthetically pleasing and easily consumable way are the major goals of data viz.
When it comes to very large and complex datasets, the functionality of the data viz library at play is also important for effective insights. In this tutorial, we are going to be looking at some of JavaScript’s data visualization libraries and how they compare.
These days, almost every application we build requires or leverages data to enhance the functionality provided to users. There are a plethora of JavaScript libraries for data visualization available today. Therefore, finding the right one is very crucial in easing our development process.
In this post, we’ll explore some common data visualization libraries in JavaScript:
We’ll compare their pros and cons, key features and functionalities, philosophy, and so on. At the end of the day, the goal is to understand why we might pick one of these visualization libraries based on their available features and our particular use case.
Now let’s highlight these libraries in turn below:
Highcharts is a data visualization library solely based on native browser technologies, which means it doesn’t require client-side plugins like Flash. One of the main advantages of working with Highcharts is that it works well in all modern browsers, including mobile devices and Internet Explorer from version 6.
Highcharts runs on any server that supports HTML. We can even run Highcharts locally from a filesystem since all the rendering is done locally in a browser. Note that standard browsers use SVG for the graphics rendering.
Note: In terms of old browser (IE 6–8) support, some polyfills that contains common array functions are needed. Also, since older IE versions don’t support SVG rendering, VML renderer is also needed for Highcharts to work.
Highcharts is available as a package through both npm and Bower. To make use of Highcharts, we can include the JavaScript files in the <head> section of our webpage as shown below.
<script src="https://code.highcharts.com/highcharts.js"></script>
When it comes to basic customizations, we can apply a global theme. Themes are a set of options that are applied globally through the Highcharts.setOptions method. There’s also a top-level configuration option, responsive, that includes a variety of responsive chart types.
Highcarts also has some performance metrics built in. With ES modules, for example, we can create our own custom Highcharts package files. Custom files can optimize browser load speed, for example, due to smaller file sizes and fewer files to request. For more details about other performance optimizations, refer to the documentation.
Note: Highcharts can be used for a variety of multiple chart types, with advanced features including data sorting, boost rendering, and so on. It can also be used for stocks, maps, and Gantts.
Unlike many charting libs — including Chart.js, for example — Highcharts has a built-in accessibility module. To include the accessibility module, simply add the following file after including any of the Highcharts JS files:
<script src="https://code.highcharts.com/modules/accessibility.js"></script>
Other accessibility features include screen readers, internationalization, and so on. As an aside, Highcharts also comes with an export module, which allows users to download charts as PDF, PNG, JPG, or SVG. The export data module even allows exporting the chart data to CSV, XLS, or HTML table formats.
Since version 2, Highcharts has been built in a modular way, leaning on extensions for additional functionality. Extensions allow us to build or add more features within the capabilities of the library. More details can be found here.
Toast UI Chart is a beautiful statistical data visualization library. Like Highcharts, Toast UI Chart also offers great support for legacy browsers. As a result, it guarantees an identical look across all browsers. It also draws fast with great performance and requires no polyfills. When it comes to the rendering mechanism, it uses native browser formats, including SVG and RVML.
Toast UI Chart is intuitive and easy to use. It’s also worth noting that it integrates well with today’s two most popular open-source frontend libs/frameworks: React and Vue.js. So when it comes to a simple, minimal data viz library for JS, Toast UI Chart should come to mind.
Toast UI Chart provides various options to easily change the chart in detail as well as a wide range of custom theme options. Basically what we mean here is that it comes with a bunch of chart types that are easily customizable. For example, chart components like the title, axes, legends, tooltips, plots, series, and more can be fully customized through the options.
To use this library in our projects, we can employ a package manager like npm or download from the source directly. It can also be served via CDN. Although it is not as powerful as D3.js in terms of chart types or animation, it is equally easy to get started with. To use the available chart types, we can have a look at the boilerplate examples available in the GitHub repo.
It also comes with a clean, nice-to-use API. As an added advantage, it is also responsive, zoomable, and contains a live update feature that allows users to view and manage new data as they are added in real time with the addData API and the options.series.shift option.
Finally, it is open source and therefore free to use. All in all, Toast UI Chart provides many types of charts to visualize different kinds of data.
D3.js is a very flexible data viz library that follows a data-driven approach to DOM manipulation. It helps bring data to life using HTML, SVG, and CSS. It emphasizes web standards and has full support for all modern browsers.
D3 solves the crux of the problem, which allows an efficient manipulation of documents based on data. Performance-wise, it is extremely fast, which makes it easy to support large datasets and dynamic behaviors for interaction and animation.
The benefits of working with D3.js include the clean API reference, which contains various chart types. These basically consist of a collection of modules that are designed to work together. Note that we can use these modules independently or together as part of the default build. It also comes bundled with different community-supported plugins.
D3 also works well in areas of animations, data analysis, hierarchical data, and interaction — in fact, D3 is renowned for animation and interaction. For example, have a look at a simple example of an animated tree map.
Currently in v4, D3.js also comes bundled with plenty of community-developed resources, including tutorials, videos, classes, and books. The D3 team has also published hundreds of its own forkable examples and tutorials to boost learning and productivity. We can install it using either npm or Yarn.
Lastly, it’s worth nothing that D3 has more than 30 modules and 1,000 methods! This is where Observable comes in.
Offering the quickest way to start playing with D3, it allows us to edit cells and run them automatically for rapid feedback. We can also add interaction or animation with almost no code! In fact, Observable is the ideal environment for learning D3 because it simplifies code with data flow, like a spreadsheet.
Recharts is a redefined chart library built with React and D3. It is a composable charting library, which allows us to quickly build our charts with decoupled, reusable React components. One of its major strong points is that its components are built on top of SVG elements with a lightweight dependency on D3 submodules.
Recharts allows very powerful customization of charts by tweaking component props and passing in custom components. Generally speaking, we can easily integrate Recharts into our React applications. To get started with Recharts, we can either install from npm or build the code directly from source.
Recharts also offers a number ways for users to add powerful interactions to their chart components. For example, we can easily drop in a tooltip component with rich hovering functionality. It boasts a clean and simple-to-use API, with support for multiple chart types, components, and shapes. Examples can be found in the documentation.
Chart.js is quite easy to use and also very customizable. It’s also open source, with extensive documentation maintained by open-source developers and more than eight chart types, including built-in chart types.
Developer features allow extending, customizing, and enhancing Chart.js in many different ways. The configuration is used to change how the chart behaves. There are properties to control styling, fonts, the legend, etc. As a side note, we can perform both global and dataset configurations.
Note: The global general options are defined in
Chart.defaults.global. The defaults for each chart type are discussed in the documentation for that particular chart type.
Chart.js charts are rendered on canvas elements, which makes rendering quite fast. As such, it offers support for most modern browsers since the canvas element is supported in all modern and major mobile browsers. As a plus, it integrates well with popular JS libraries.
Here’s an example of how to render a chart via the canvas element:
<canvas id="myChart" width="400" height="400"></canvas>
Chart.js can be used with ES6 modules, plain JavaScript, and module loaders. For vanilla JavaScript, we can use regular script tags. We can also leverage different module loaders, including webpack, CommonJS, and so on. We can install the library via npm, Bower, CDN, or building from source.
The highlights of Chart.js include its responsiveness, which can be controlled via a few options the lib provides to control the resize behavior. This is usually achieved by detecting when the canvas display size changes and updating the render size accordingly — despite some known drawbacks related to canvas render size, which may lead to inaccurate rendering.
Chart.js also supports many chart extensions, plugins, and adapters. Plugins are the most efficient way to customize or change the default behavior of a chart. They were introduced at version 2.1.0 (global plugins only) and extended at version 2.5.0 (per chart plugins and options).
For large datasets or performance-sensitive applications, consider this tip: if your charts have long render times, it is a good idea to disable animations. Doing so means the chart needs to be rendered only once during an update instead of multiple times. This will have the effect of reducing CPU usage and improving general page performance.
When it comes to the available chart types, the major drawback for Chart.js is that it doesn’t currently support gauge charts or heat maps. And because charts are rendered on user-provided canvas elements, this forces the user to make a decision on how to create the canvas element in an accessible way.
These days, almost every application we build requires or leverages data to enhance functionality or user experience. These visualizations could be a metric to show a growing customer base or a graph that displays business expenses for various categories.
While there are quite a few data visualization JavaScript library available today, finding the right one is very crucial to our development process and use case. We need to be sure the solution is easily customizable and perfect for what we need to build. This brings us to the factors to consider when choosing from these various lib:
As a final note, if a data visualization library has all the aforementioned characteristics, it can generally be considered good on a use-case-by-use-case basis.
In this post, we have looked at the top data visualization libraries in JavaScript by feature and performance. These can all help us get started quickly to add beautiful and performant data visualizations to our application.
All of the libraries we have explored here are great, and the differences between them are not so huge — all have a good variety of supported features, a solid API interface, and good community support.
There’s no doubt that frontends are getting more complex. As you add new JavaScript libraries and other dependencies to your app, you’ll need more visibility to ensure your users don’t run into unknown issues.
LogRocket is a frontend application monitoring solution that lets you replay JavaScript errors as if they happened in your own browser so you can react to bugs more effectively.
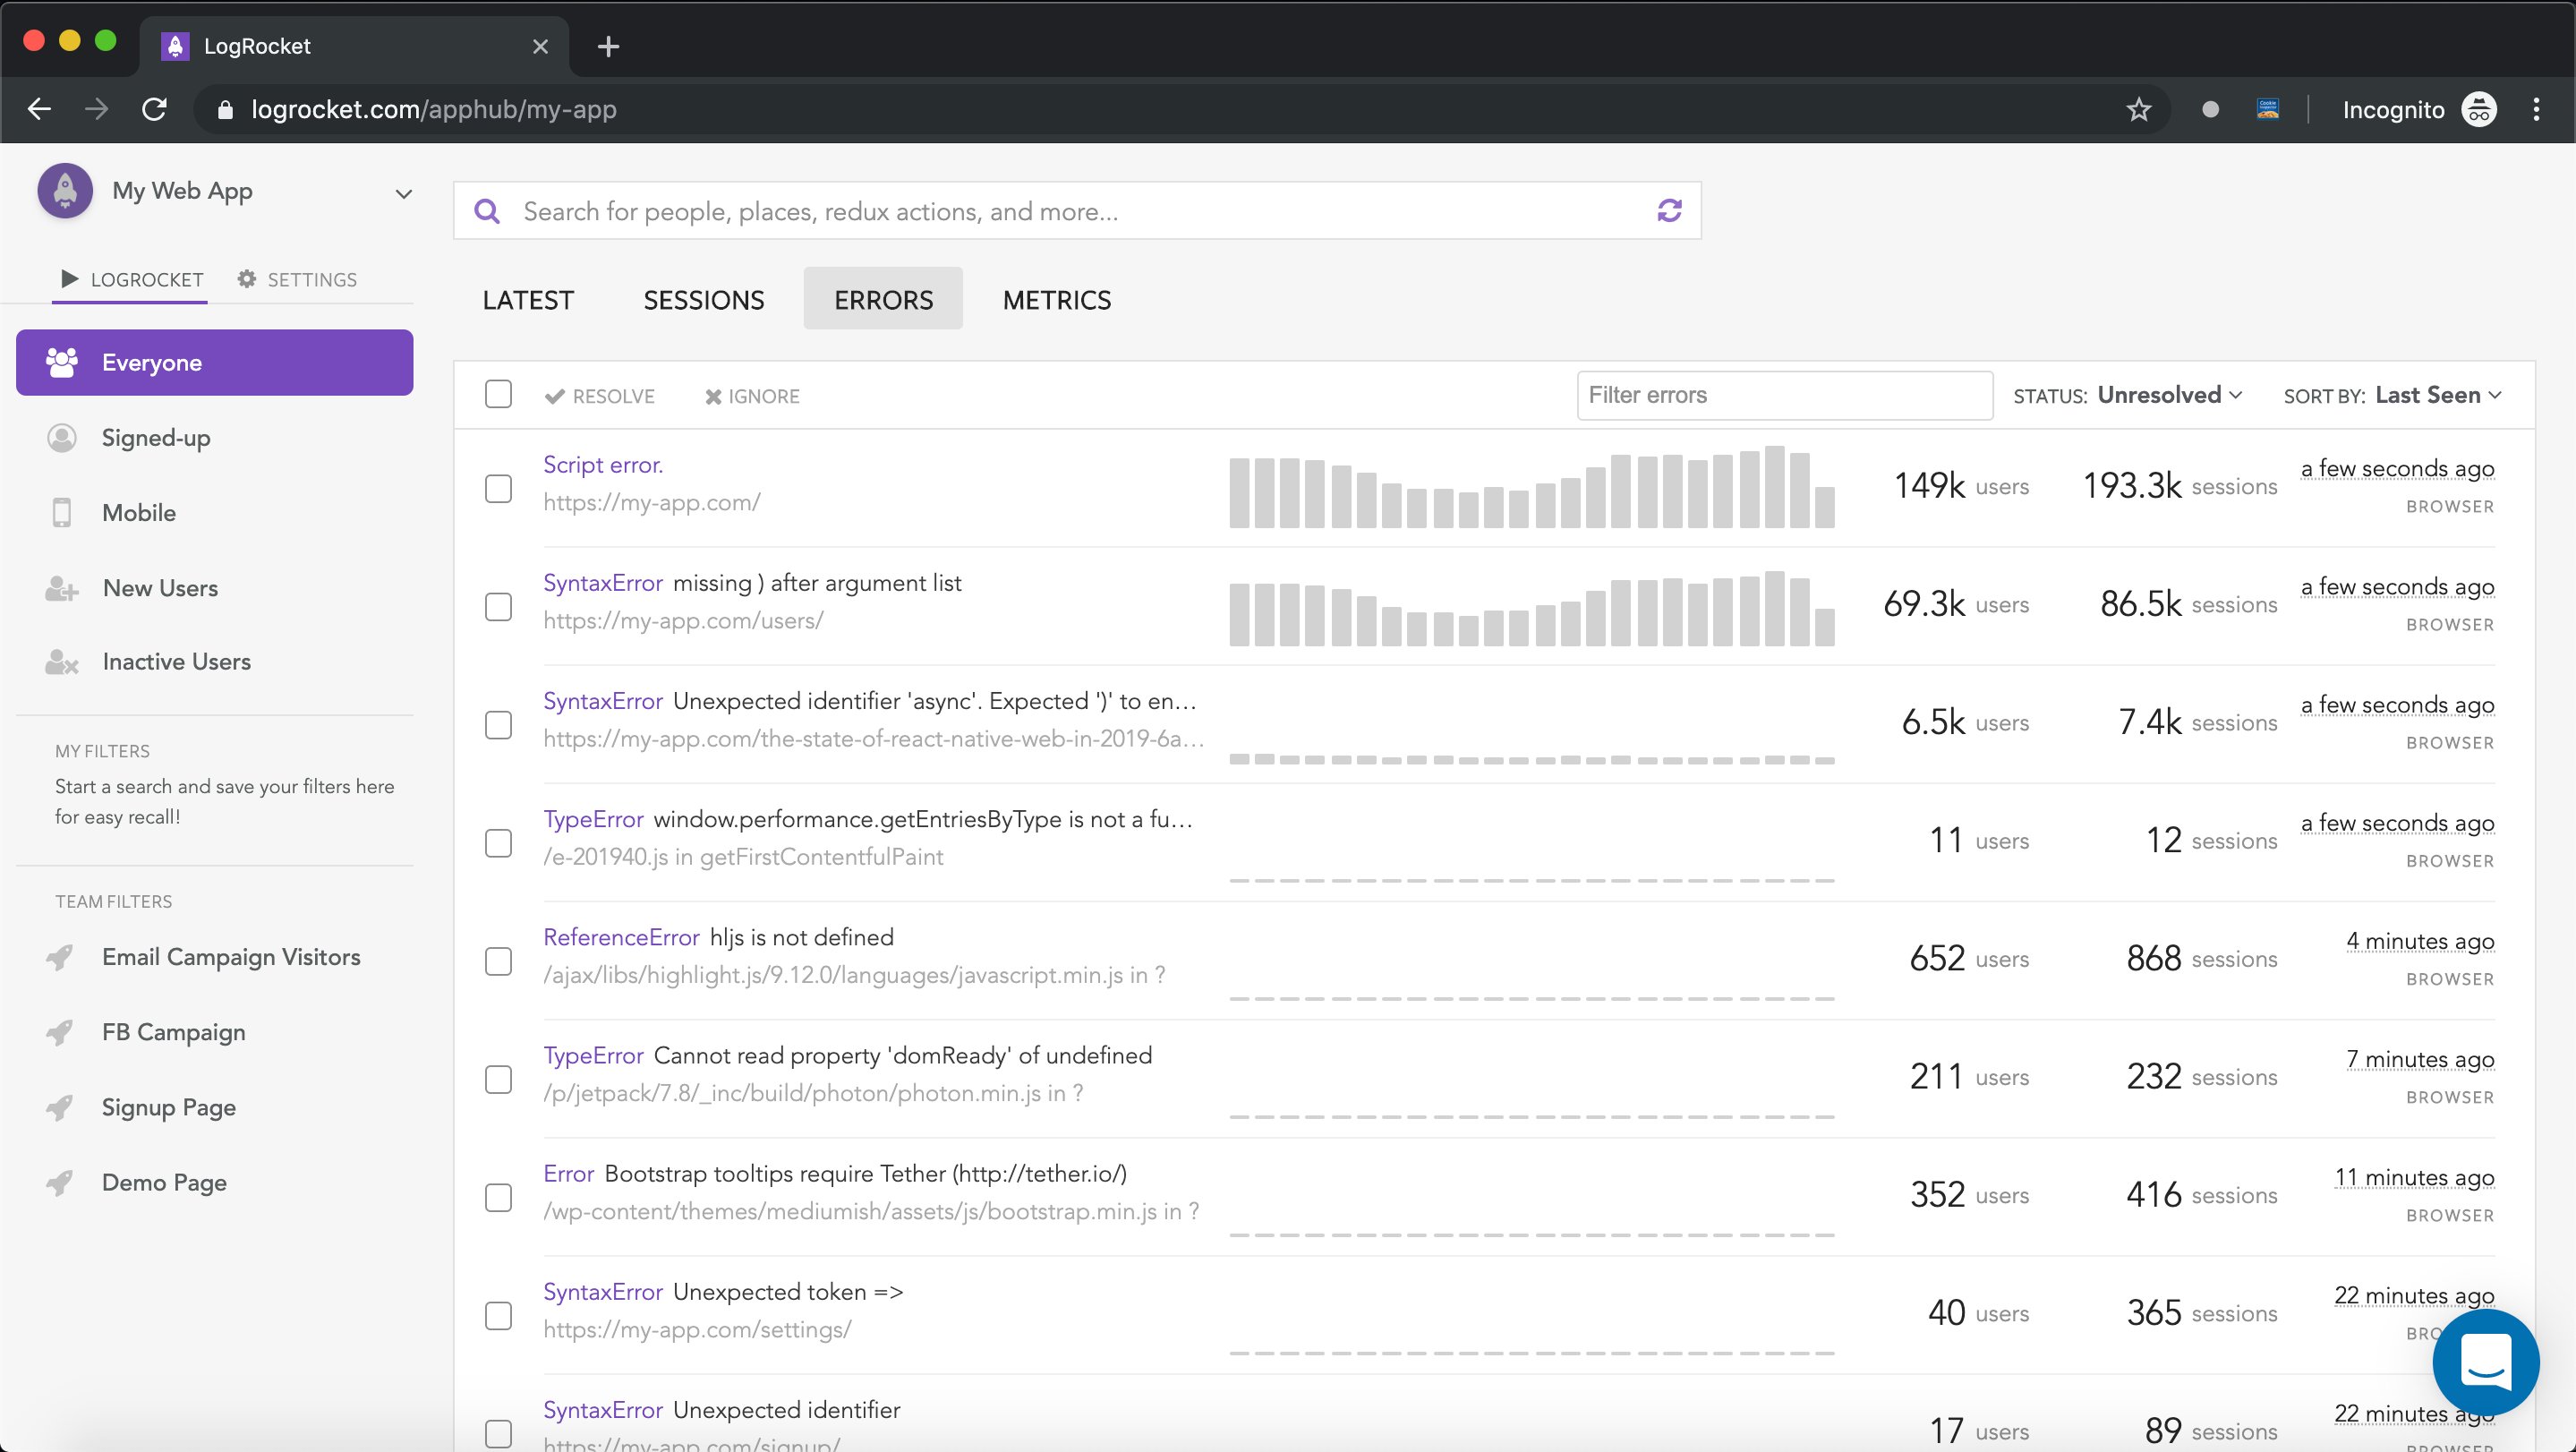
LogRocket works perfectly with any app, regardless of framework, and has plugins to log additional context from Redux, Vuex, and @ngrx/store. Instead of guessing why problems happen, you can aggregate and report on what state your application was in when an issue occurred. LogRocket also monitors your app’s performance, reporting metrics like client CPU load, client memory usage, and more.
Build confidently — start monitoring for free.

With ResizeObserver, you can build aesthetic React apps with responsive components that look and behave as you intend on any device.
Explore React Tabulator to create interactive JavaScript tables, easily integrating pagination, search functionality, and bulk data submission.
This tutorial will explore the application of heatmaps in JavaScript projects, focusing on how to use the Heat.js library to generate them.
Eleventy (11ty) is a compelling solution for developers seeking a straightforward, performance-oriented approach to static site generation.


3 Replies to "The top JavaScript data visualization libraries for 2021"
What do you think of Plotly?
My all time favourite one & only D3.js.
Hey I think you should also add LightningChartJS to that list.
It comes with loads of features, with fast rendering utilising effective algorithms and GPU acceleration using WebGL. So, one can plot millions of data points – even 100 million data points in real-time, and not have performance issues.
Check this out as they have simple and flexible API’s with a bunch of chart types that offer a lot of customisation, you can create innumerable types of charts to visualise different kinds of data as per your requirements with good visualisations as well!