
 More and more companies are adopting Kubernetes, but after some time they see an unexpected growth around cloud costs. Engineering teams did their part in setting up auto-scalers, but the cloud bill is still growing. Today we are going to see how Percona Monitoring and Management (PMM) can help with monitoring Kubernetes and reducing the costs of the infrastructure.
Get the Metrics
Overview
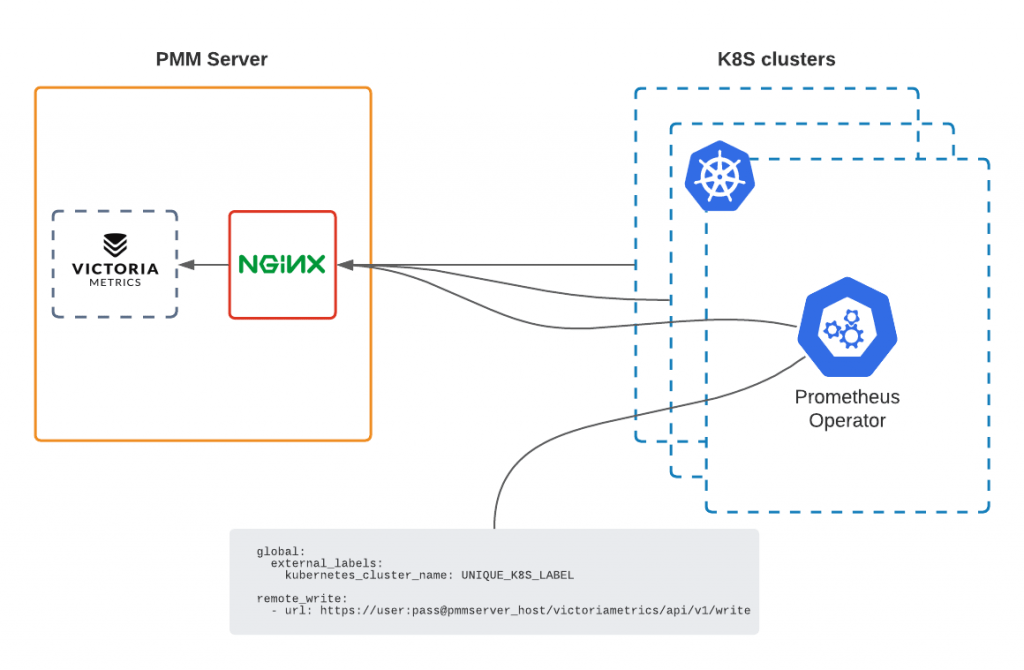
Prometheus Operator is a great tool to monitor Kubernetes as it deploys a full monitoring stack (prometheus, grafana, alertmanager, node exporters) and works out of the box. But if you have multiple k8s clusters, then it would be great to have a single pane of glass from which to monitor them all.
To get there I will have Prometheus Operator running on each cluster and pushing metrics to my PMM server. Metrics will be stored in VictoriaMetrics time-series DB, which PMM uses by default since the December 2020 release of version 2.12.
PMM-server
I followed this manual to the letter to install my PMM server with docker. Don’t forget to open the HTTPS port on your firewall, so that you can reach the UI from your browser, and so that the k8s clusters can push their metrics to VictoriaMetrics through NGINX.
Prometheus Operator
On each Kubernetes cluster, I will now install Prometheus Operator to scrape the metrics and send them to PMM. Bear in mind that Helm charts are stored in prometheus-community repo.
Add helm repository
1 | helm repo add prometheus-community https://prometheus-community.github.io/helm-charts |
Prepare the configuration before installing the operator
1 2 3 4 5 6 7 8 9 10 11 12 13 14 15 16 17 18 19 20 | $ cat values.yaml serviceAccounts: alertmanager: create: false alertmanager: enabled: false configmapReload: alertmanager: enabled: false extraScrapeConfigs: | remote_write: - url: https://{PMM_USER}:{PMM_PASS}@{YOUR_PMM_HOST}/victoriametrics/api/v1/write server: global: external_labels: kubernetes_cluster_name: {UNIQUE_K8S_LABEL} |
- Disable alertmanager, as I will rely on PMM
- Add remote_write section to write metrics to PMM’s VictoriaMetrics storage
- Use your PMM user and password to authenticate. The default username and password are admin/admin. It is highly recommended to change defaults, see how here.
- /victoriametrics endpoint is exposed through NGINX on PMM server
- If you use https and a self-signed certificate you may need to disable TLS verification:
1 2 | tls_config: insecure_skip_verify: true |
- external_labels section is important – it labels all the metrics sent from Prometheus. Each cluster must have a unique kubernetes_cluster_name label to distinguish metrics once they are merged in VictoriaMetrics.
Create namespace and deploy
1 2 | kubectl create namespace prometheus helm install prometheus prometheus-community/prometheus -f values.yaml --namespace=prometheus |
Check
- PMM Server is up – check
- Prometheus Operators run on Kubernetes Clusters – check
Now let’s check if metrics are getting to PMM:
- Go to PMM Server UI
- On the left pick Explore
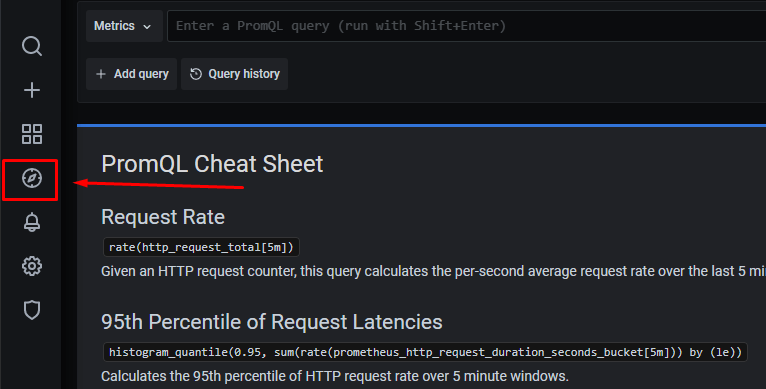
- Run the query kube_node_info{kubernetes_cluster_name="UNIQUE_K8S_LABEL"}
It should return the information about the Nodes running on the cluster with UNIQUE_K8S_LABEL. If it does – all good, metrics are there.
Monitor the Costs
The main reasons for the growth of the cloud bill are computing and storage. Kubernetes can scale up adding more and more nodes, skyrocketing compute costs.
We are going to add two dashboards to the PMM Server which would equip us with a detailed understanding of how resources are used and what should be tuned to reduce the number of nodes in the cluster or change instance types accordingly:
Import these dashboards in PMM:
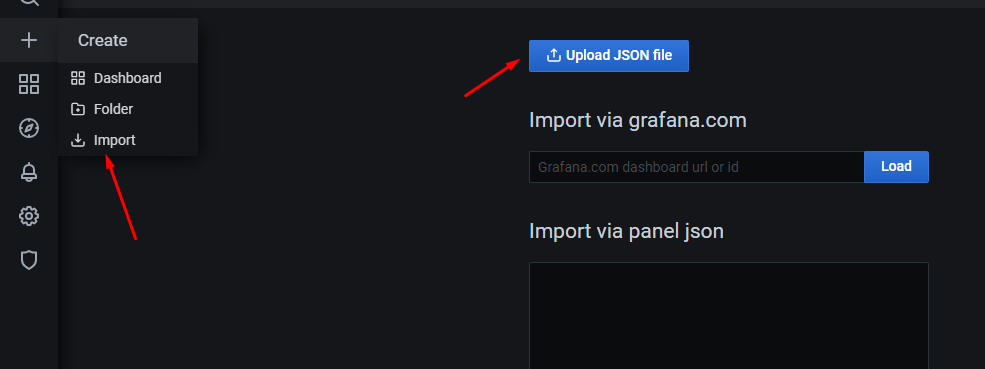
Dashboard #1 – Cluster Overview
The goal of this dashboard is to provide a quick overview of the cluster and its workloads.

The cluster on the screenshot has some room for improvement in utilization. It has a capacity of 1.6 thousand CPU cores but utilizes only 146 cores (~9%). Memory utilization is better – ~62%, but can be improved as well.
Quick take:
- It is possible to reduce # of nodes and get utilization to at least 80%
- Looks like workloads in this cluster are mostly memory bound, so it would be wiser to run nodes with more memory and less CPU.
Graphs in the CPU/Mem Request/Limit/Capacity section gives a detailed view of resource usage over time:

Another two interesting graphs would show us the top 20 namespaces that are wasting resources. It is calculated as the difference between requests and real utilization for CPU and Memory. The values on this graph can be negative if requests for the containers are not set.
This dashboard also has a graph showing persistent volume claims and their states. It can potentially help to reduce the number of volumes spun up on the cloud.
Dashboard #2 – Namespace and Pod
Now that we have an overview, it is time to dive deeper into the details. At the top, this dashboard allows the user to choose the Cluster, the Namespace, and the Pod.
At first, the user sees Namespace details: Quotas (might be empty if Resource Quotas are not set for the namespace), requests, limits, and real usage for CPU, Memory, Pods, and Persistent Volume Claims.

The Namespace on the screenshot utilizes almost zero CPU cores but requests 20+ cores. If requests are tuned properly, then the capacity required to run the workloads would drop and the number of nodes can be reduced.
The next valuable insight that the user can pick from this dashboard is real Pod utilization – CPU, Memory, Network, and disks (only local storage).

In the case above you can see CPU and Memory container-level utilization for Prometheus Pod, which is shipping the metrics on one of my Kubernetes clusters.
Summary
This blog post equips you with the design to collect multiple Kubernetes clusters metrics in a single time-series database and expose them on the Percona Monitoring and Management UI through dashboards to analyze and gain insights. These insights help you drive your infrastructure costs down and highlight issues on the clusters.
Also, look to PMM on Kubernetes for monitoring of your databases – see our demo here and contact Percona if you are interested in learning more about how to become a Percona Customer, we are here to help!
The call for papers for Percona Live is open. We’d love to receive submissions on topics related to open-source databases such as MySQL, MongoDB, MariaDB, and PostgreSQL. To find out more visit percona.com/live.


