

 I have a local Percona Monitoring and Management (PMM) instance at home, which I use to look after my local databases. With the release of PMM 2.14 and its support for monitoring of external “serverless” stuff, I decided to check if I can get some insights into my local networking.
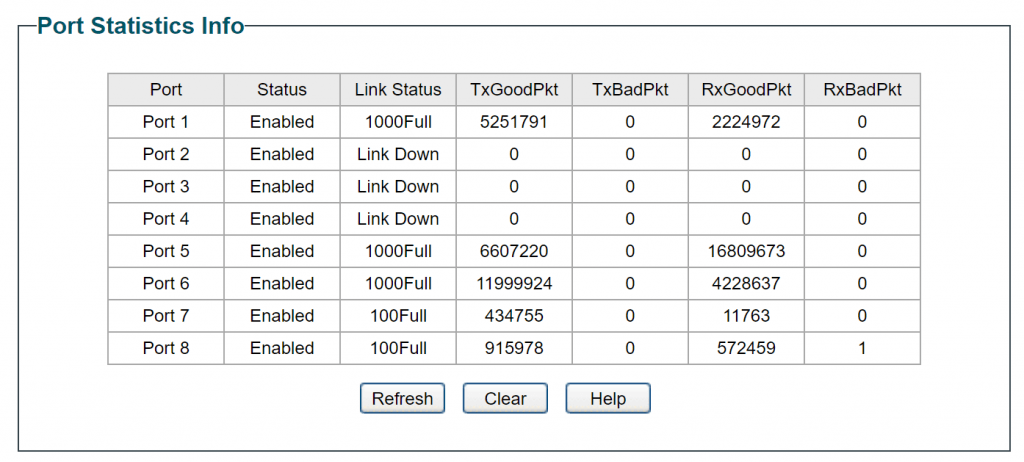
I have a TP-Link TL-SG108PE switch which has some basic management functions, and it provides basic port statistics:
The first thing to do is to see if an Exporter is already available. The wonderful thing about the Prometheus ecosystem is that these days you can find exporters for almost everything! Googling for “tp-link switch-exporter” pointed me to this github project.
Two minutes later, we have an exporter running:
1 | docker run -d -p 9717:9717 thelastguardian/tplinkexporter --host 10.11.13.190 --username admin --password XXXX |
(I modified the command line from the docs slightly to daemonize the docker container instead of running it interactively.)
We can now go to http://10.11.13.140:9717/metrics to see if metrics are collected.
1 2 3 4 5 6 7 8 | tplinkexporter_portstats_rxgoodpkt{host="10.11.13.190",portnum="1"} 2.225887e+06 tplinkexporter_portstats_rxgoodpkt{host="10.11.13.190",portnum="2"} 0 tplinkexporter_portstats_rxgoodpkt{host="10.11.13.190",portnum="3"} 0 tplinkexporter_portstats_rxgoodpkt{host="10.11.13.190",portnum="4"} 0 tplinkexporter_portstats_rxgoodpkt{host="10.11.13.190",portnum="5"} 1.6824272e+07 tplinkexporter_portstats_rxgoodpkt{host="10.11.13.190",portnum="6"} 4.244105e+06 tplinkexporter_portstats_rxgoodpkt{host="10.11.13.190",portnum="7"} 11821 tplinkexporter_portstats_rxgoodpkt{host="10.11.13.190",portnum="8"} 575131 |
Note that the host where the exporter is running is different from the host (switch) being monitored.
The next step is to connect this exporter to Percona Monitoring and Management. We do it by running the following command:
1 2 3 4 5 | root@rocky:~# pmm-admin add external-serverless --host=tplink --address=10.11.13.140:9717 External Service added. Service ID : /service_id/1c55f4c3-bcf7-4aef-955a-4b171c9cb632 Service name: 10.11.13.140-external Group : external |
Note that this command does NOT need to be run on the same host that runs the exporter, and in my case, it did not. In the future, I hope we can add functionality so PMM Server can be used to configure external exporters, and the need to involve such intermediary hosts is avoided altogether.
Now let’s check if the data is being received by PMM. To do that we can use Explore mode and enter one of the metrics which is unique for this exporter:

All right, we have some data coming in.
Finally, let’s see if we can get this data visualized on the dashboard. The exporter´s Github project provides a link to a Grafana dashboard. Some imported dashboards would work directly, while others, at least, can serve as a baseline to be customized.
To add a dashboard to PMM we will use the Dashboard Import functionality and just enter the ID of the dashboard you’re looking to import.

Here we go – this dashboard works beautifully without any need for customization.

Summing Things Up
You can monitor almost anything with Percona Monitoring and Management. To add some entity monitoring to PMM, you would usually:
- Find an exporter for the thing you’re trying to monitor, or create one if it does not exist.
- Register the exporter with PMM.
- Find and import a dashboard from Grafana Dashboards or create one if there isn’t one that matches your needs.
Percona Monitoring and Management is free to download and use. Try it today!


