Getting Started with the Desktop Designers in .NET

In the final post of this series, we detail the Telerik Reporting .NET Report Designers for the Desktop. Check out the first and second posts.
Series Outline
Telerik Reporting is a powerful reporting engine built on .NET with lots of great benefits. One of these benefits is the Report Designers. From developers to report designers and stakeholders, Telerik Reporting is the tooling of choice for creating and designing beautiful reports. As a result, I have created this series to illustrate this.
This series covers a little of the past, a little of the present, and, most importantly, future opportunities. The later posts are more technical and are likely to contain some overlap. To skip ahead, use the links below or read along at your leisure.
-
Web and Desktop Report Designers for Everyone – Telerik Reporting
-
Getting Started with the Desktop Designers in .NET (This Post)
Introduction
As stated in part two of this post, well designed reports are just like any other piece of media. There is an art to creating them and reading them. Reports are meant to answer questions, communicate objectives, and evoke good or bad feelings.
This supports the concept of designing reports as an integral step in delivering reports to stakeholders. One could argue that the designer capabilities are the most important aspects of a reporting framework. This idea holds true for Telerik Reporting as well.
Report designers expect a reporting framework to be easy-to-use and understand. They expect that it is powerful enough to present their ideas as intended. From data inputs to end-user activity, a reporting solution needs to be capable of working within the design intent.
Although, to properly design a report in Telerik Reporting an understanding of the Report Lifecycle is critical. This understanding will empower the designer by providing a framework to work within. Let me briefly review the Report Lifecycle.
Understanding the Report Lifecycle
The Report Lifecycle in Telerik Reporting is composed of three steps. These are define the report, process the report and then render the report. The steps are sequential and build each other one after the other. To make changes in any step requires starting the lifecycle again. Let me provide an overview of the steps below.
- Defining the Report is the declarative definitions that are created with one of Telerik Reporting's designer tools.
- Processing the Report Definition performs grouping, sorting and filtering calculations. It evaluates the expressions, binds the data sources and triggers binding events.
- Rendering the Processed Report takes the processed report and passes it to one of the many available rendering extensions.
Designing a report is the first step in the process. Each of the Telerik Report Designers fits into the First Stage of the Lifecycle. Having an understanding of the Lifecycle provides a solid foundation for designing Reports in Telerik Reporting.
Designing Reports
The Desktop Designers have enabled developers to productively deliver reports using either our proprietary Standalone Designer or Visual Studio, with the Standalone Designer being the recommended tool. However, whichever designer tool is used, our Desktop Designers are stable, battle tested and well documented.
To illustrate this, we will review the provided demos in both the Standalone designer and the Visual Studio designer. In reviewing the demos, it will detail elements of designing reports in the Desktop Designers, like how to work within the designers, configuring them and integrating across designers.
Methodologies Used
The conceptual elements of Telerik Report Designers tools enable simple and visual design. To achieve this report designers can use the drag-and-drop, contextual feedback, wizards, and What-You-See-Is-What-You-Get concepts.
Drag and Drop is a common concept in design that is used in many designer tools. It enables the designer to select the tool or design element, drag it onto the design surface and edit the tool. This is ubiquitous with other concepts like snap to grid as well.
For contextual feedback, the UI will update upon selection of a specific element in the designer. For example, a TextBox has different properties than a DataSource and the properties window will update to accommodate these differences.
To ease the creation of complex reports, the designer tools include wizards. The most complex report items like the Graph, the various Data Sources, and Tables/Crosstabs can be created much more simply using the wizards. Wizards are commonly used for complex tasks.
The above concepts complement the designer's workflow by displaying the component exactly how it will look like in the report. This is known as What-You-See-Is-What-You-Get. In Telerik Reporting, it provides a live preview of image-based items like the Graph, Map, Barcode and PictureBox. It is very common with complex designers.
Desktop Designer UI Elements
The Desktop Designers share similar UI elements. These are slightly different because they interact with different file types. For example, the Standalone Report Designer uses a proprietary XML definition, and the Visual Studio Designer uses C# or VB.NET classes.
During this section we will review the designer elements across each designer. It makes sense to separate them into different sections. The sections that overlap include the Design Surface, the available components, and the Report, Data, Group, Properties explorers.
The Standalone Report Designer UI Elements
The Standalone Report Designer is a separate application that uses the Reporting Engine to package an XML definition. It is a simple .EXE file that runs in Windows like other desktop applications. Let us start with reviewing how to create reports.
Creating Reports in the Standalone Report Designer
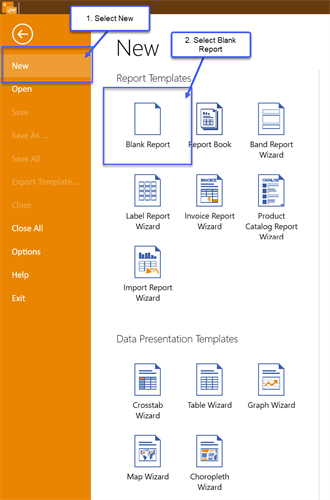
Creating new reports is like any other Windows application. Run the Standalone Report Designer from the Start Menu and select new like the following screenshot.
Standalone Designer Design Surface UI
After selecting a new or existing report, this will open the report into the design surface. Below is a screenshot after opening the sample Dashboard.trdp file.
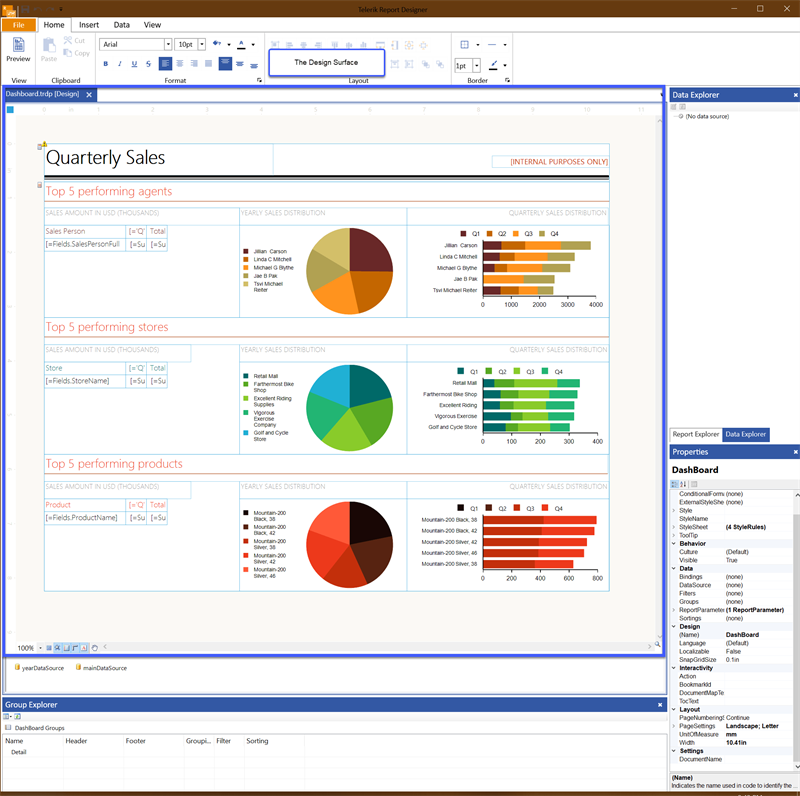
Fig. 3 - The Standalone Designer Design Surface UI
Standalone Designer Component Menus
The toolbar contains a tab menu in the application ribbon, and the tabs are contextual by component or view. They are the Home, Insert, Data and View tabs along with a contextual Tools tab. Let us review them next.
The Home Tab includes the view mode, clipboard, format, layout, and border controls as indicated in the following screenshot.

Fig. 4 - The Standalone Designer Home Tab
The Insert Tab is where components can be inserted into the report. The tab is broken up into the following groups and accompanying screenshot.
- Tables
- Charts
- Maps
- Report
- Report Items
 Fig. 5 - The Standalone Designer Insert Tab
The Data Tab allows the designer to insert a data component. The available data components are shown in the following screenshot.

Fig. 6 - The Standalone Designer Data Tab
The View Tab enables the designer to toggle view panes within the application. The following screenshot display each as toggled on.
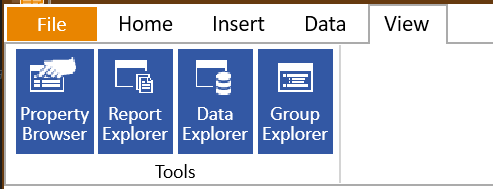
Fig. 7 - The Standalone Designer View Tab
The Tools Tab appears based on the current selection and provides the most used tools for the selected report item. It can be seen on the screenshot below when the Graph is selected and a green-ish new tab titled “Graph tools” appears at the end of the tab menu.
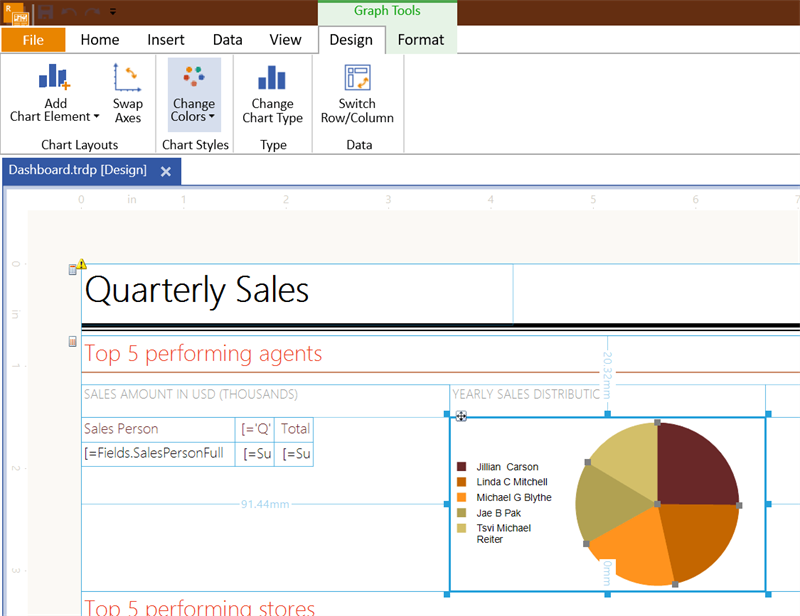
Fig. 8 - The Standalone Designer Contextual Tools Tab
The primary process for adding components in the Standalone Report Designer is to use each tab described above, select an item, and place it directly in the Design Surface. Then the designer can drag and drop the component as well as use the Report Explorer to edit its properties.
Standalone Designer Report Explorer UI
The Report Explorer provides a hierarchical view of every component in the Report. Note the tree-view in the following screenshot.
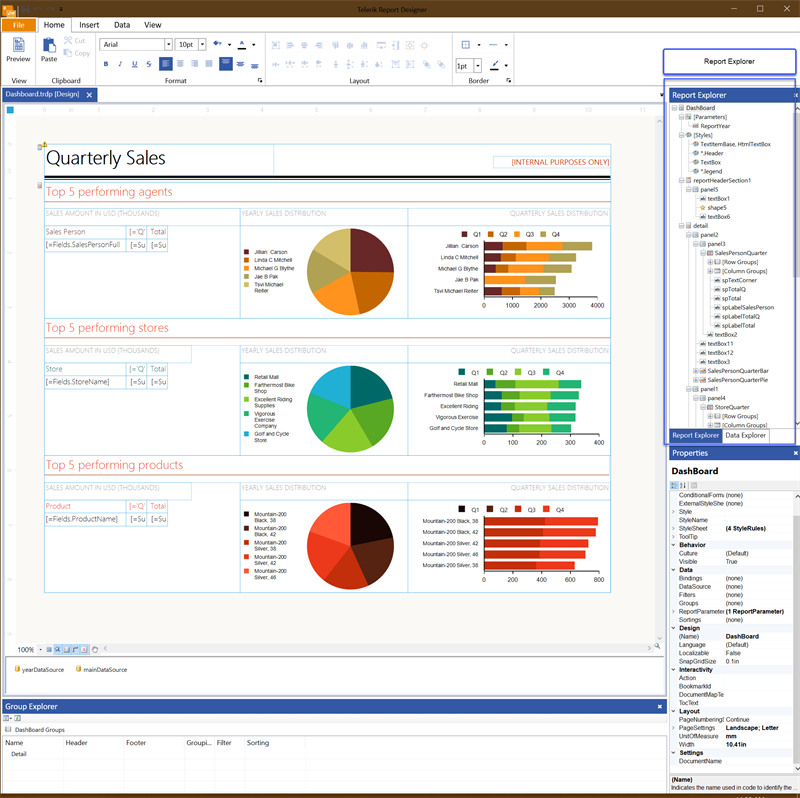
Fig. 9 - The Standalone Designer Report Explorer UI
The Report Explorer is an excellent tool for selecting components in large complex reports. Additionally, the UI contextually updates. For example, upon selecting an item in the Design Surface the item will highlight in the Report Explorer and the Properties Explorer will update accordingly.
Standalone Designer Properties Explorer UI
The Properties Explorer is the most contextual element of the designer. As previously articulated and indicated in the next figure, when items are selected through the Design Surface or through the Report Explorer the Properties Explorer will also adapt. However, this is also used to create Expression Bindings, Filters and/or Style Rules, among others, if the component supports it. Also, upon selection the components that provide live preview will also update their design-time representation when their properties are changed through the Properties Grid.
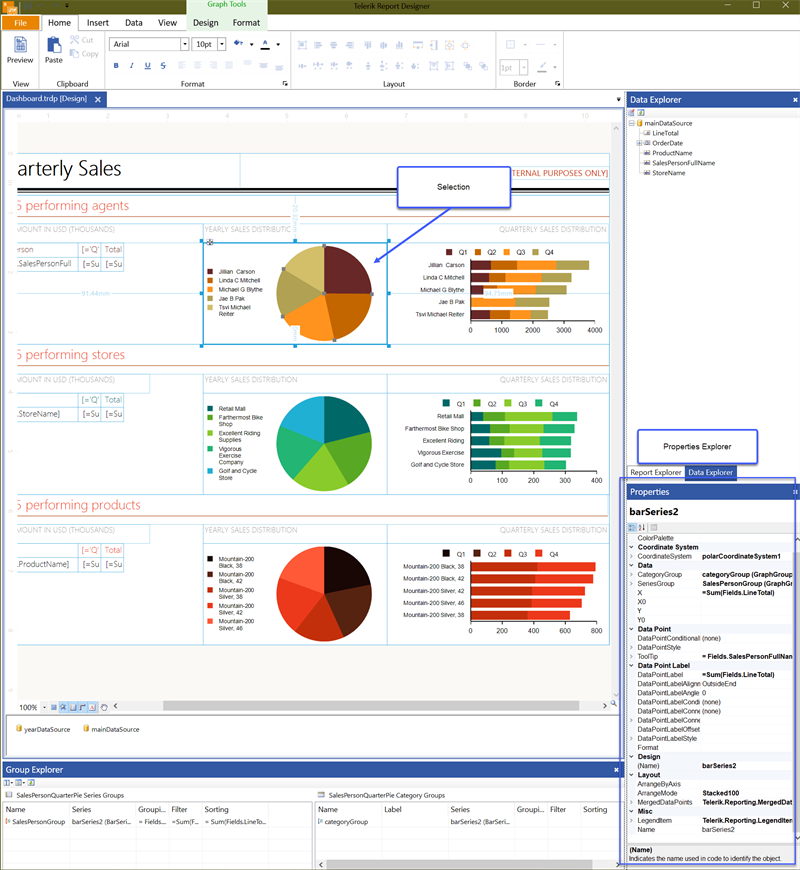
Fig. 10 - The Standalone Designer Properties Explorer UI
Standalone Designer Data Explorer UI
The Data Explorer describes the selected data source. Rather, the data source that is available for the component. This means the Report Data Source or the selected Data Source. To add a data field to a report data item, the field can be selected from the data explorer, dragged, and then dropped on the report item.
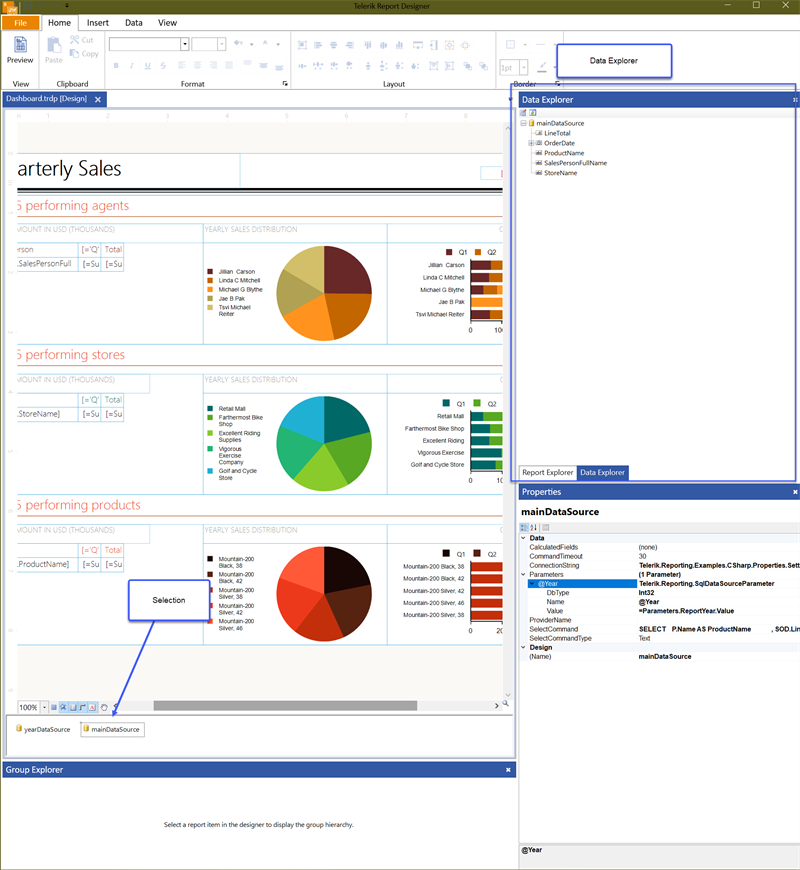
Fig. 11 - The Standalone Designer Data Explorer UI
Standalone Designer Group Explorer UI
Every Data Item Component, Report, Table/Crosstab/List, Graph and Map, in the report can use groups. These are displayed in the Group Explorer. Groups are named sets of data that are bound to a Data Item. The following screenshot illustrates the location of the group explorer in relation to the entire UI.
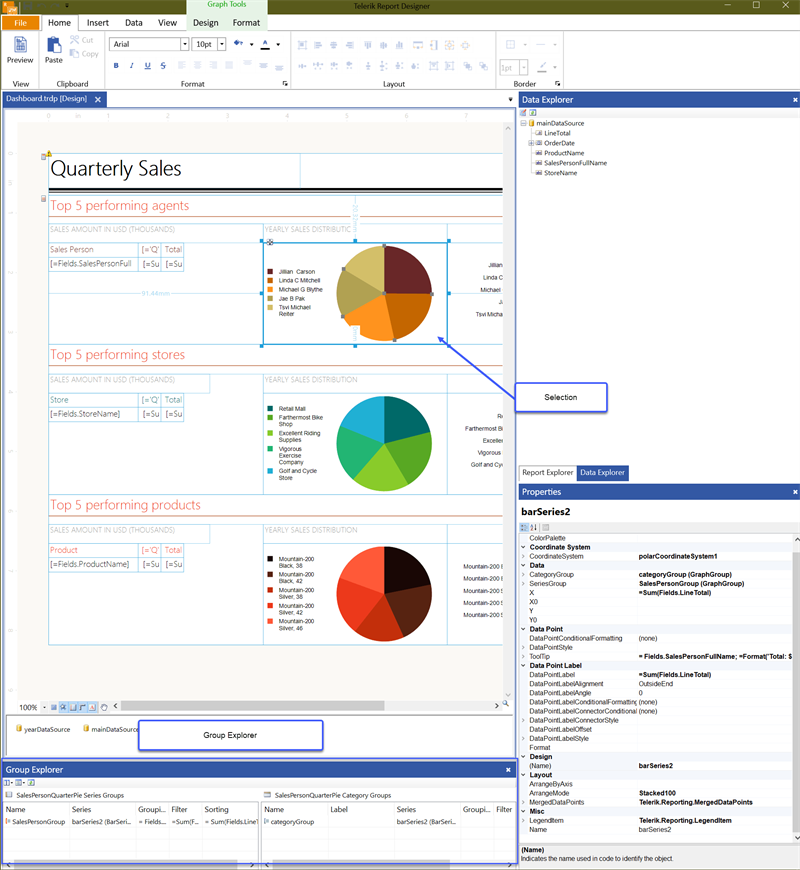
Fig. 12 - The Group Explorer UI
The previous section previews the user interface with the Standalone Report Designer. The other desktop designer is the Visual Studio Designer. Let us review it next.
The Visual Studio Designer UI
The elements of the Visual Studio designer UI and the Standalone Report Designer share the same UI elements. For example, each have the Group Explorer, Data Explorer, etc. The difference is the process for accessing them and adding components to the design surface. In the next section, we will review accessing the same sections and adding components to the design surface. Let us start by creating reports.
Creating Reports in the Visual Studio Designer
In Visual Studio, the Reports are created using the Report Class Library Project and Report Item templates. The project is a class library, and the report is a class type definition as opposed to an XML definition in the Standalone Report Designer.
First, create a Report Library project through the add new project wizard in Visual Studio.
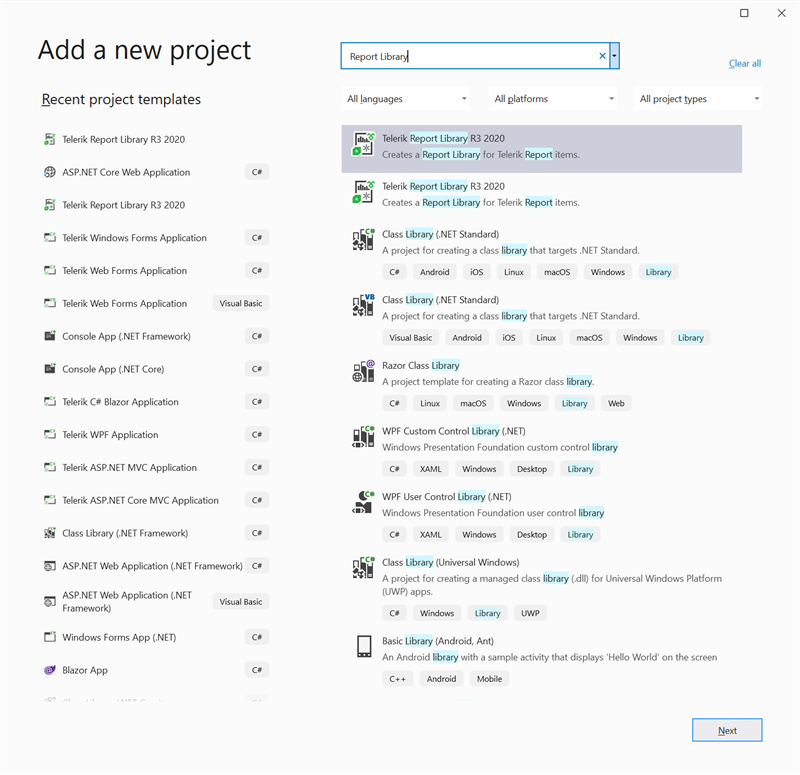
Fig. 14 - The Visual Studio Designer Add New Project
Next, add a new Report Definition through the add New Item wizard in Visual Studio.
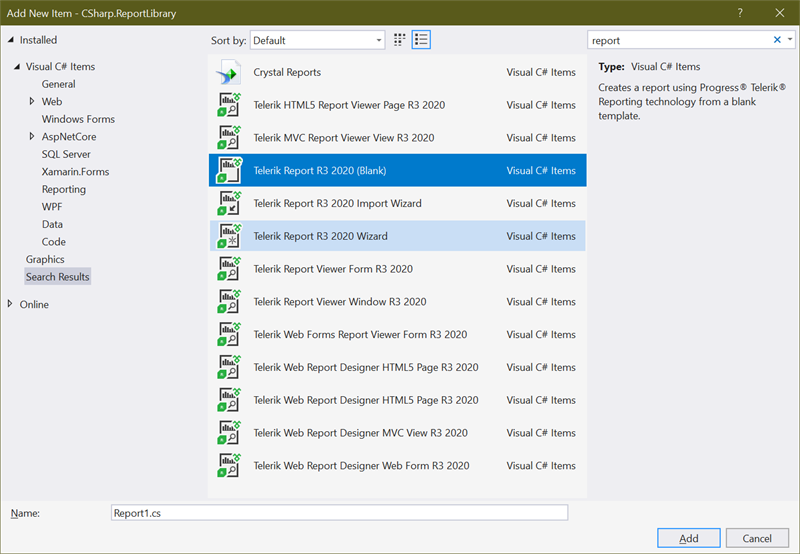
Fig. 15 - The Visual Studio Designer Add New Report Item
Visual Studio Designer Design Surface UI
The Visual Studio Designer has a design surface like the other designers. It includes a view mode to preview the report in various ways.
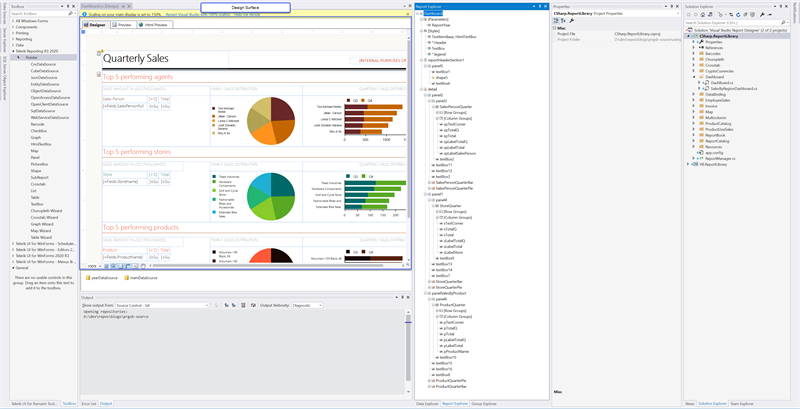
Fig. 16 - The Visual Studio Designer Design Surface
Visual Studio Designer Toolbox
The Toolbox in Visual Studio is where the designer can select the components for the report. This includes every Report Component available.
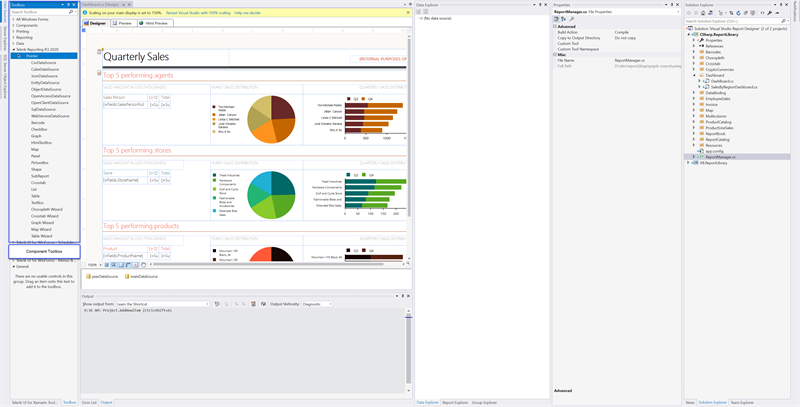
Fig. 17 - The Visual Studio Designer Toolbox
Visual Studio Designer View Editors
The view editors include the Report Explorer, the Properties Explorer, the Data Explorer, and the Group Explorer. These provide the same functionality as the Standalone Report Designer except opening them is slightly different.
To view them, right-click anywhere in the design surface, select view and then select the appropriate editor. This is described in the following screenshot.
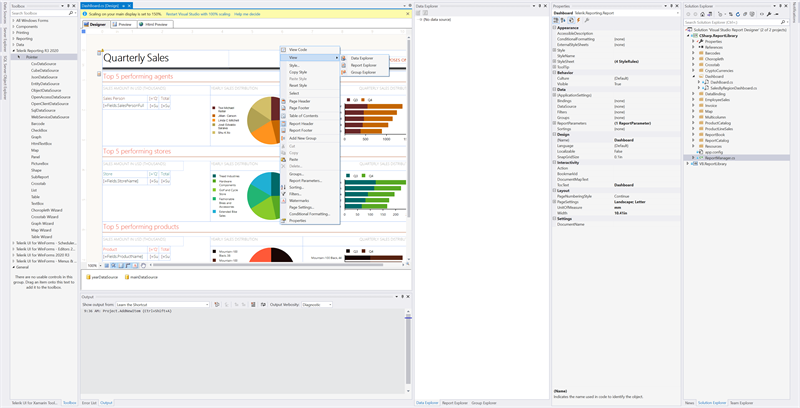
Fig. 18 - The Visual Studio Designer View Editors
Visual Studio Properties Explorer
The Visual Studio Properties Explorer works contextually as with the other designers. It is the Properties window in Visual Studio and when certain components are selected it will adapt to the selection.
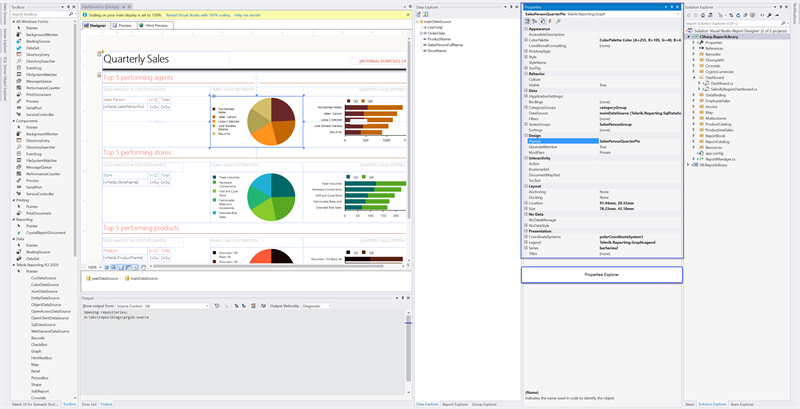
Fig. 19 - The Visual Studio Designer Properties Explorer
That concludes the elements that make up the desktop designers. It should display the various elements and what they do. Additionally, it should articulate the minor differences between the two interfaces. The next section will review the available tools.
Available Tools in the Desktop Designers
To aid in designing reports, several tools are included that make report design simpler and easier. These are our Report Wizards, Data Source Wizards and View Modes. Let us review those next.
The Report Wizards
Our Report Wizards enable designers to quickly create common reports with ease. Many of the common reports are the Band Report, the Label Report, the Invoice Report, and the Product Catalog. Let us review how to access them below for each desktop designer.
Standalone Report Designer Report Wizards
In the Standalone Report Designer, select the File Menu and then the New tab as shown in the following screenshot.
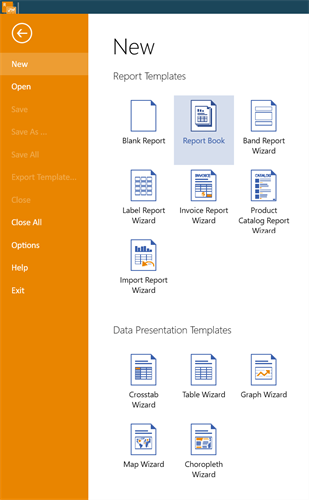
Fig. 20 - Standalone Report Designer Report Wizards
Visual Studio Designer Report Wizards
In the Visual Studio Designer, use the Add New Item dialog and select the new Report Wizard Template as seen in the below screenshots.
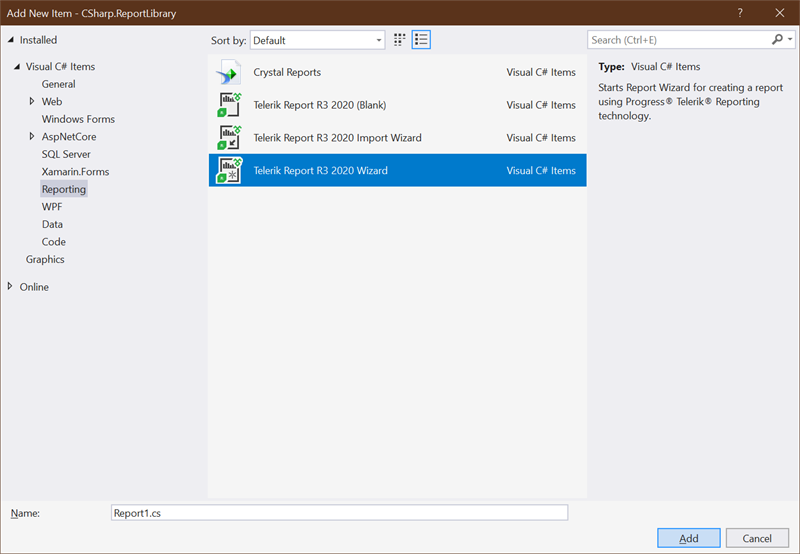
Fig. 21 - Visual Studio Designer Add New Report Wizards
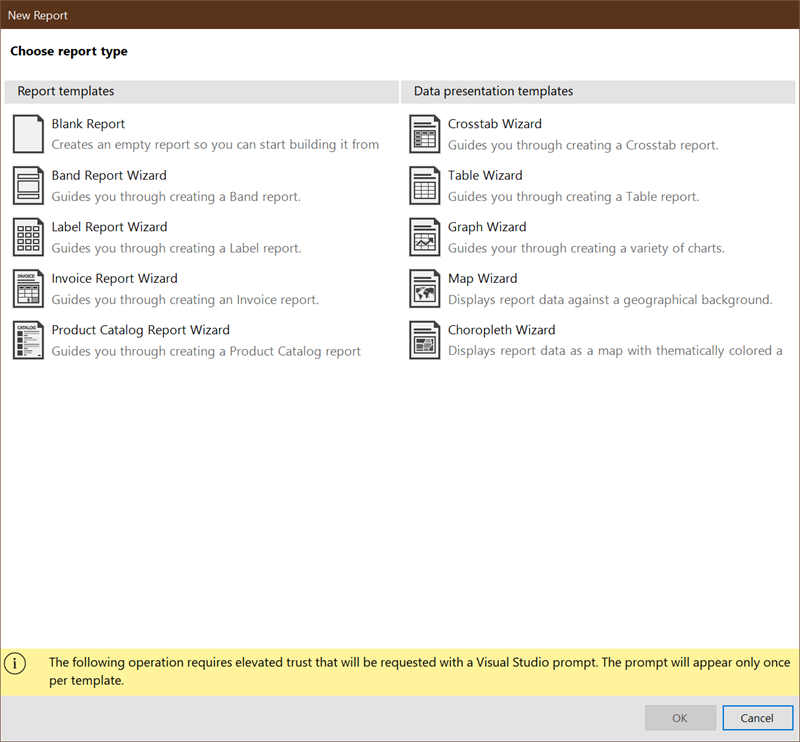
Fig. 21 - Visual Studio Designer Add New Report Wizards
The DataSource Wizards
For some, connecting to data is a daunting task. The data source wizards will walk the designer through creating a data source for the most common data sources. There are many common data sources. Next, we will review how to start the wizards for each desktop designer.
Standalone Report Designer DataSource Wizards
In the Standalone Report Designer, the data tab displays each data source. Selecting one and clicking in the Report Designer will start the wizard.
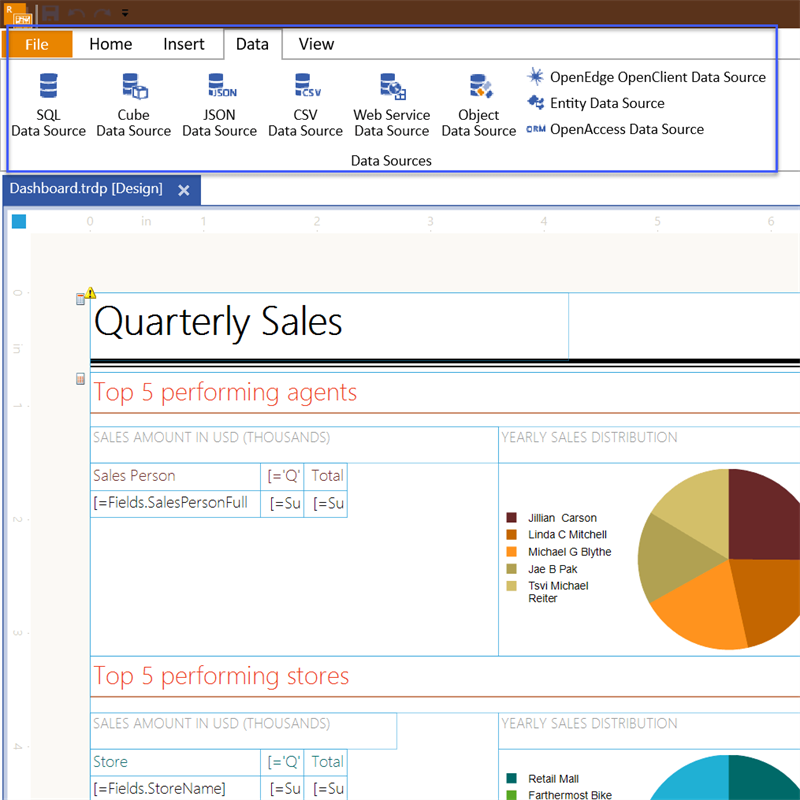
Fig. 22 - Standalone Report Designer Datasource Wizards
Visual Studio Designer DataSource Wizards
The Visual Studio Designer uses a similar approach to accessing the data sources. Select them from the toolbox and then select within the Report Designer. A nice feature with the wizards is that the process is chained. For example, if you start a Report Wizard that would create a Graph or Table, initially it would start with the DataSource Wizard so you will connect to the data and then continue with the actual Graph/Table Wizard that will use the data you just configured.

Fig. 23 - Visual Studio Designer Datasource Wizards
View Modes
View modes are different ways of viewing the report design. It can be in the designer view and preview view. The designer view provides a what-you-see-is-what-you-get view, and the preview provides a view of the rendered report.
Standalone Report Designer View Modes
The Standalone Report Designer uses a toggle button to enable preview or design. Additionally, it can preview reports using HTML5 preview when connected to a Report Server. This allows users to see how the report will look when previewed in the Report Server viewer.
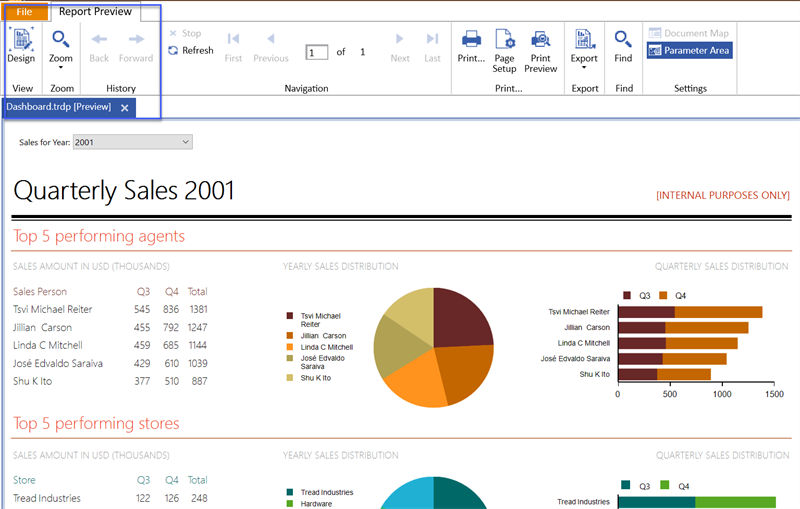
Fig. 24 - Standalone Report Designer View Button
Visual Studio Report Designer View Tabs
The Visual Studio Report Designer uses tabs and they are in the design surface. The Visual Studio Designer view modes add the HTML View as well.
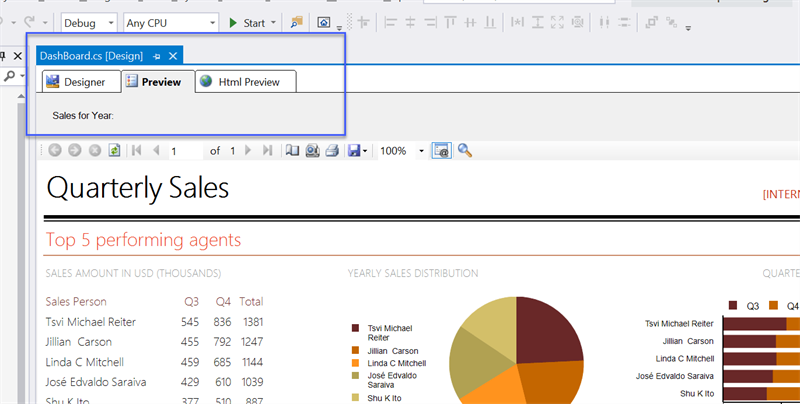
Fig. 25 - Visual Studio Designer View Tabs
This has been an overview of the desktop designers. We reviewed the methodologies used, the UI elements and the various tools available to aid designers in their workflow. These are the basic features of the designers, however, there are more advanced features that should be reviewed as well.
Advanced Concepts in the Desktop Designers
Up to this point, we have discussed basic usage in our desktop designers. As with any software there are more advanced functionalities. This includes concepts like templates, configuration, extensions, and a more recent addition .NET Core support. Let us begin with the Standalone Report Designer templates.
Standalone Report Designer Templates
Report templates are a powerful tool that can be used to create a series of standardized reports. Elements like headers, footers, logos can be identical across reports. To create a report template, use the File Menu and select Export Template as shown in the following screenshot.
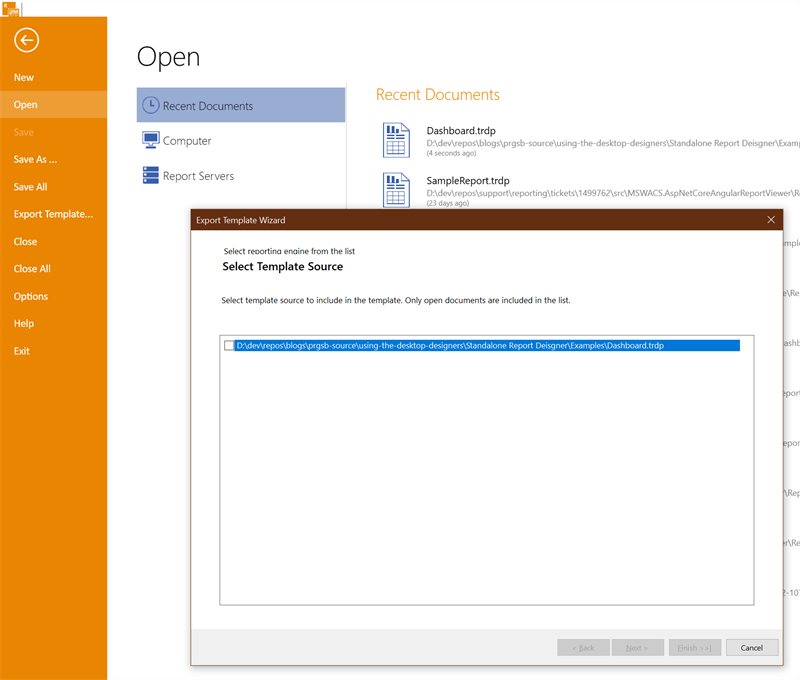
Fig. 26 - Standalone Report Designer Export Template
Standalone Report Designer Configuration
There are two areas for configuration in the Standalone Report Designer. These are the the user level, better known as options, and the application level. Getting to the Options is very easy.
Options
The options are available in the file menu as a separate tab. It includes a default language, default working directory and data connections. The options are self-explanatory except the default language dropdown. The available languages in the language’s dropdown depend on the available resource files. This option forces the designer to load the desired language Report Designer resources. The following screenshot illustrates the options.
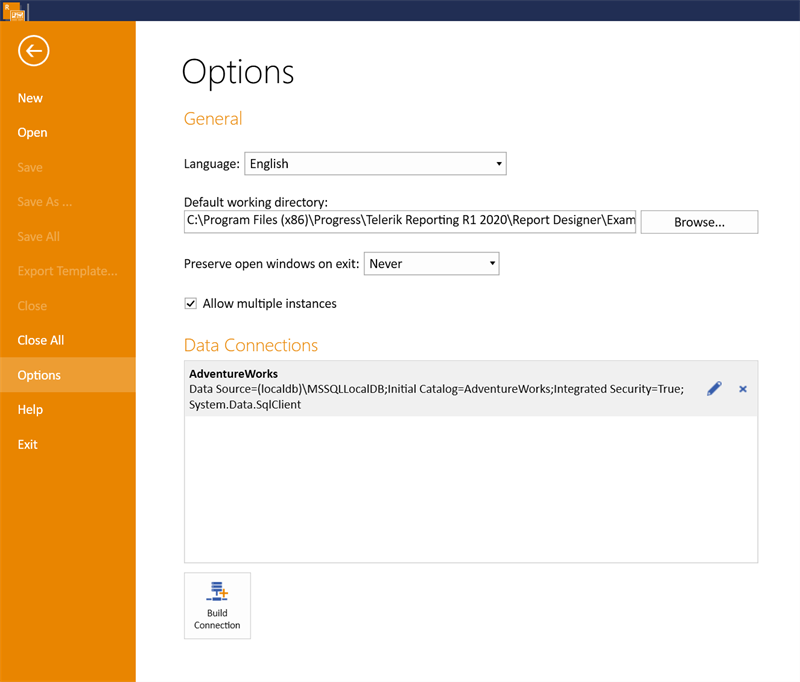
Fig. 27 - Standalone Report Designer Options
Application Configuration
The application configuration is available in the default installation folder adjacent to the application executable. This is illustrated in the following screenshot.

Fig. 28 - Standalone Report Designer Default Installation Folder
Below is an example configuration which includes several important sections. These are the connection string, default working directory, assembly references, a Trace Listener and an additional DbProvider.
<?xml version ="1.0"?>
<configuration>
  <configSections>
    <section name="Telerik.Reporting" type="Telerik.Reporting.Configuration.ReportingConfigurationSection, Telerik.Reporting" allowLocation="true" allowDefinition="Everywhere"/>
    <section name="Telerik.ReportDesigner" type="Telerik.ReportDesigner.Configuration.ReportDesignerConfigurationSection, Telerik.ReportDesigner.Configuration" allowLocation="true" allowDefinition="Everywhere"/>
  </configSections>

  <startup>
    <supportedRuntime version="v4.0" sku=".NETFramework,Version=v4.0"/>
  </startup>

  <runtime>
    <assemblyBinding xmlns="urn:schemas-microsoft-com:asm.v1">
      <!--
      <probing privatePath="path-to-the-assemblies"/>
      -->
      <dependentAssembly>
        <!-- Required for interoperability with older versions of Telerik Reporting -->
        <assemblyIdentity name="Telerik.Reporting" culture="neutral" publicKeyToken="a9d7983dfcc261be"/>
        <bindingRedirect oldVersion="0.0.0.0-14.2.20.1021" newVersion="14.2.20.1021"/>
      </dependentAssembly>
    </assemblyBinding>
  </runtime>

  <connectionStrings>
    <add name="Telerik.Reporting.Examples.CSharp.Properties.Settings.TelerikConnectionString" connectionString="Data Source=(localdb)\mssqllocaldb;Initial Catalog=AdventureWorks;Integrated Security=SSPI" providerName="System.Data.SqlClient" />
  </connectionStrings>

  <Telerik.ReportDesigner DefaultWorkingDir="Examples">
  </Telerik.ReportDesigner>

  <!-- Add assembly references -->
  <Telerik.Reporting>
    <AssemblyReferences>
      <add name="DataLibrary" />
    </AssemblyReferences>
  </Telerik.Reporting>

  <!-- Use this to debug the Report -->
  <!--
    <system.diagnostics>
        <trace autoflush="true" indentsize="4">
            <listeners>
                <add name="myListener" type="System.Diagnostics.TextWriterTraceListener" initializeData="C:\Temp\Telerik.ReportDesigner.log" />
                <remove name="Default" />
            </listeners>
        </trace>
    </system.diagnostics>
    -->

  <system.data>
    <DbProviderFactories>
      <remove invariant="System.Data.SQLite" />
      <add name="SQLite Data Provider" invariant="System.Data.SQLite" description=".NET Framework Data Provider for SQLite" type="System.Data.SQLite.SQLiteFactory, System.Data.SQLite, Version=1.0.112.0, Culture=neutral, PublicKeyToken=db937bc2d44ff139" />
    </DbProviderFactories>
  </system.data>
</configuration>
The Standalone Designer Connection String Section
The connection string section lists data connections available to the application. These will be shown when using the data wizards.
The Standalone Designer Default Working Directory Section
The default working directory is the location that is opened when an end user selects open from the file menu.
The Standalone Designer Assembly References Section
The assembly references section is used to extend the designer. More specifically, when using the ObjectDataSource the class library that it is bound to is referenced here. Additionally, if a class library contains many custom functions it would be referenced here as well.
The Standalone Designer Trace Listener Section
At times, there will be a need to debug custom assemblies used in the application and a Trace Listener is a .NET capability that is also available in the Standalone Report Designer.
The Standalone Designer DbProvider Section
When adding new database providers to the Standalone Report Designer, the DbProvider section is used. The previous example shows SQLite.
The above configuration sections enable the Standalone Report Designer to have the same capabilities as the Visual Studio Designer. Because of the designer application the designers require different configuration. Let us review the Visual Studio Designer configuration next.
Visual Studio Designer Configuration
The Visual Studio Designer requires less configuration because it is closer to the framework than the Standalone Report Designer. When using the Visual Studio Designer, it is a class library which uses an app.config for configuration settings and the Visual Studio environment which has a separate configuration, the devenv.exe.config. Let us review configuration for each section next.
The Visual Studio Designer Connection String Section
This is done in the app.config when using shared connections. It will also cover adding a new DbFactory since Visual Studio includes many different connection capabilities.
The Visual Studio Designer Assembly References Section
Since the report is in a class library accessing other class libraries is as simple as adding a project reference. An example of this could be a shared configuration class library that is used between the Reporting Class Library and the hosting application.
The Visual Studio Designer Trace Listener Section
For adding the TraceListener to troubleshoot the reporting engine, use the Visual Studio environment configuration. It is important to understand that for the hosting application, the TraceListener would be in the app.config. The location of the 2019 Visual Studio Environment Configuration is illustrated in the following screenshot.
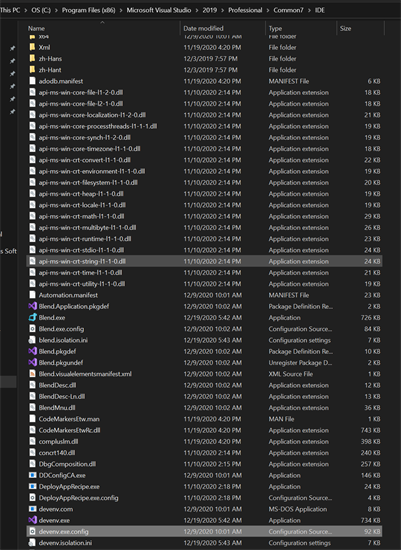
Fig. 29 - Visual Studio Designer devenv Configruation Folder
The above sections are relevant to both designers and handled differently as described. The other sections missing in the Visual Studio Designer are not necessary and do not require additional configuration. The next advanced concept is .NET Core Support.
.NET Core Support
It is important to understand which report designers support .NET Core. The main issue is reports built in the Visual Studio designer.
Using Reports Designed in the Visual Studio Designer
At this time, the best approach for using reports that were built in the Visual Studio designer is to convert them to .trdx/.trdp definition files. However, we do have a temporary workaround for achieving design-time support. if the goal is to programmatically generate reports and there is no need for design-time support, then the class report could be used.
This wraps up some important information about advanced topics in the desktop designers. We reviewed the various configuration options in both the Standalone Report Designer and the Visual Studio Designer as well as which designer supports .NET Core. Next is a brief overview of using reports across the designers.
Using Reports Across Designers
Since we have several designers it may be confusing which report designer should be used and with what designer. Currently, we are focusing on the declarative (.trdp/.trdx) definition because it is the most flexible across our report viewer hosting applications. However, we still support and find acceptable uses of the Report Class definition. Quickly, let us review which designer supports each.
The declarative definition is built in the Standalone Report Designer and the Web Report Designer. This provides the most flexibility for a report designer. It enables designing reports on the desktop and the web.
The C#/VB.NET Report Class definitions can only be used with Visual Studio. Additionally, at the current time, design-time support is only supported with the .NET Framework as .NET Core support is coming. With these different design definitions, it is possible to use them across the different designers through import.
Importing Reports Created with the Standalone Report Designer
For the case of importing reports designed using the declarative designers into the Visual Studio Designer, the Visual Studio Designer includes an import report wizard which can be used to convert declarative definitions into a Report Class definition. For details on this see the documentation article, How to import reports created with the Standalone Report Designer.
Importing Reports Created with Visual Studio
In the case of importing reports designed using the Visual Studio Report Designer into the Standalone Report Designer or the Web Report Designer, the steps are straightforward with the exception of when using an external assembly for an ObjectDataSource.
For a thorough article that describes How to Import Reports Created with the Visual Studio Report Designer refer to the documentation. However, in the case of external assemblies, add the assemblies to the Standalone Report Configuration like in the Extending the Standalone Report Designer section.
Conclusion
This concludes the Report Designer series. In this post we reviewed designing reports by discussing methodologies used, UI elements and available tools. Next, we review the advanced concepts through configurations in the desktop designers. Finally, we review working across the various designers.
I hope that you enjoyed a more detailed review our desktop designers. For simplicity, I tried to keep the format of the last two posts similar. Overall, I hope that everyone gains a greater understanding of all our designer tooling. If you ever have any questions, I’m always happy to help.
Want to Try Telerik Reporting?
Telerik Reporting is a complete, easy-to-use, and powerful .NET embedded reporting tool for web and desktop applications that support: ASP.NET Core, Blazor, ASP.NET MVC, ASP.NET AJAX, HTML5/JS, Angular, React,Vue, WPF, WinForms. Also available as a part of our Telerik DevCraft Complete bundle, Reporting allows you to create, style, view, and export rich, interactive, and reusable reports to attractively present analytical and any business data. Add reports to any business application through report viewer controls. Export the ready reports in more than 15 formats. Download a FREE trial today.

Eric Rohler
Eric was a Technical Support Engineer at Progress.


