

Photo by Caspar Camille Rubin on Unsplash
I love dashboards, and I run several on my system to monitor my HR startup in real time. I love collecting data points around subscriptions, user activity, and most importantly, server uptime and performance. Especially now that we are growing to thousands of customers and tens of thousands of employees using our system on a daily basis, I am finding that a lot of things that we built in the early days are starting to show cracks and issues.
Most of this would have been hidden from my knowledge, except for the fact that we have been using AppSignal for our application monitoring for just over a year now, and the AppSignal dashboards and one screen that I keep checking several times a day to ensure that everything is just ticking along fine.
One thing that I have noticed of late though, is the page rendering speed was slowly creeping up. Pages that were taking 1 to 2 seconds to build and render on the server side were now taking 5 to 8 seconds, sometimes 10 seconds plus. This was, of course, unacceptable, and would be severely impacting the user experience for our customers and their employees.
Hunting For The Problem
I was curious as to what was causing these slow downs, and luckily, AppSignal’s fantastic dashboard actually allows me to click on one of these peaks on the chart, and see exactly what was happening at this point, like so:

From this, it will show a breakdown of all the App processes that were running at this particular point in time, making it easy to identity the ‘slow process’:

And furthermore, clicking on the process name above, will show you an ‘execution timeline’, showing all the calls and database activity, along with the execution time for each:

This makes it so easy to see the actual database query that was causing the slowdown in the first place.

This is showing the actual SQL code that is running slowly in this instance.
Identifying The Underlying Cause
So what was the issue? The answer was actually quite easy to deduce by the above database query tracing, and it had a lot to do with how Ruby ORMs (Object Relational Mappers) work. What is an ORM? Well, to simplify the explanation, it is basically a way for Ruby to treat a database store as just another Ruby object, allowing you to manipulate it just like a normal Ruby object without worrying about knowing SQL (Structured Query Language) or any underlying database commands.
To explain it in layman’s terms - lets say you have a database table called ‘Employees’, and you also have another table called ‘Departments’. Now, each employee can belong to exactly one department, so you can set up a relationship between the two tables so that there is a department_id field in the Employees table, which links to the id within the Departments table.

Now, because we have many different companies using our HR system, we need to also have a Company database, and link each Employee, AND each Department to a company by using a company_id field to separate them. Each company can have their set of employees, and each company can also have their own unique set of departments.

Looks a bit complicated right? And handling this in SQL would be a tricky thing, however, the DataMapper Ruby ORM that we use to layer on top of our database actually makes this extremely easy. In fact, to access, for example, all employees in Company ‘Acme Industries’, who are in the Department called ‘Finance’, it would be as easy as executing this:

And it would work straight away. No need to worry about table joining etc. - the ORM takes care of all of that for us, and gives us the results we desire… or does it?
Let’s look at the SQL query that we would normally do to get the same result, using a standard SQL INNER JOIN clause:

A lot more complicated, isn’t it? BUT… it is super fast, and able to pluck out employees from a table with thousands of companies and millions of employees in less than a second. That is the beauty of raw SQL.
However, when I look at the raw SQL being generated by our DataMapper ORM, it was a little different. Now, with SQL, there are many ways to skin a cat, and it looks like DataMapper was taking the easiest pathway. After all, multi table joins are complicated - just look at the query above! What DataMapper was doing was splitting the query into three parts based on the things being asked of it. Here was the resulting code:

It is important to realise that this is actually giving the EXACT SAME result as the raw SQL query above, but it is doing it in a slightly different way.
But why was it running so much slower that it should have? It didn’t really make sense.
But then, we realised it. It was all coming down to Step 2 of the DataMapper query, which was staring at us in the face when we looked at the AppSignal logs.
Fixing The Problem
You see, now that we had thousands upon thousands of customers in the system, almost all our customers had a Department called ‘Finance’ in their companies. So Step 2 was actually returning THOUSANDS of department IDs that Step3 was trying to look for. Of course, most companies only have ONE department called ‘Finance’, so the third step should have only been looking for one company_id and ONE department_id, but it was not. All because we had not specified a qualifier for the Departments table.
Changing the DataMapper query to the following helped to increase the speed of the query quite significantly:

As you can see, we had to add the qualifier:
:company => {:name => “Acme Industries”}to the Department file as well.
This resulted in the following conversion to SQL:

So while the Ruby method now looks like we are duplicating things a little, it actually works better in terms of database performance.
To show you the difference, here is the AppSignal dashboard for page rendering speed before and after we made the fix:
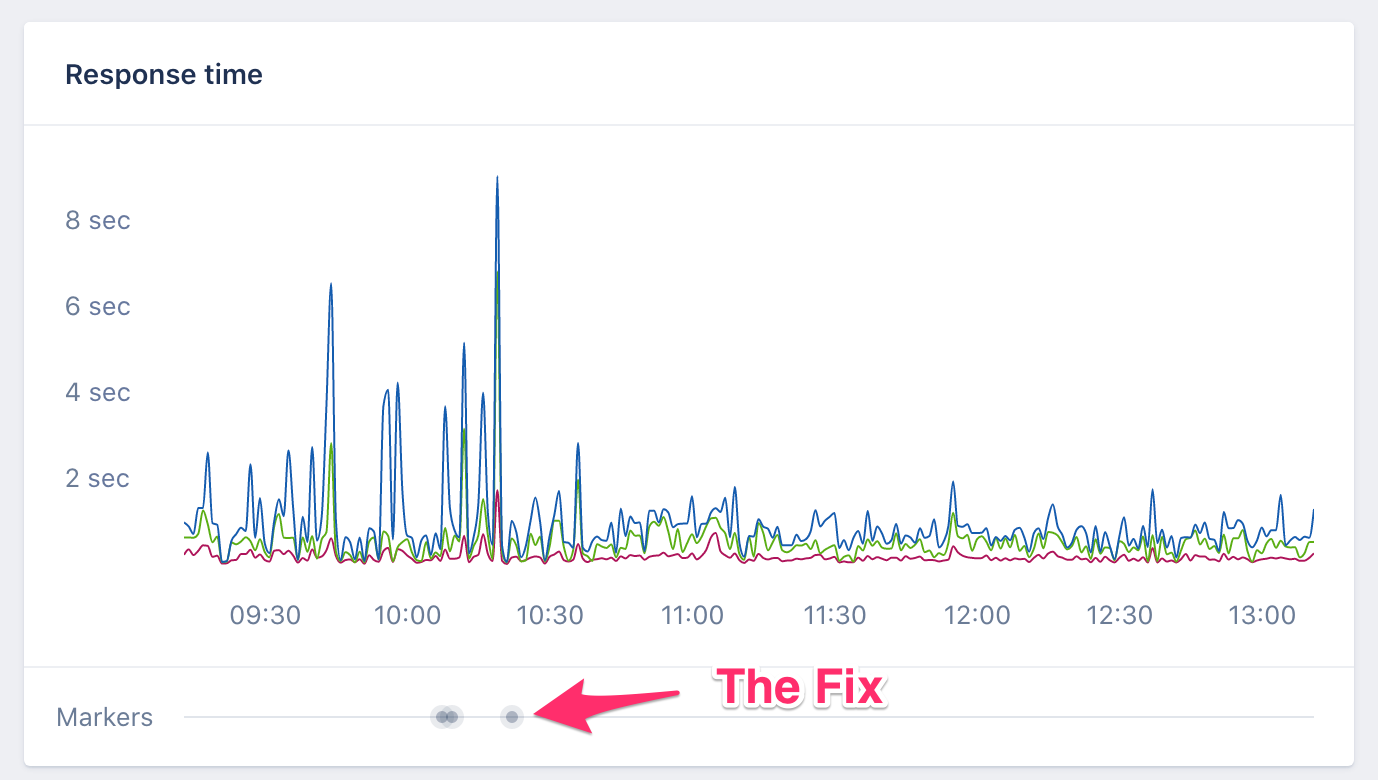
Look at the drop in average page responses from 4 to 6 seconds, down to 2 seconds or less.
This didn’t stop here. Motivated by these gains, I went ahead and kept looking at later spikes to see if there was anything else on our dashboard that could be optimised. Sure enough, I found a couple of other queries that had the same issue, and I fixed those too:

Most big spikes gone! What a win.
This just goes to show the importance of an application monitoring tools such as AppSignal or any other APM (Application Performance Monitoring) tool for your SaaS. A lot of time, you won’t realise that certain optimisations will be needed when you have a smaller data set. It is only as you grow that you start to see some of these bottlenecks, and a good tool will certainly help narrow down where you should be working on.
Most times, people just upgrade server capacity, or throw more caching solutions in the mix, but all that costs extra money, and if you a bootstrapped startup like us, this sort of fix cost $0. Actually, in terms of AppSignal subscription price, it has pretty much paid for this whole year’s subscription to their service in terms of cost savings from our hosting provider.