
AXGraphView
AXGraphView creates zoomable and scrollable graphs.
Screenshot


Preview (GIF)

Installation
AXGraphView is available in the JCenter, so you just need to add it as a dependency (Module gradle)
Gradle
implementation 'com.aghajari.graphview:AXGraphView:1.0.2'
Maven
<dependency>
  <groupId>com.aghajari.graphview</groupId>
  <artifactId>AXGraphView</artifactId>
  <version>1.0.2</version>
  <type>pom</type>
</dependency>
Quick Start
- Add view to your layout :
<com.aghajari.graphview.AXGraphView
    android:id="@+id/graph_view"
    android:background="@android:color/white"
    android:layout_width="match_parent"
    android:layout_height="match_parent"/>
- Set Graph Options
AXGraphView graphView = findViewById(R.id.graph_view);
AXGraphOptions options = new AXGraphOptions(this);

options.scrollEnabled = true;
options.xDividerIntervalInPx = 100;
options.xDividerInterval = 0.5f;
options.yDividerIntervalInPx = 100;
options.yDividerInterval = 0.5f;
options.maxZoom = 6f;
options.minZoom = 0.5f
options.drawAxis = true;
...

graphView.setGraphOptions(options);
- Add Graph Formula
graphView.addFormula(new AXGraphFormula() { // x^2
    @Override
    public float function(float x) {
        return (float) Math.pow(x,2);
    }
});

graphView.addFormula(new AXGraphFormula() {
    @Override
    public float function(float x) { // x^3
        return (float) Math.pow(x,3);
    }
});
Or simply use Graph Formula Parser :
graphView.addFormula(new GraphFormulaParser(this,"(x)^2"));
graphView.addFormula(new GraphFormulaParser(this,"(x)^3"));
FormulaParser
Currently i'm using this Eval Method for parsing a formula in sample of AXGraphView, you can also use other libraries to parse the formula and draw it in AXGraphView.
Graph Axis
- Change Axis Position :
You can change the default axis position in options.
options.axis = new PointF(-300,AXGraphOptions.DEFAULT);
- Disable drawing Axis and grid lines :
options.drawAxisX = false;
options.drawAxisY = false;
options.drawGridXLines = false;
options.drawGridYLines = false;
options.drawAxisXDivider = false;
options.drawAxisYDivider = false;
options.drawXText = false;
options.drawYText = false;
- Change axis color :
options.axisPaint.setColor(Color.RED);
options.textPaint.setColor(Color.RED);
options.gridLinePaint.setColor(Color.GRAY);
Domain of Graph
You can limit domain of the Graph.
graphView.addFormula(new AXGraphFormula() { // x^2
    @Override
    public float function(float x) {
        return (float) Math.pow(x,2);
    }

    @Override
    public boolean isInDomain(float x) {
        return Math.abs(x) < 1;
    }
});
Custom Points
You can customize an Specific Point in Graph.
graphView.addFormula(new AXGraphFormula() { // Sin(x)

    @Override
    protected void init() {
        super.init();
        addCustomFunctionPoint(1);
        addCustomFunctionPoint(-1);
        addCustomPoint(0,3);
    }

    @Override
    public float function(float x) {
        return (float) Math.sin(x);
    }

    @Override
    public AXGraphPointType getPointType(float x, float y) {
        if (x==0) return AXGraphPointType.EMPTY;
        return super.getPointType(x, y);
    }
});
Transform
You can move(x&y) or change scale(x&y) of the function on graph!
formula.applyTransformMove(3f,2.5f);
formula.applyTransformScale(1.5f,1.5f);
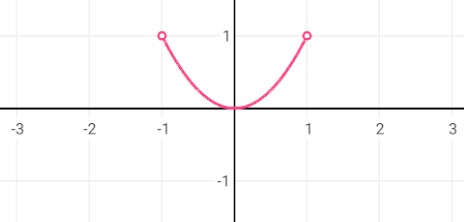
MultiFormula
You can also draw multi functions together.
public class HeartGraphFormula extends AXGraphMultiFormula {

@Override
    public float[] multiFunction(float x) {
        return new float[] {
                function1(x),
                function2(x)
        };
    }

    public float function1(float x) {
        return (float) Math.sqrt(1 - Math.pow(Math.abs(x) - 1,2));
    }

    public float function2(float x) {
        return (float) (Math.acos(1 - Math.abs(x)) - Math.PI);
    }
}
Output :

Custom Draw
You can draw custom shapes using AXGraphCanvas (by graph x,y) :
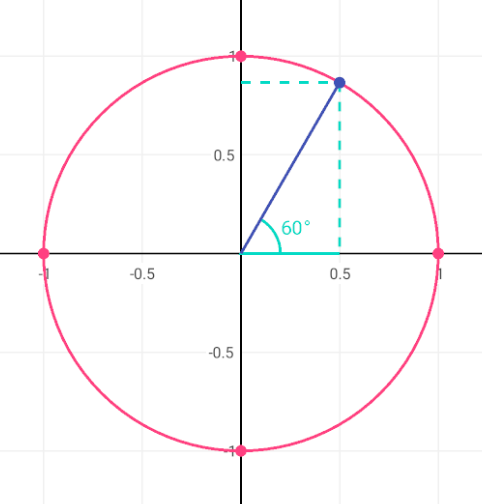
CircleGraphFormula (click to expand)
public class CircleGraphFormula extends PaintedGraphFormula {

    private float r;
    private int angle;
    Paint paint;

    public CircleGraphFormula(Context context,float r,int angle){
        super(context);
        this.r = r;
        this.angle = angle;
        paint = new Paint();

        getGraphPaint().setStyle(Paint.Style.STROKE);
        getPointPaint().setColor(getGraphPaint().getColor());
        setPointCircleRadius(getPointCircleRadius()*1.2f);

        addCustomPoint(0,r);
        addCustomPoint(0,-r);
        addCustomPoint(r,0);
        addCustomPoint(-r,0);
    }

    @Override
    protected boolean onDraw(AXGraphCanvas canvas) {
        canvas.setRadiusFromAxis(true);
        canvas.drawCircle(0,0,r, getGraphPaint());

        if (angle!=0) {
            float angleR = (float) Math.toRadians(angle);
            String text = angle+"°";

            paint.setColor(Color.parseColor("#03DAC5"));
            paint.setStrokeWidth(getGraphPaint().getStrokeWidth());
            final float x = (float) Math.cos(angleR) * r;
            final float y = (float) Math.sin(angleR) * r;

            float r2 = r/5;
            paint.setStyle(Paint.Style.STROKE);
            canvas.drawArc(-r2,-r2,r2,r2,-angle,angle,true,paint);

            paint.setStyle(Paint.Style.FILL);
            paint.setTextSize(canvas.findGraphX(r)/10);
            canvas.drawText(text,r2,r2/1.5f, Gravity.CENTER_VERTICAL|Gravity.LEFT,paint);

            canvas.drawLine(0,0,x,0,paint);
            paint.setPathEffect(new DashPathEffect(new float[] {20f/canvas.getGraphScale(),20f/canvas.getGraphScale()}, 0f));
            canvas.drawLine(x,y,x,0,paint);
            canvas.drawLine(0,y,x,y,paint);
            paint.setPathEffect(null);

            paint.setColor(canvas.getGraphView().getContext().getResources().getColor(R.color.colorPrimary));
            canvas.drawLine(0,0,x,y,paint);

            int savedColor = getPointPaint().getColor();
            getPointPaint().setColor(paint.getColor());
            drawPoint(canvas,x,y, AXGraphPointType.CUSTOM);
            getPointPaint().setColor(savedColor);
        }
        return true; //skip drawing function
    }

    @Override
    public float function(float x) {
        return Float.POSITIVE_INFINITY; //undefined
    }
}
Famous Graphs
| Name | Formula | AXGraphView |
|---|---|---|
| Quadratic | x^2 |  |
| Cubic | x^3 |  |
| Quadratic And Cubic | x^2 , x^3 |  |
| Homographic | 1/x |  |
| Square | √x |  |
| Cubic Root | 3√x |  |
| Cubic Root | 3√(x^2) |  |
| Bracket | [x] |  |
| Absolute Value | |x| |  |
| |x+1| - |x-1| | |x+1| - |x-1| |  |
| Exponential | 2^x |  |
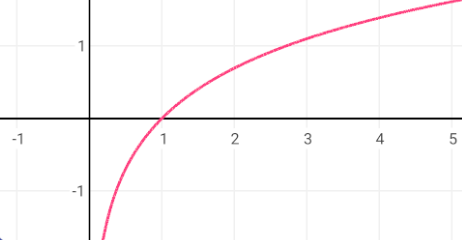
| Logarithm | log(x) |  |
| Sine | sin(x) |  |
| Cosine | cos(x) |  |
| Sine And Cosine | sin(x) , cos(x) |  |
| Tangent | tan(x) |  |
| Cotangent | cot(x) |  |
| Tangent And Cotangent | tan(x) , cot(x) |  |
Multi Formula Graphs
| Name | AXGraphView |
|---|---|
| Heart |  |
| Captain America |  |
| Superman |  |
| Batman |  |
| The Flash |  |
| Wonder Woman |  |
Author
- Amir Hossein Aghajari


