How to Use Perf Performance Analysis Tool on Ubuntu 20.04
Perf is a simple but powerful performance monitoring tool for Linux based operating systems. It is used to trace or count both hardware and software events. It provides a number of subcommands and capable of statistical profiling of the entire system. It helps you to identified and solve performance related issues.
In this tutorial, we will show you how to install and use Perf performance monitoring tool on Ubuntu 20.04.
Prerequisites
- A server running Ubuntu 20.04 server.
- A root password is configured on the server.
Install Perf
By default, the Perf package is not available in the Ubuntu 20.04 default repository. You can install it with the following command:
apt-get install linux-tools-$(uname -r) linux-tools-generic -y
Once the installation is finished, you can verify the installed version of Perf with the following command:
perf -v
You should get the following output:
perf version 5.4.30
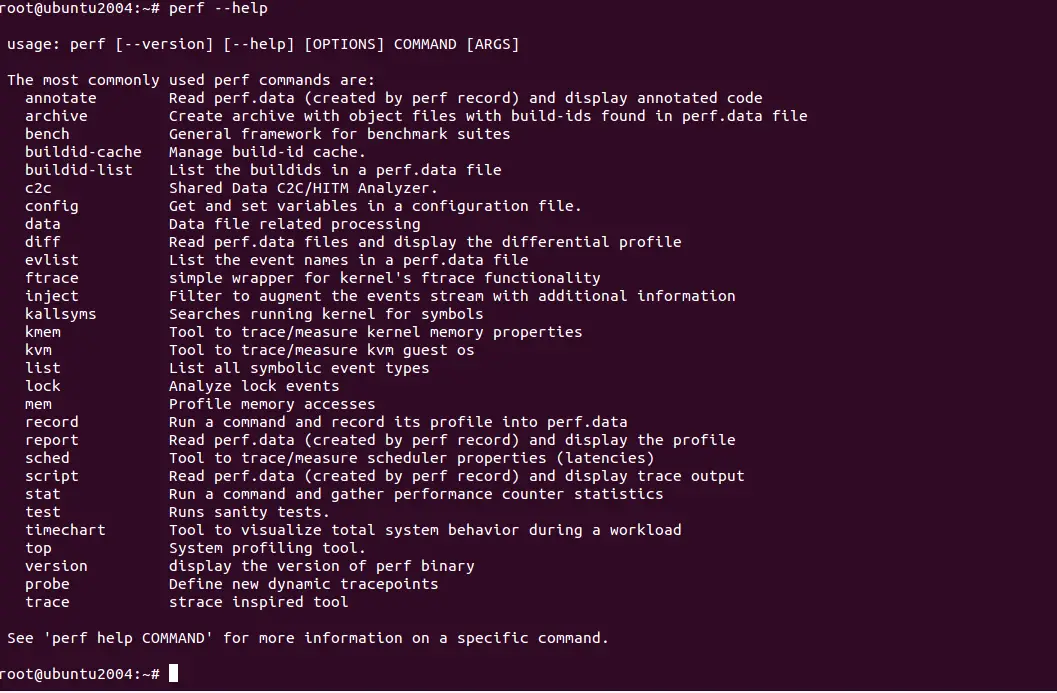
You can print all options available with Perf command with the following command:
perf --help
You should see the following screen:
Perf list
You can use Perf with subcommand to collects Linux performance statistics from it.
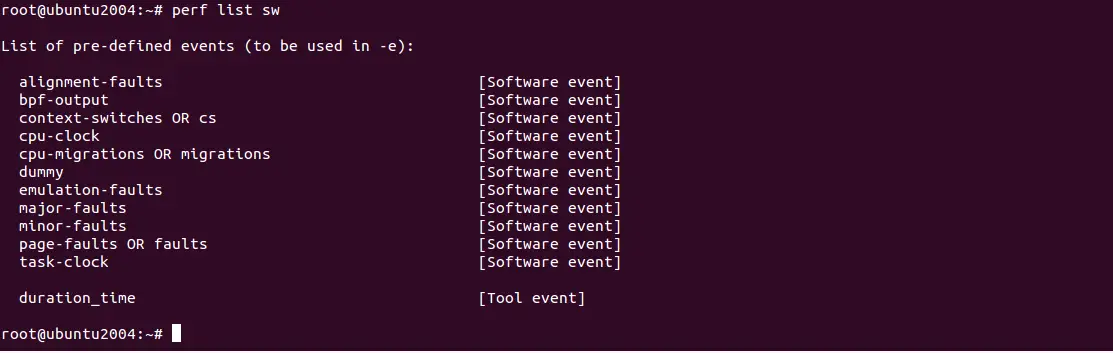
To display the list of software pre-defined events in Linux, run the following command:
perf list sw
You should see the following screen:
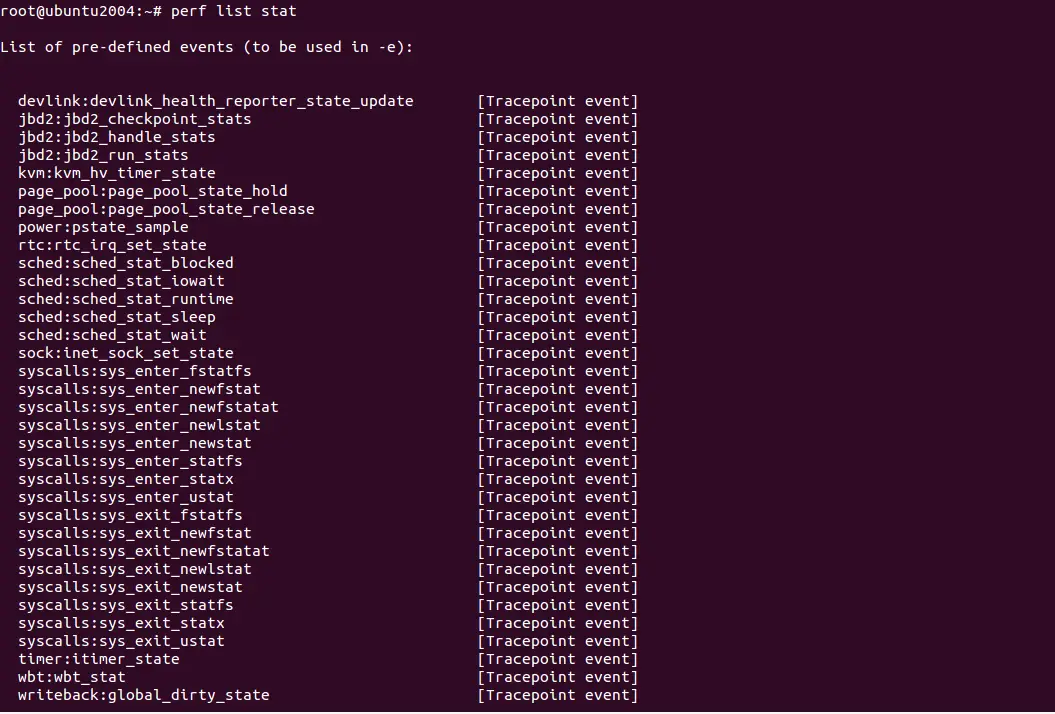
You can print all strace events using the following command:
perf list stat
You should see the following screen:
To get the performance statistics of ls -ld /etc command, run the following command:
perf stat ls -ld /etc/
You should see the following output:
drwxr-xr-x 83 root root 4096 Dec  9 08:56 /etc/

 Performance counter stats for 'ls -ld /etc/':

              3.18 msec task-clock                #    0.809 CPUs utilized
                 0      context-switches          #    0.000 K/sec
                 0      cpu-migrations            #    0.000 K/sec
               115      page-faults               #    0.036 M/sec
         cycles
         instructions
         branches
         branch-misses

       0.003933936 seconds time elapsed

       0.000000000 seconds user
       0.004122000 seconds sys
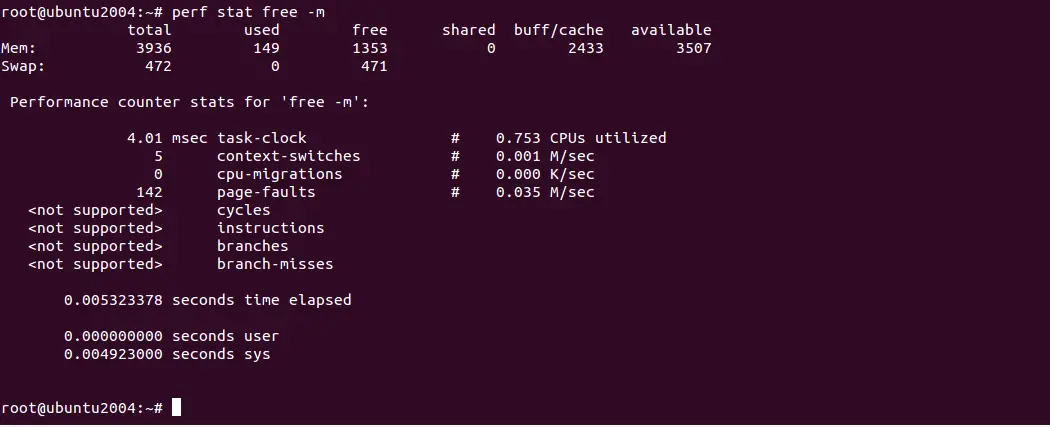
If you want to know what happens in our system when we run "free -m" command, use the following command:
perf stat free -m
You should get the following screen:
Perf Top
You can use the top subcommand with Perf to display a performance counter profile in real time:
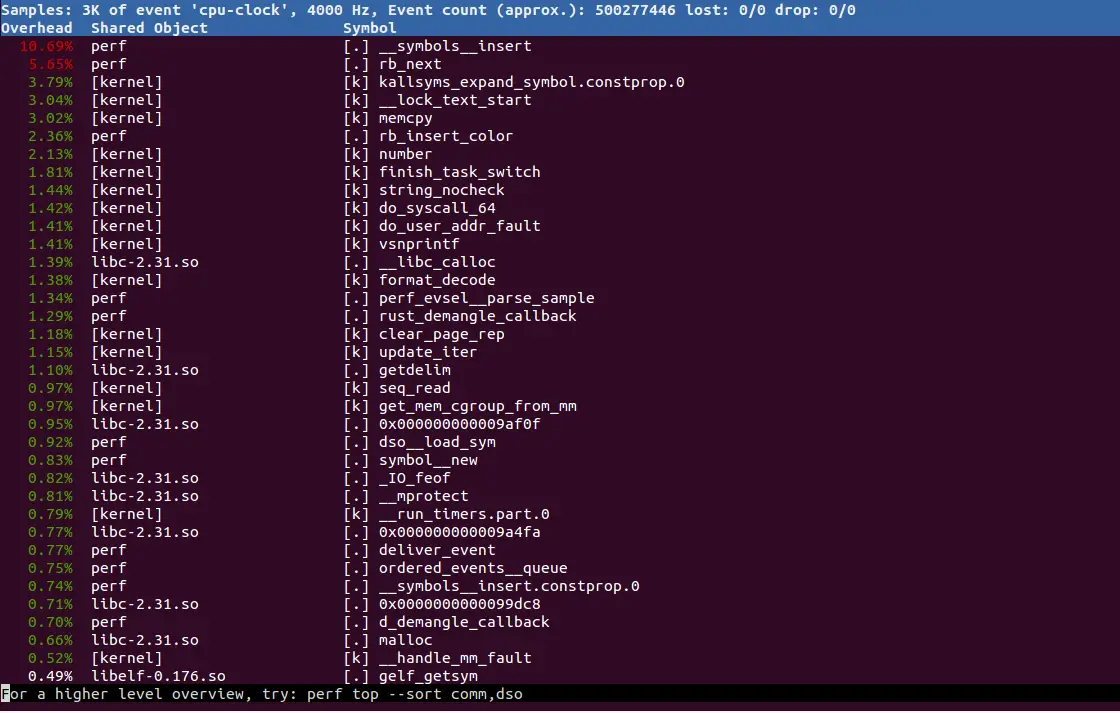
For example, use the perf top command with -a option to see all of the known event types:
perf top -a
You should see the following screen:
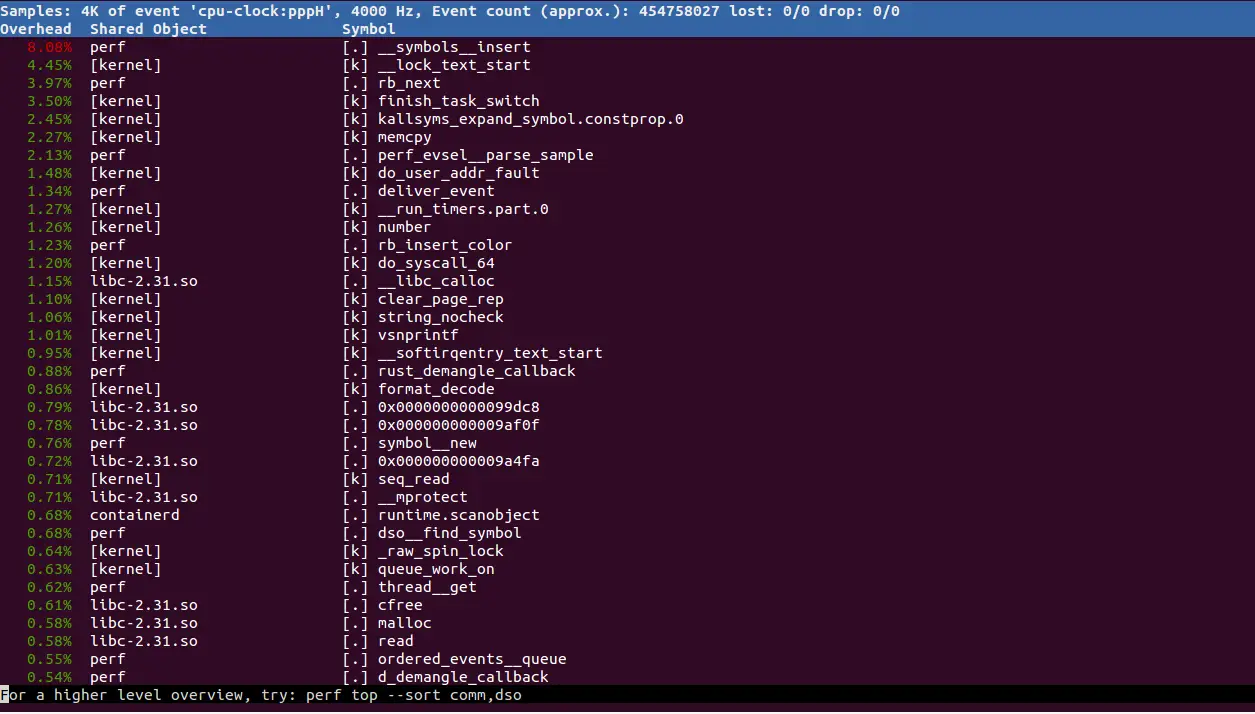
To display cpu-clock related events, use the -e option as shown below:
perf top -e cpu-clock
You should see the following screen:
Perf Record
perf-record is a command-line tool used to record its profile into perf.data inside the current working directory.
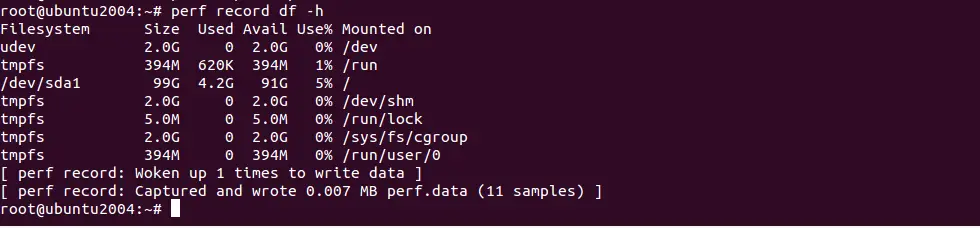
For example, run the df -h command and record its profile into perf.data using the below command:
perf record df -h
You should see the following screen:
Perf Report
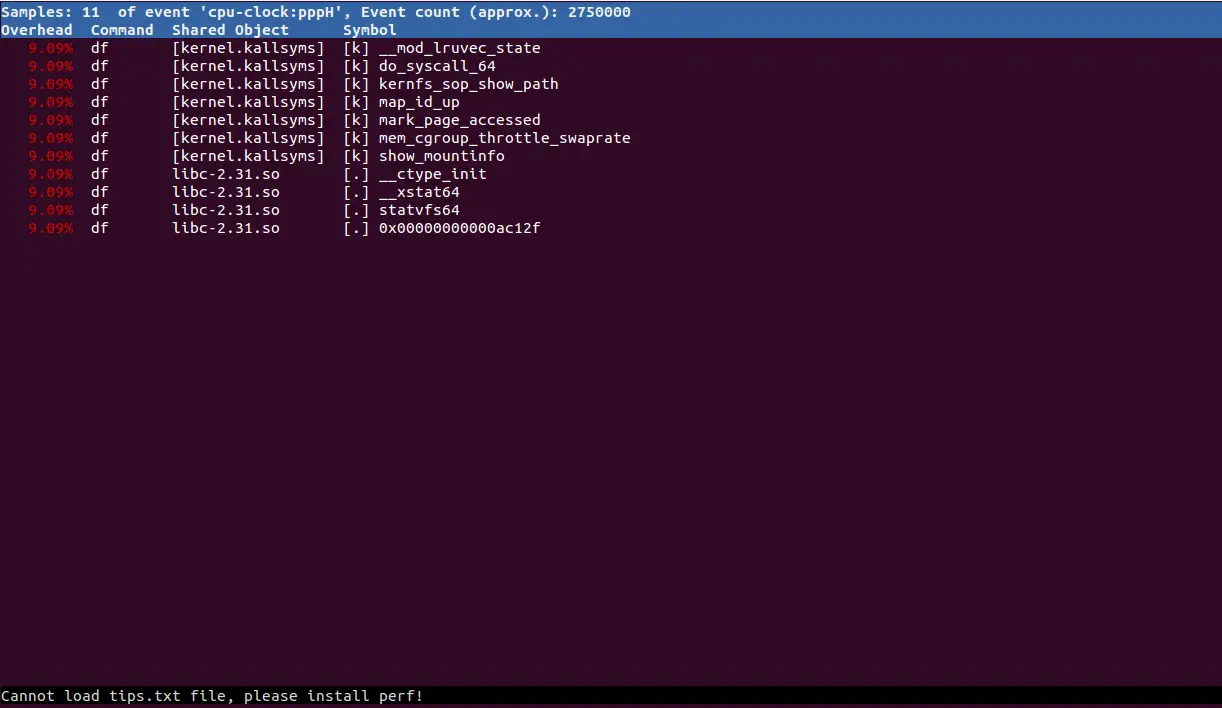
perf report command is used to analyze file generated by perf record and generate flat or graph profile.
perf report
You should see the following screen:
Perf Benchmark
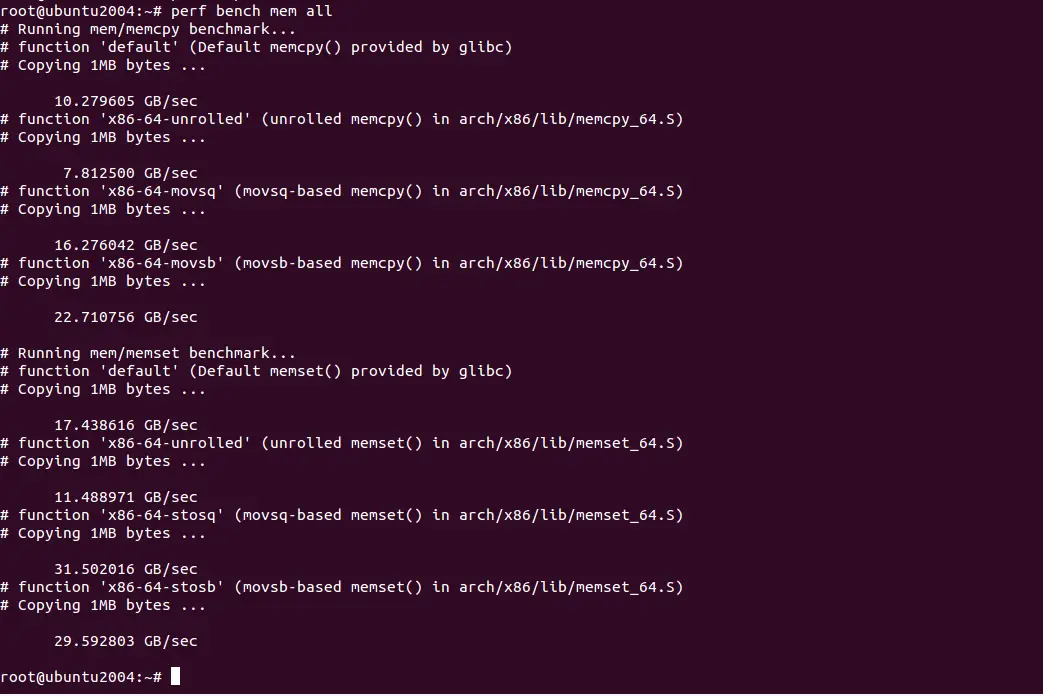
You can use the perf bench command to perform several benchmarks on the system. For example, if you want to check all memory speed tests, use the below command:
perf bench mem all
You should see the following screen:
Conclusion
In the guide, you learned how to install and use the Perf performance monitoring tool on Ubuntu 20.04. You can now explore this tool and try on different command options.

