PostgreSQL Monitoring for Application Developers: The DBA Fundamentals
I am an accidental DBA, with a huge emphasis on "accidental." I came to PostgreSQL as an application developer who really liked to program with SQL and use the database to help solve my problems. Nonetheless, these systems would enter into production, and as such I had to learn to support them.
PostgreSQL monitoring and performance optimization is a vast topic. In fact, I'll read content like what my colleague Greg Smith wrote on benchmarking PostgreSQL 13 on Ubuntu and be reminded that I have much more to learn! There's no way a few blog posts on the topic can do justice to it, but I want to try and share some of the insights I gleaned as the application developer thrust into an operations role.
In the previous post, I talked about how I could learn a lot from monitoring my Postgres system just by looking at the vital statistics: CPU, memory, disk, and network utilization. These stats about resource utilization were helpful as a starting point: they could indicate what part of the system was having an issue, but maybe not exactly what the problem is.
This is where the fundamental DBA statistics come into play.
 These statistics provide an overall look at PostgreSQL database activity and can
help you spot problems with performance and availability, and can provide "early
warnings" before "bad things" start to happen.
These statistics provide an overall look at PostgreSQL database activity and can
help you spot problems with performance and availability, and can provide "early
warnings" before "bad things" start to happen.
So, what do these metrics tell you, and how can you use them to successfully manage your PostgreSQL database?
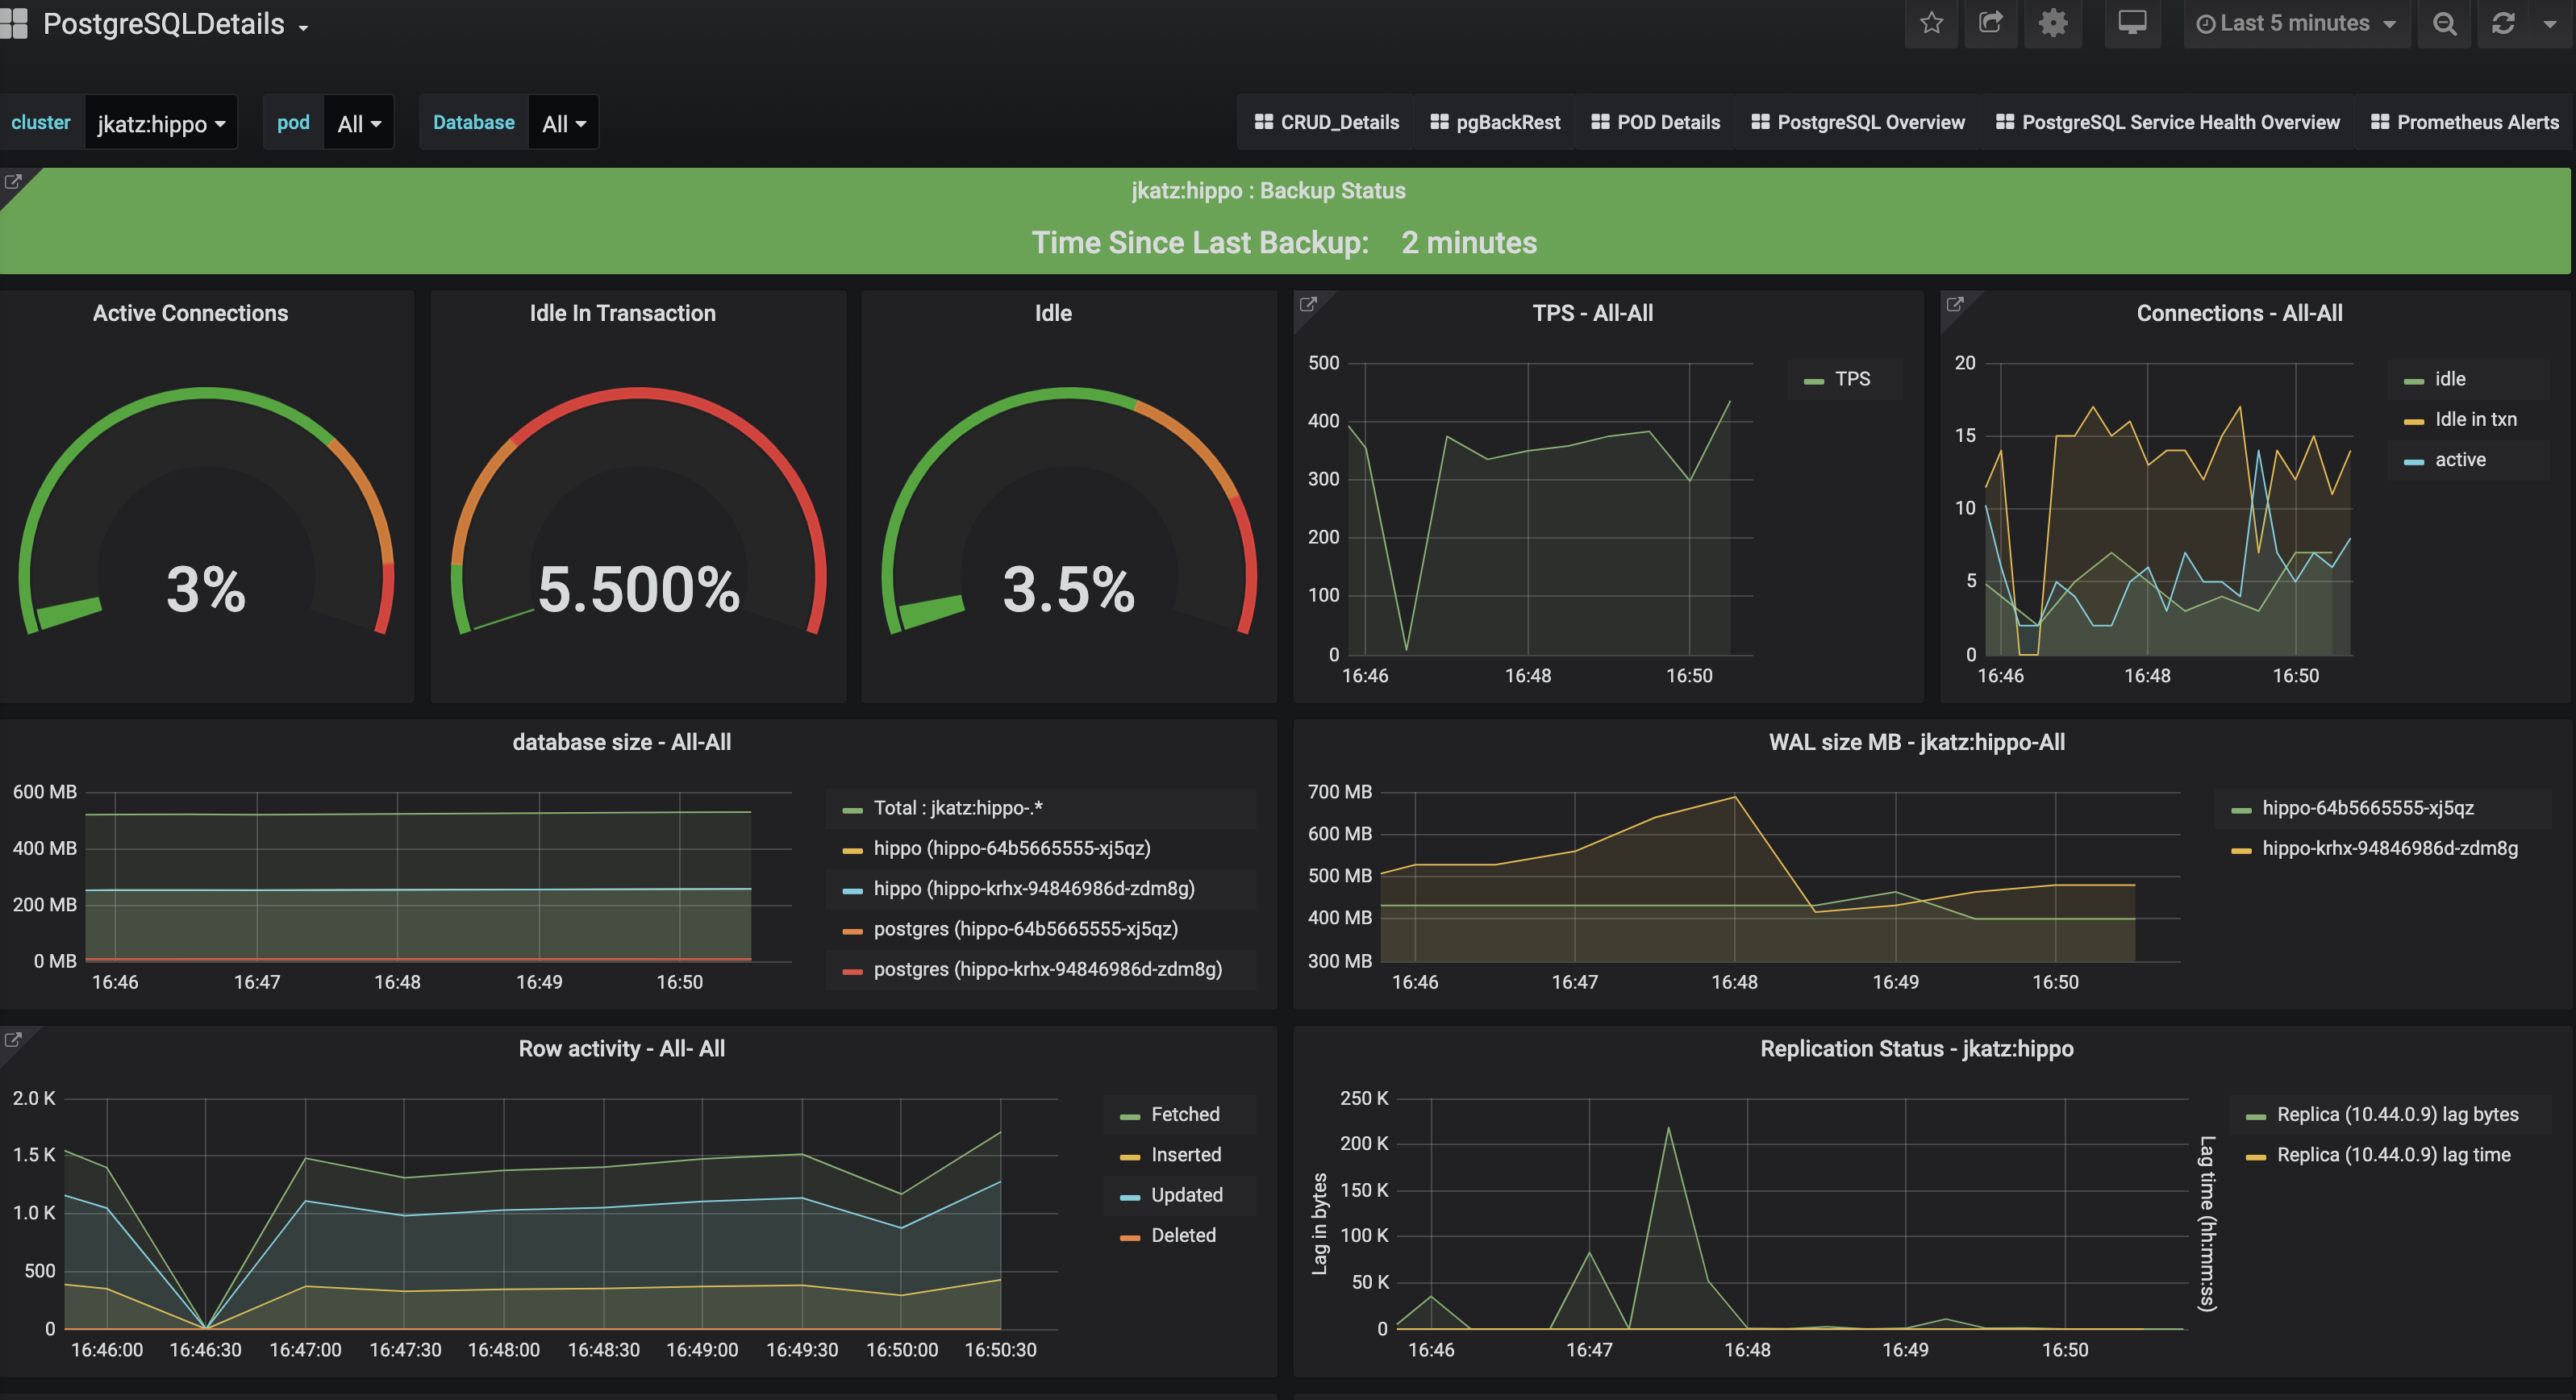
For these examples, we are using the monitoring stack powered by pgMonitor that can be installed alongside the Postgres Operator.
Connection Statistics
Total Connections
One of the required configuration parameters for PostgreSQL is max_connections: any connections beyond this number will cause the client connection to fail. This is the first fundamental reason why you need to monitor the number of connections to your database: too many connections may cause the appearance of downtime events in your application.
Too many connections can also have an impact on your overall performance of your PostgreSQL database. This is a well studied problem in Postgres, and in fact, PostgreSQL 14 will be receiving a huge performance boost in this area.
Looking at the total number of connections to your database can help you to optimize your application's system architecture and determine the right settings to maximize your throughput while limiting overhead.
Idle in Transaction
There is a bit more to the connection story, and this story involves connections that are "idle in transaction." A connection that is idle in transaction is where a transaction is in process (e.g. there was a BEGIN at some point) but has not yet been committed (COMMIT) or rolled back (ROLLBACK). If you have too many connections that are idle in transaction, you can end up causing overall performance issues for your system and potentially maintenance issues.
Connections that are idle in transaction can prevent proper vacuuming of your system, which in the fullness of time can lead to the dreaded transaction ID wraparound problem. If you see lingering connections that are idle in transaction, you should investigate the cause and do your best to eliminate them.
Transaction Rate
Transaction rate, whether it's measured in transactions per second (TPS) or transactions per minute (TPM), measures the overall throughput of your system. Usually, this metric by itself does not tell you much: transaction rate can vary based on time-of-day, day-of-week, etc. You can use transaction rate to help determine if there is a load spike, or couple it with another metric such as network throughput to determine if your performance is being affected.
Transaction rate can give you an overall sense of the entire performance of your database system, but needs to be combined either with another metric, or by using a time-over-time comparison.
Row Activity
Row activity can indicate the type of workload that you are managing, whether it's read heavy (SELECT), write-heavy (INSERT/UPDATE/DELETE), or balanced between the two. Knowing what type of workload, and in conjunction with other metrics, you can tune your database to maximize your application's performance.
For example, knowing the type of workload you have can help you tune when checkpoints should occur. During a checkpoint, all "dirty data" (data that was modified since the last checkpoint) is written to disk, which is a costly operation. Knowing the type of workload you have, coupled with your transaction rate, can help you select the appropriate checkpoint settings.
Disk Usage
It's quite simple: if PostgreSQL can't write to disk, you're going to have downtime. It's important to keep track of disk size, but it's also helpful to know which items are taking up disk.
It's good to keep an eye on your overall database size as that will indicate your overall data growth rate and when you may need to take additional steps, e.g. resizing your disk or moving your database to another instance.
Additionally, it's also good to keep track of how much your write-ahead logs (WAL) are taking up on disk. If you use replication slots, a sign that a replication slot is not being acknowledged, or is falling behind, is an increase in overall WAL log retention. If you run out of disk space due to too many WAL logs, your PostgreSQL instance will go down.
(Aside: PostgreSQL 13 introduced a feature to help mitigate this issue: max_slot_keep_wal_size).
It's as important to track how much disk your entire system is using as well as each of the individual components of your PostgreSQL system.
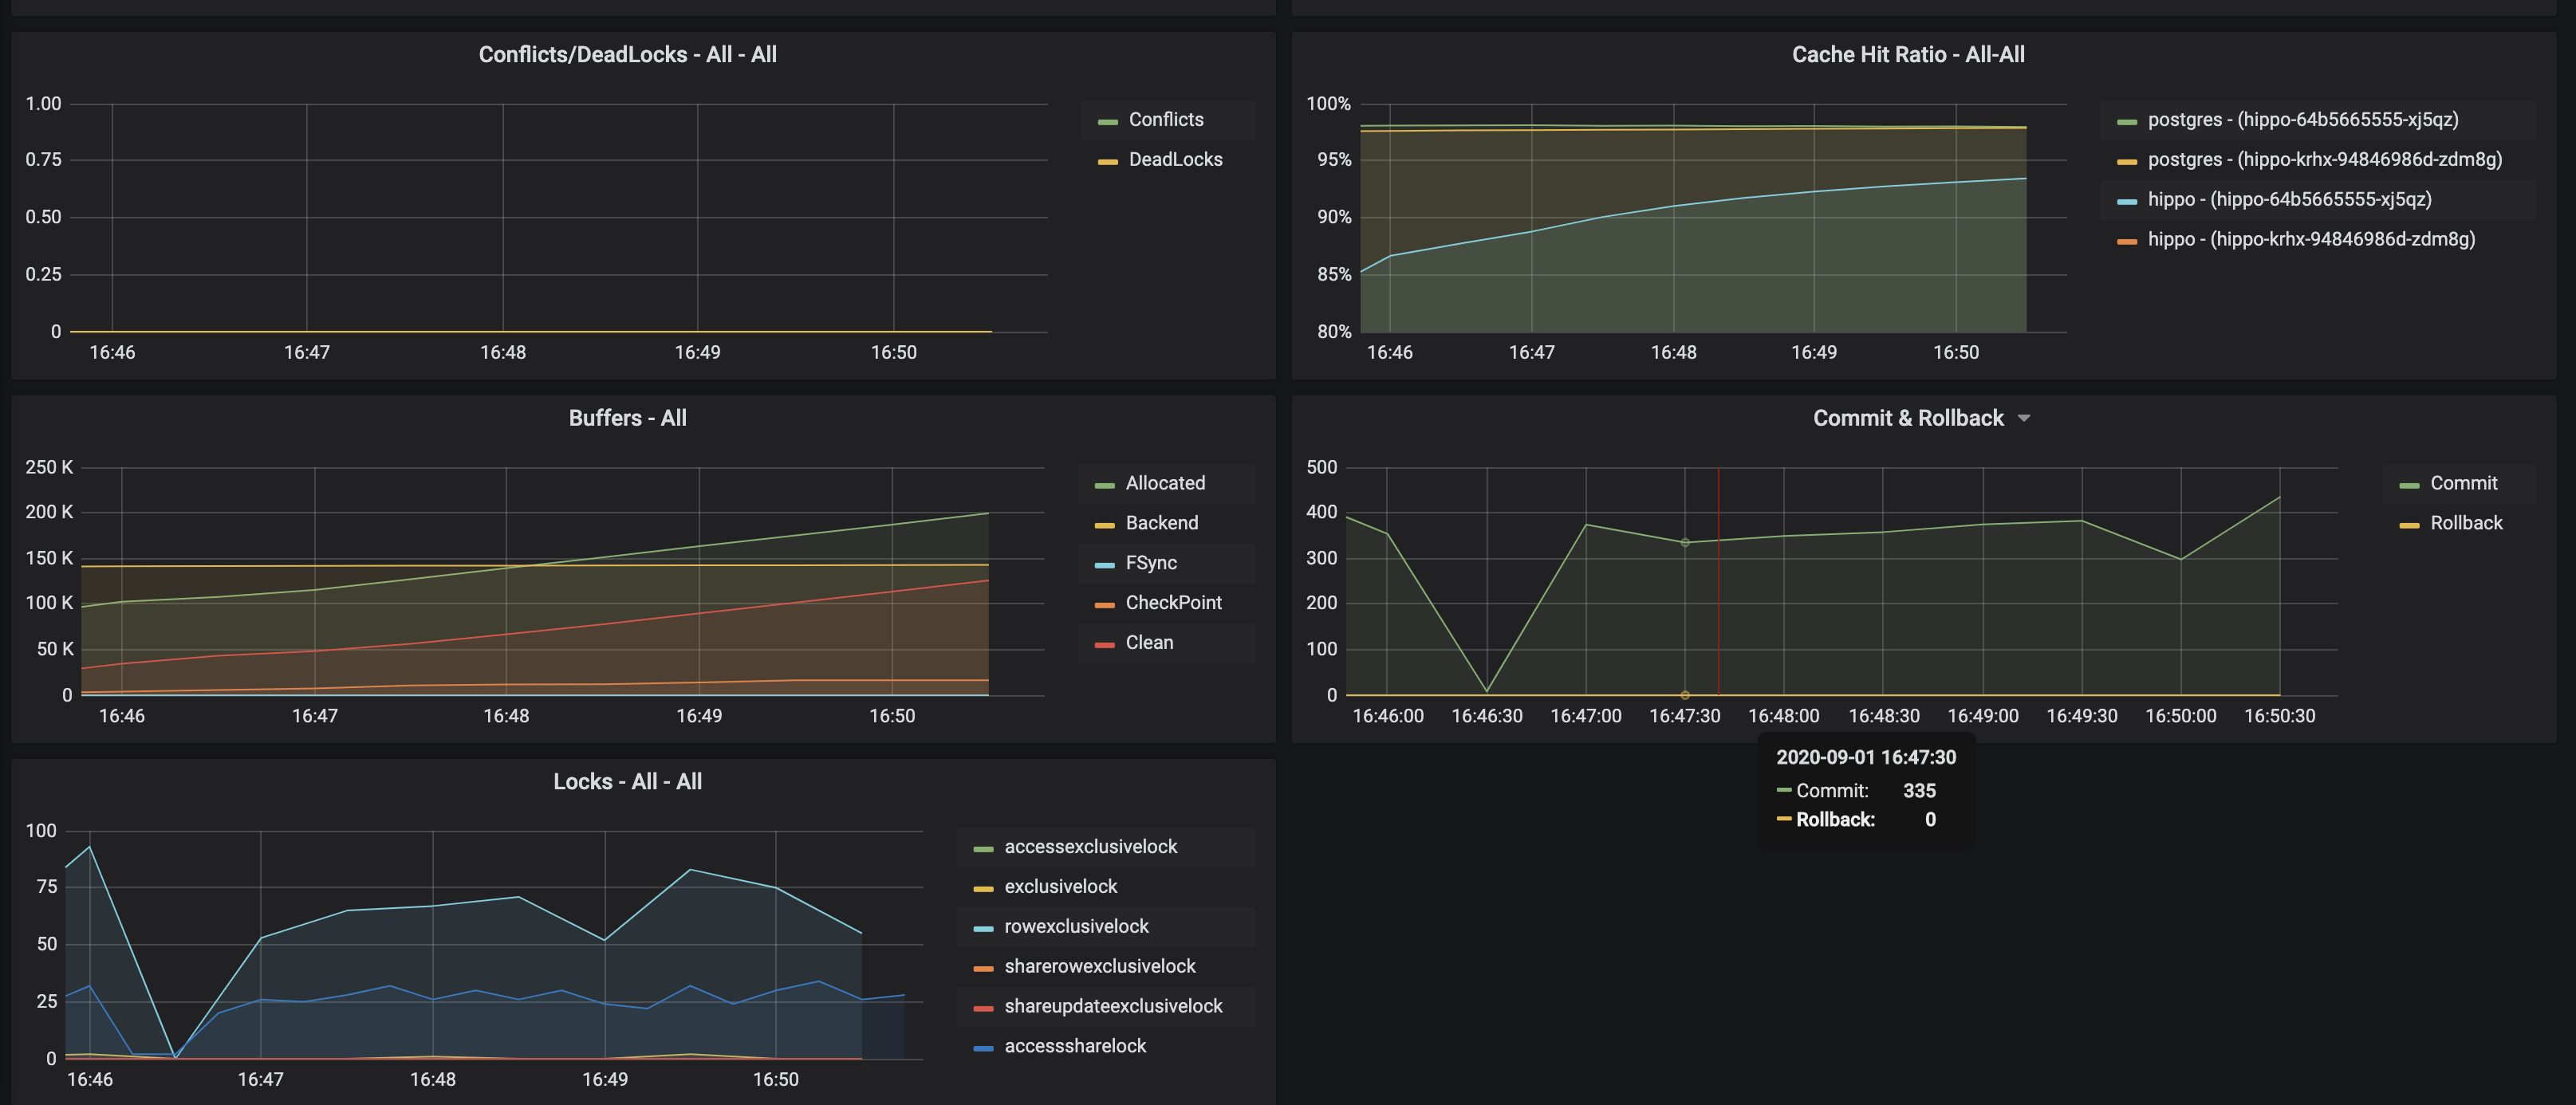
Cache Hit Ratio
I wish I understood cache hit ratio more earlier on in my career, as this is a great metric for being able to properly size and tune your PostgreSQL instance. Cache hit ratio is a measurement of how much of your "working data set" resides in memory. If you make a request for data that is not in memory, PostgreSQL will have to go and fetch it from disk, which is a much more costly operation. Your goal, then, is to try to have your cache hit ratio be as close to 100% as possible.
So, what is your "working data set?" Simply, your working data set is the data that your application is accessing over a given period of time. For example, let's say I have a simple scheduling application that only looks at appointments that are either today or in the future. Therefore, the maximum size of my working data set would be all scheduled items that are from today and into the future. My actually working data set is probably smaller: the application is more likely to access appoints that are closer to today rather than farther, so we can narrow our window down to that.
How can you help to improve your cache hit ratio? The simplest answer is more memory, combined with tuning the PostgreSQL shared_buffers setting. However, the longer answer is "it's complicated" and requires an understanding of your data workload in order to optimize your physical resources coupled with your PostgreSQL configuration (though shared_buffers plays a huge role in this). Additionally, after a restart, PostgreSQL will take some time to pull the working data set into memory, though you can use pg_prewarm to offset some of this burden.
Monitoring your cache hit ratio can help you to fundamentally tune your PostgreSQL database, understand what hardware resources you need, and help you to better understand your own application's access patterns.
Locks
Typically when I had to look at locks, it was because my application logs would suddenly fill up with one of two types of PostgreSQL errors: "could not acquire lock" or "deadlocked." I would then go and investigate the pg_locks table and try to look for any behavior that seemed off.
Locking is a natural part of PostgreSQL as it is one of the fundamental pieces of multi-version concurrency control (MVCC), so it is perfectly normal to have locks. The key bit is the above: ensuring that you can avoid errors due to locks. The most common locking error I would run into was "could not acquire lock," typically as my system was oversaturated at that point. I usually triggered deadlocks due to bad code (I admit it: I did write some very complex chained triggers, which would usually do the trick).
Locking issues can be tricky to diagnose, let alone fix, as they typically involve multiple sessions trying to do similar things at the same time. It's important to keep an eye on the overall locking behavior of your system to try to prevent lock contention from causing errors in your applications.
Replication Lag
I was so excited for the release of PostgreSQL 9.0 and its support for streaming replication! After getting it deployed to a staging environment, I inadvertently taught myself a lesson about replication lag (and also WAL recycling).
In short, replication lag is the amount of time it would take for a replica, or a copy of your database, to be up-to-date with the primary. Typically, you want this value to be small: if there is a scenario that causes a primary to be unavailable, you want to cut over to a replica with as little data loss as possible.
(If you're sensitive to data loss, you might consider synchronous replication though that also comes with tradeoffs).
There are a variety of reasons why a replica could lag too far behind a primary: network saturation, computing power on the replica, the replica went away and has not reconnected, etc. Part of having a healthy Postgres cluster is ensuring that your replicas don't lag too far behind your primary!
Backups
I would be remiss if I didn't get a word in about backups. In almost every presentation I give, I try to sneak in a word about the importance of taking regular backups of your database with a backup management tool like pgBackRest. If your system has not completed a backup successfully within the period you subscribed, you should definitely fix that. Not only are backups critical in the event of a disaster, they can be used to help efficiently bootstrap other clusters.
Anyway, if you run anything in production, please backup that system.
Conclusion
There are many different monitoring metrics that you can use to help ensure your PostgreSQL system stays healthy. For me, I tended to start with looking at my system's CPU, memory, disk, and network utilization to provide a starting point before I began troubleshooting further. As I went to more Postgres events and learned more about how people way more experienced than me at systems and database administration described what they looked for, I expanded my toolkit to track and analyze many of the metrics I discussed in the above.
If you're running PostgreSQL on Kubernetes, or even thinking about it, I encourage you to setup Postgres monitoring in your environment, give it a whirl, and see what patterns you can develop in troubleshooting!
This article is part of a series:
