Over just a few years, Kubernetes has taken the computing world by storm, so many software developers know and use it on a daily basis. However, because it is still relatively new, there are many more who are just getting started. In my recent (and ongoing) journey towards Kubernetes enlightenment, the first thing that struck me was that there are a lot of moving parts. Not by itself, perhaps, but Kubernetes is not used in isolation. It is a container orchestration system. That means you are going to have containers, you are going to put your things in those containers, and you are going to connect your things to other, third-party things. So, in short order, you have, well, a lot of things.
There’s buried treasure: Where do you start digging?
The world begins, of course, with kubectl, the command-line interface to Kubernetes. The commands you start using early on help you examine your Kubernetes resources.
|
1 |
kubectl get . . . |
With that command, you can examine your deployments, which rollout your replica sets, which create pods. Then you need services, which are logical sets of pods that provide an interface for external access. What can you examine with kubectl get ?
Use kubectl api-resources to see the list. At the time of this writing, there are 66 different resource types! That number will likely only grow over time. Here is a partial list of them:
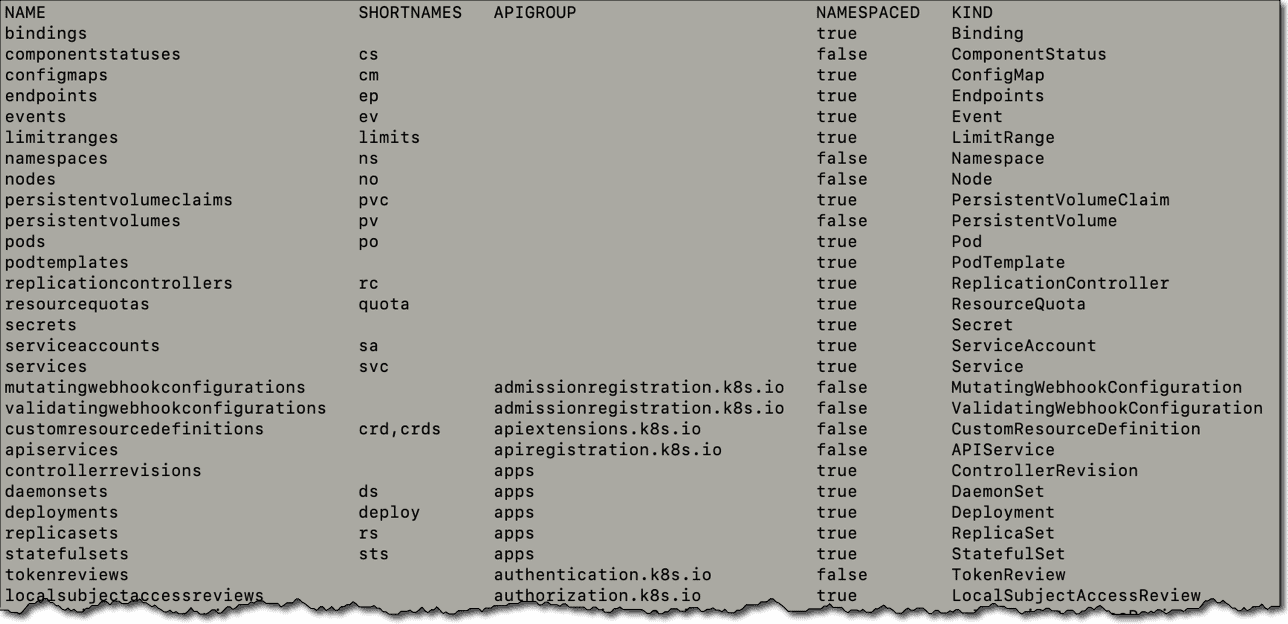
So where do you even begin to look for interesting things? Well, I have already mentioned some key players: pods, replica sets, and deployments. Do not take my word for it; instead, ask Kubernetes to show the interesting things:
|
1 2 |
kubectl -n YOUR_NAMESPACE get \ $(kubectl api-resources --verbs=list --namespaced -o name | paste -s -d, -) |
Let’s break that down:
The inner kubectl command is just asking for all the api-resources, as mentioned above. It’s filtering that just a bit to those resources that support listing (--verbs=list) and to those resources that are namespaced (i.e. specific to a namespace rather than global). Finally, -o name is asking for the output to be the list of those resource names, rather than the usual multi-field output.
You pipe that into paste in order to massage it into a comma-separated list.
That list is then fed to the outer kubectl along with your namespace, to give you a customized list of interesting things. My cluster is not too complicated, so I get most everything on one screenful:
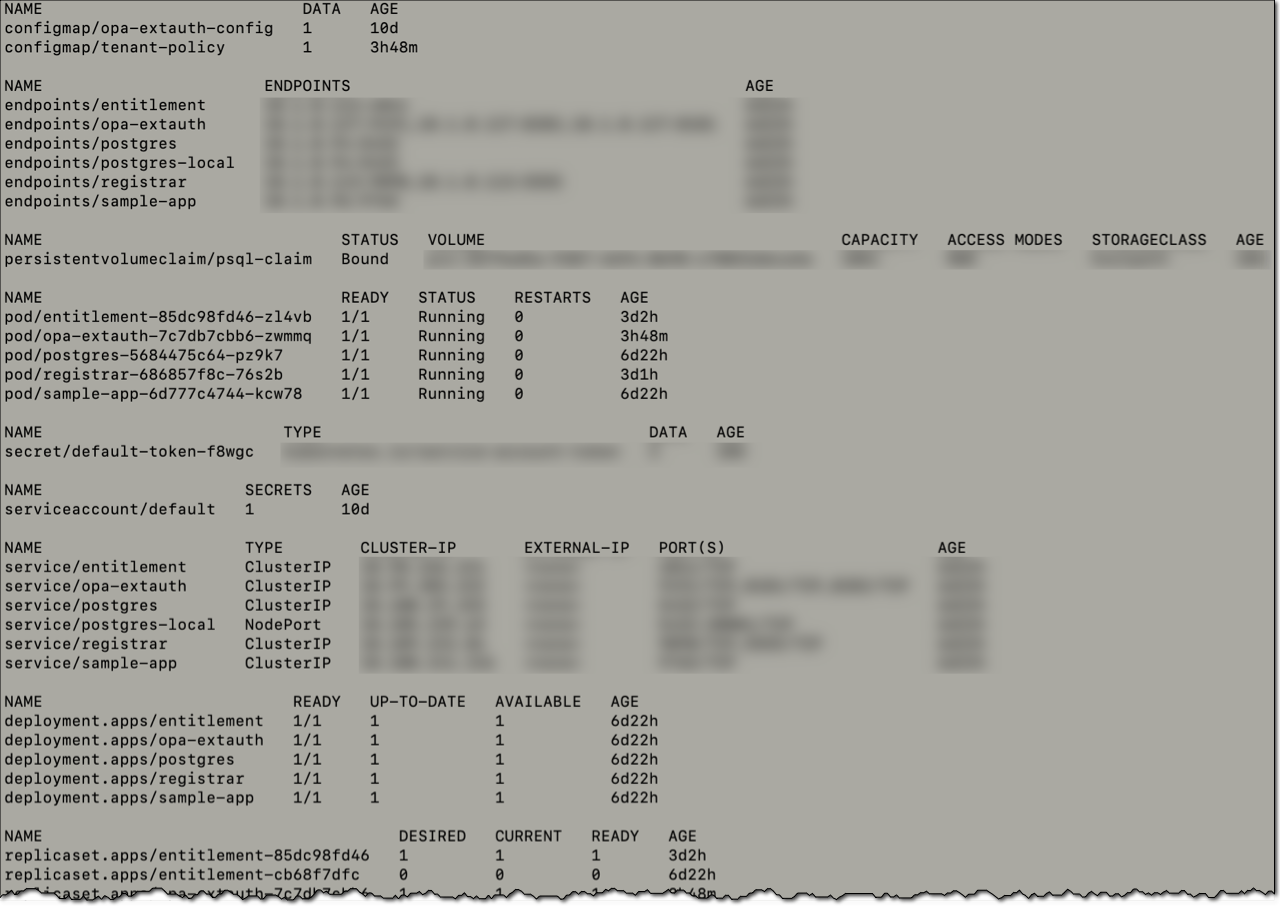
A snapshot like that really helps when you have something not working quite right, and you have the daunting task of figuring out what. If you are fortunate, you might see something right off; perhaps the desired replica count does not equal the actual, so you have some idea where to start looking. If not, it is helpful to be able to dig further. You can do that individually with kubectl describe, but I find it immensely more productive to have a GUI that helps with that.
Bring in the GUIs
If you don’t want to spend all your time in code, you can also explore these interfaces.
Kubernetes built-in dashboard
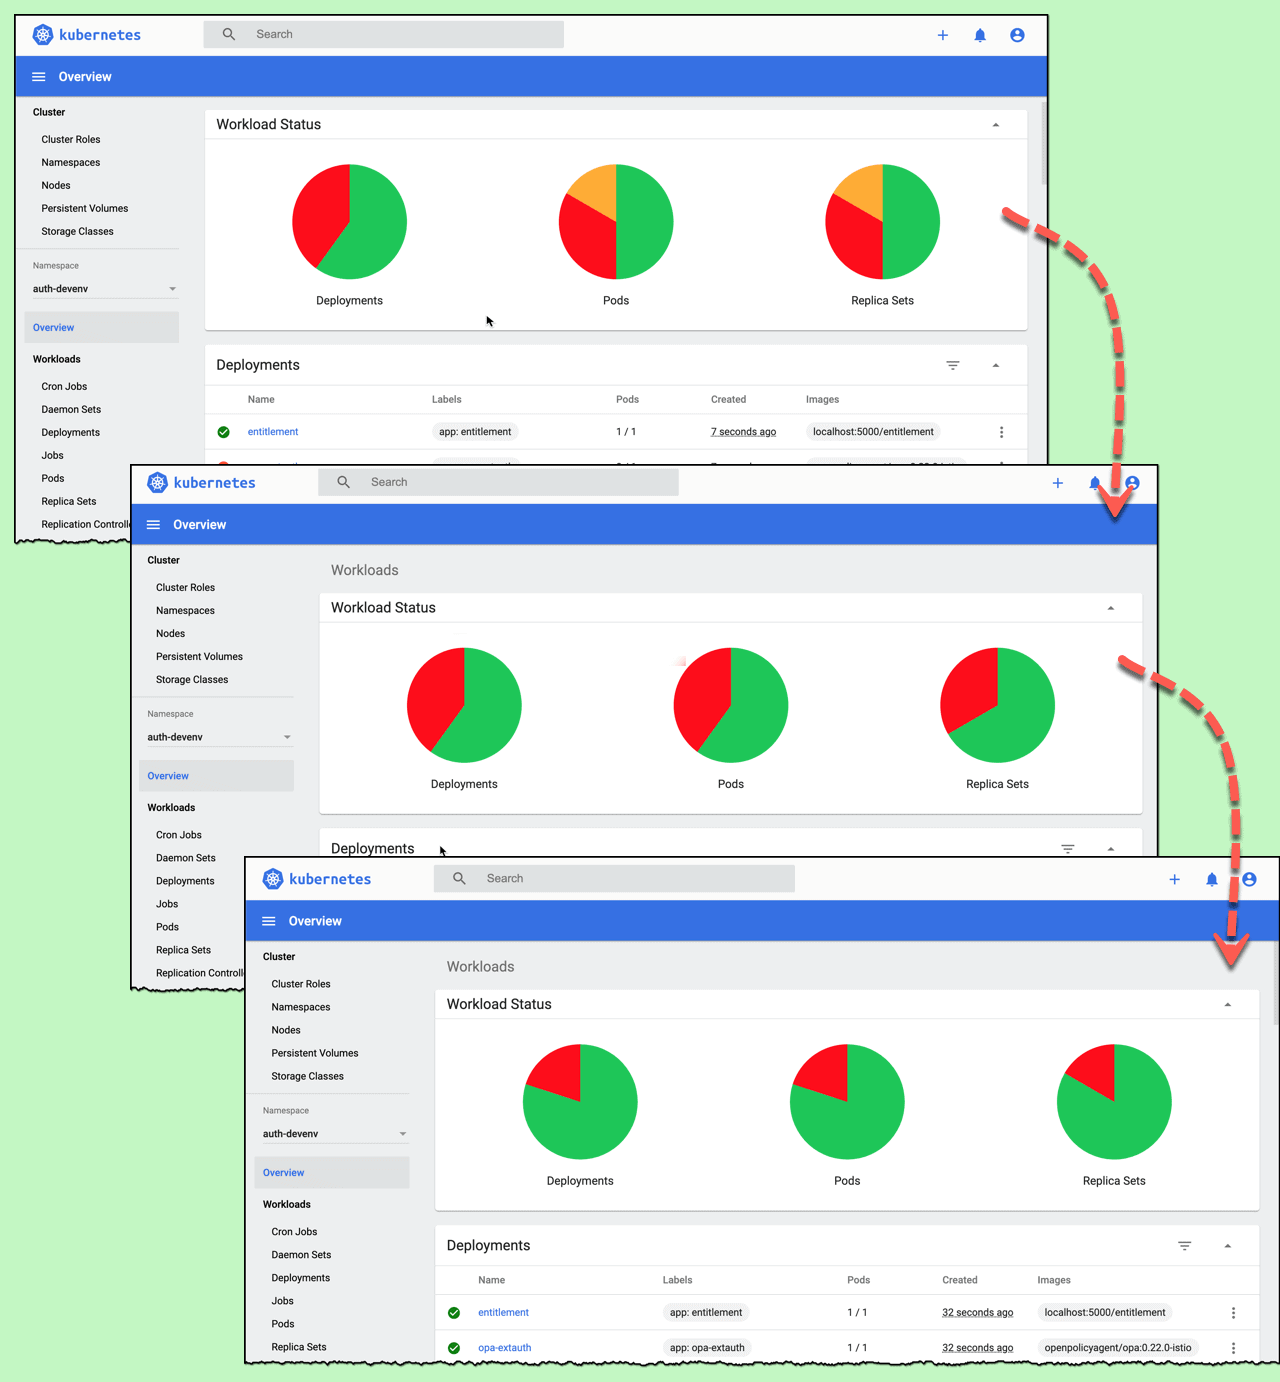
I first found that Kubernetes itself provides a dashboard. That shows you in real-time what is happening in your cluster. Here, for example, you see successive screenshots, a few seconds apart, as my cluster was stood up (and had not quite finished in the last screenshot).
You have to do just a bit of work to set this up.
Step 1: Deploy the dashboard
|
1 |
kubectl apply -f https://raw.githubusercontent.com/Kubernetes/dashboard/v2.0.0/aio/deploy/recommended.yaml |
Reference: https://Kubernetes.io/docs/tasks/access-application-cluster/web-ui-dashboard/#deploying-the-dashboard-ui
Step 2: Expose the URL
This next command does the necessary magic to expose the URL you will use in step 5 to access the dashboard. This command remains running until you terminate it, so you either need to run it in a separate window or add an ampersand (&) to the end to run it in the background (assuming a Linux environment).
|
1 |
kubectl proxy |
Step 3: Setup an admin user to access your dashboard
You need to create a dashboard.yaml file like this, filling in your admin name.
|
1 2 3 4 5 6 7 8 9 10 11 12 13 14 15 16 17 18 |
apiVersion: v1 kind: ServiceAccount metadata: name: YOUR_ADMIN_NAME namespace: kubernetes-dashboard --- apiVersion: rbac.authorization.k8s.io/v1 kind: ClusterRoleBinding metadata: name: chef-cloud-admin roleRef: apiGroup: rbac.authorization.k8s.io kind: ClusterRole name: cluster-admin subjects: - kind: ServiceAccount name: chef-cloud-admin namespace: Kubernetes-dashboard |
Then deploy that with kubectl apply -f dashboard.yaml
Reference: https://github.com/Kubernetes/dashboard/blob/master/docs/user/access-control/creating-sample-user.md
Step 4: Extract your admin user token and use that to login
You will need to install the JSON processor jq for this:
|
1 2 |
kubectl -n Kubernetes-dashboard get secret -o json \ | jq -r '.items[] | select(.metadata.name | contains("YOUR_ADMIN_NAME")).data.token | @base64d' |
Step 5: Open the dashboard in your browser
Navigate to this URL and login with that token obtained above:
http://localhost:8001/api/v1/namespaces/Kubernetes-dashboard/services/https:Kubernetes-dashboard:/proxy
K9s
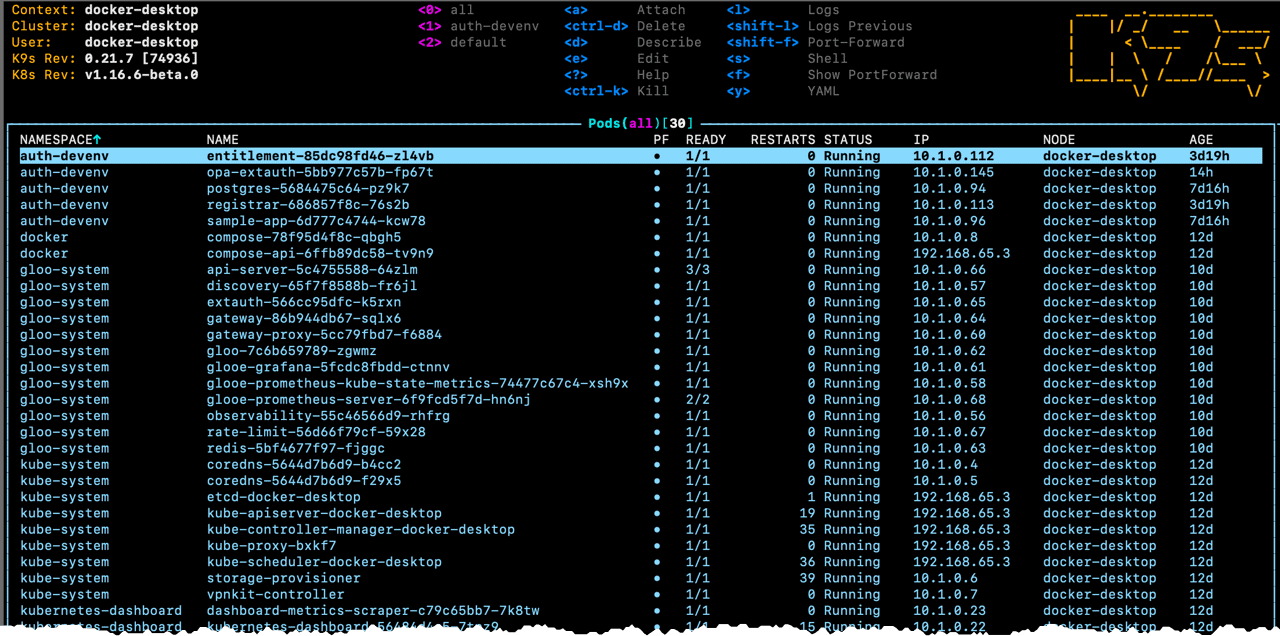
At first glance, k9s looks, well, antiquated. The first hint may be the curses style look–that is, it is a text-based GUI that runs in your terminal. But k9s is great; it provides a lightweight, responsive, concise monitor of your cluster. The header shows some basic info. Here you can see I am running Kubernetes via Docker Desktop on my Mac. It also shows some of the most common command keys; you can get a full list of commands by pressing a question mark (?).
The main body of this home page shows all pods in all namespaces by default–you can even see the pods for the Kubernetes dashboard (discussed earlier) at the very bottom.
From the list of pods, you use vi-like controls (or arrows if you prefer) to select your pod of interest, press enter to drill down to the containers, select one container, and press enter again to drill down to its logs. Keyboard commands make navigating around and exploring your cluster very snappy.
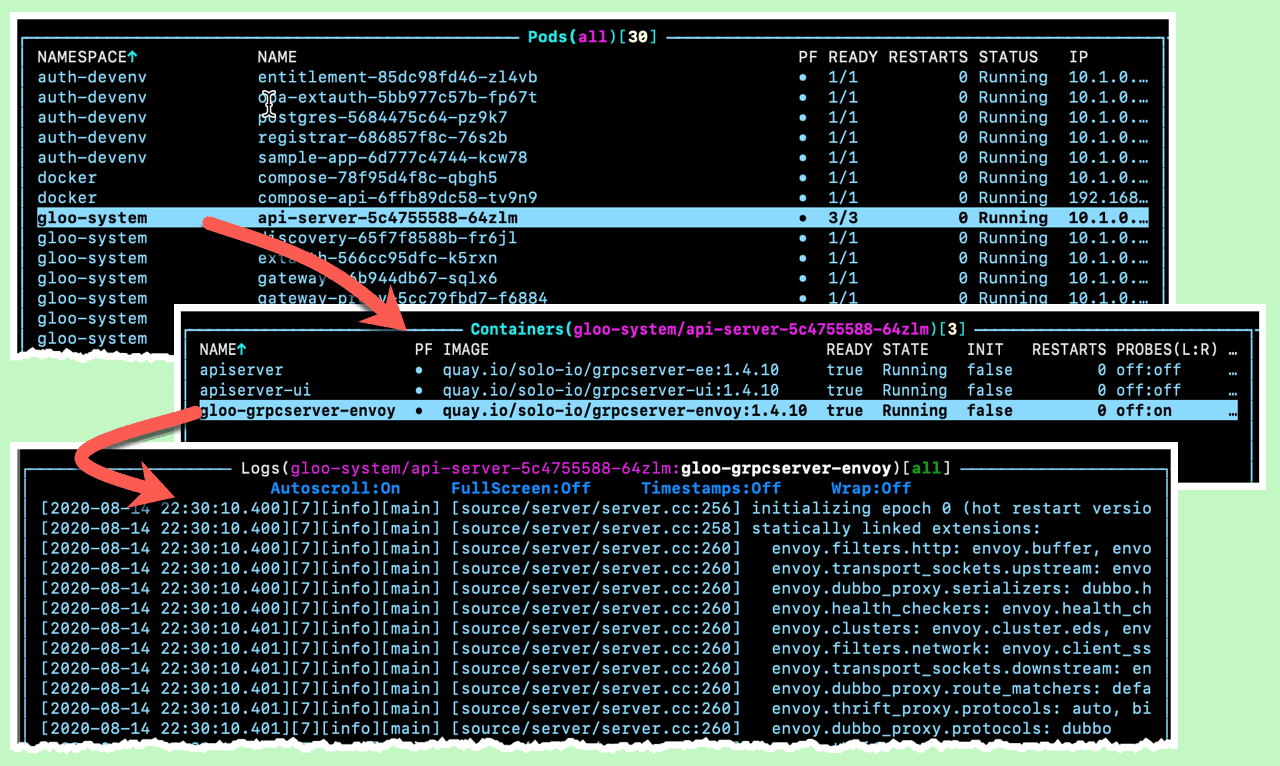
Prefer to dig around your container yourself? Select it from the container list and just press “s” to open a shell to that container!
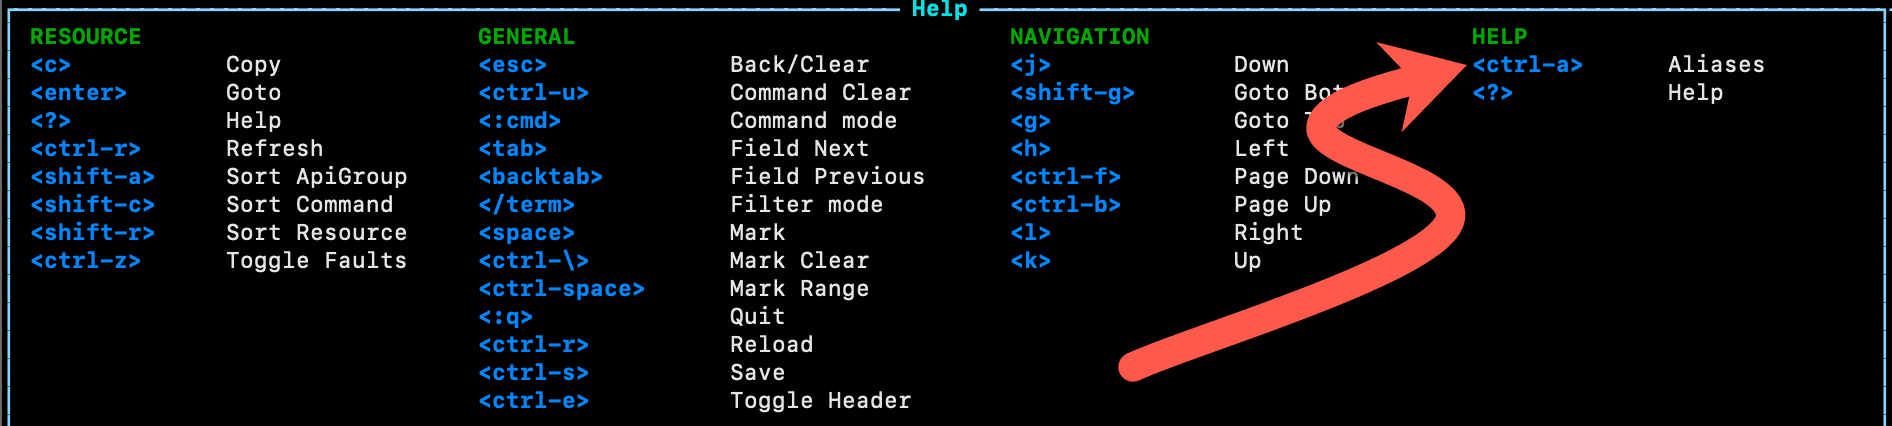
I am impressed with the tight, easy interface of k9s, but I only achieved this karmic delight after figuring out some essential things omitted in the documentation. Remember the list of all api-resources you could generate with kubectl? The first key fact is that k9s gives that to you with a single keystroke, Ctrl + A. Surely that must be documented, you wonder? Well, yes, it is documented by this obscure reference to “aliases”:
When you invoke that keystroke you get this familiar-looking list:
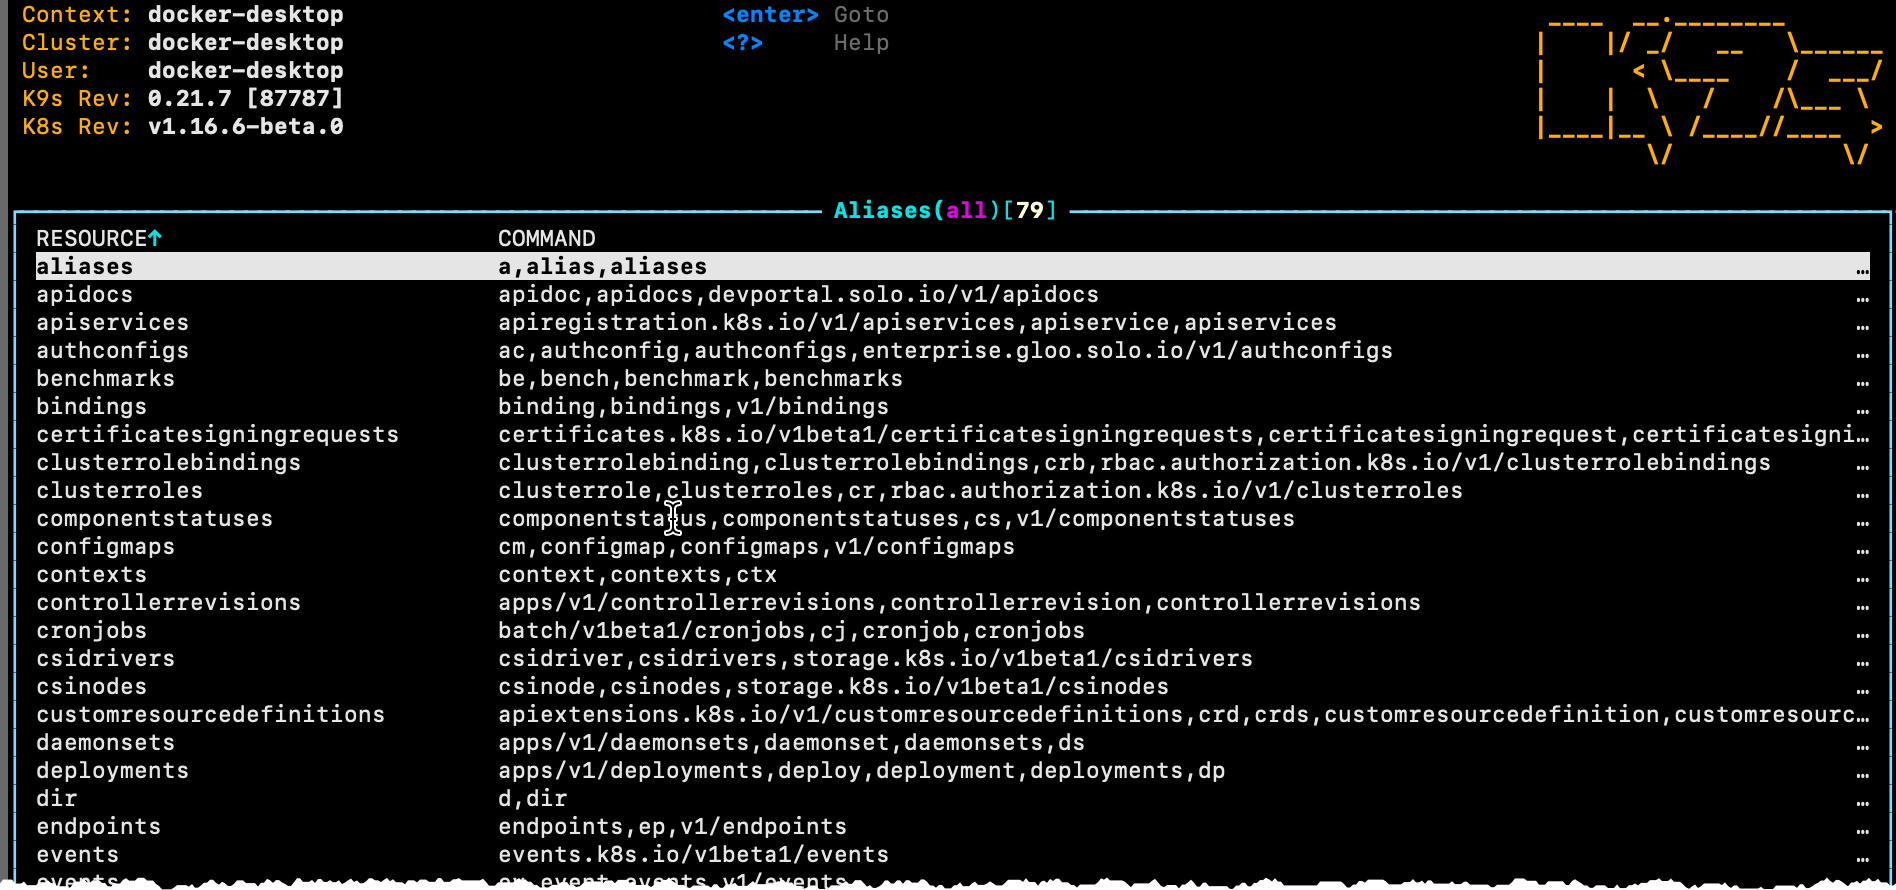
While that might seem anticlimactic, it is actually a big deal, because that is the key to navigating to all-the-things within k9s. As a first exposure, k9s launches with a pod view, and as I showed above, you could drill down (by highlighting then pressing enter) to containers, then again to logs. And you could traverse upward by pressing Escape once or twice. While nice, surely there must be more than that, I thought.
The second key fact is that k9s has a command mode. Like vi, just press colon (:). You can, in fact, see that listed in the help view above, the third entry down in the second column, General.
But what are the commands? That is the third key, undocumented fact: any resource from the list of aliases. Want to see endpoints? Type :ep. (Not the period; that’s just the end of the sentence!) Want to see configmaps? Type :cm. How do you go back to pods? Just type :pods.
Lens
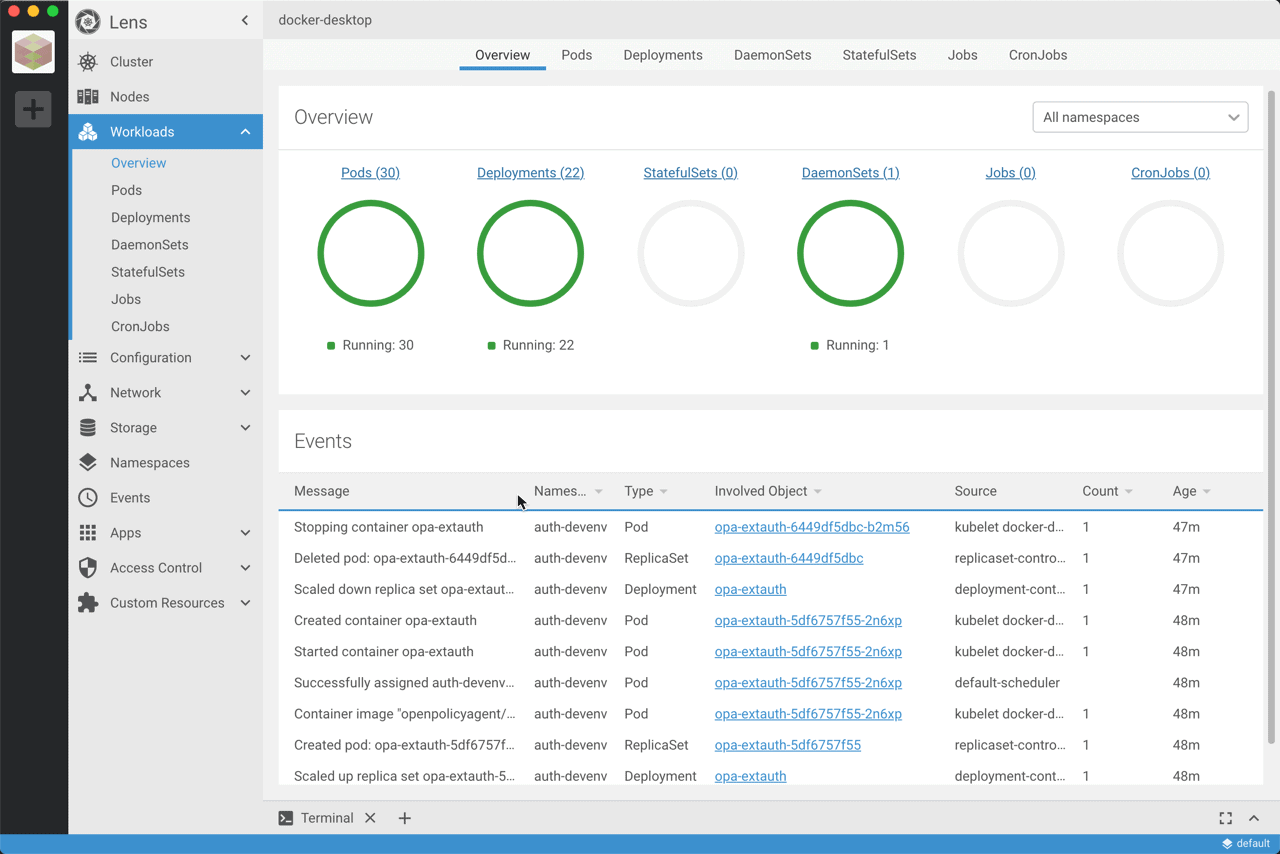
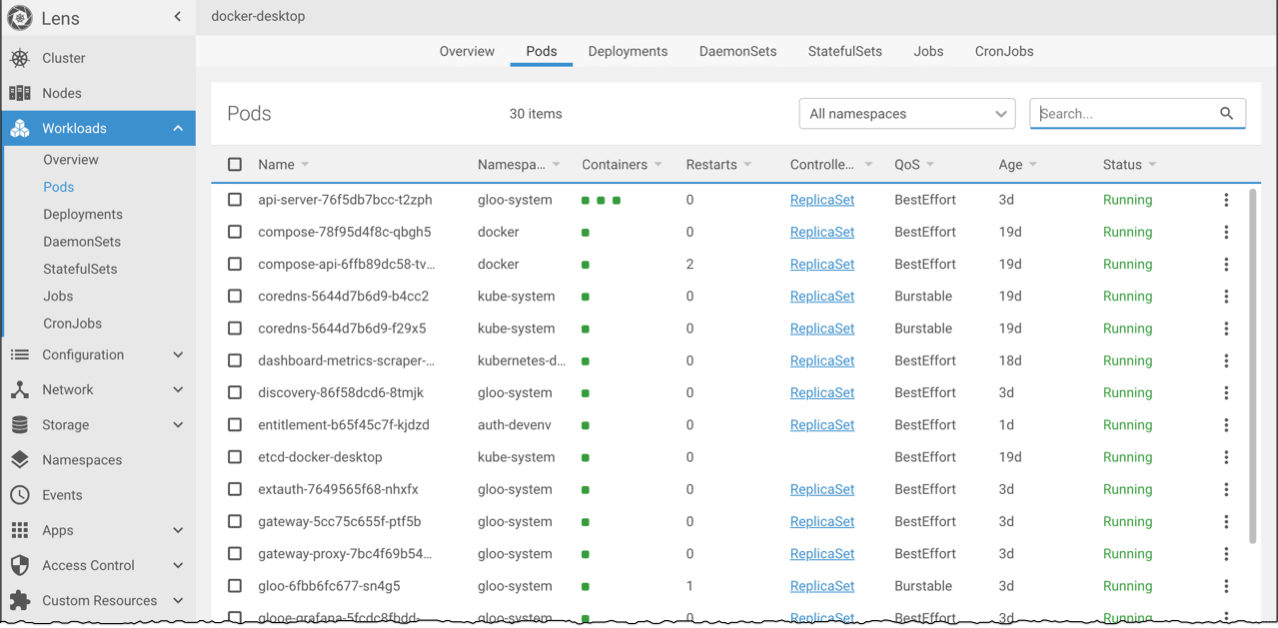
Prefer more graphical user interfaces (like the dashboard) but still like the richness of information (like k9s)? Take a look at Lens as another alternative. Here’s the overview page, showing a summary of resources plus the latest events. In the left navigation pane, you can see the selection of resources available to view.
Here is the pod view, which is very similar to k9s, but with a few different columns. For example, you can see at a glance how many containers are in the pod. But Lens does not show the number of replicas currently running, as k9s does.
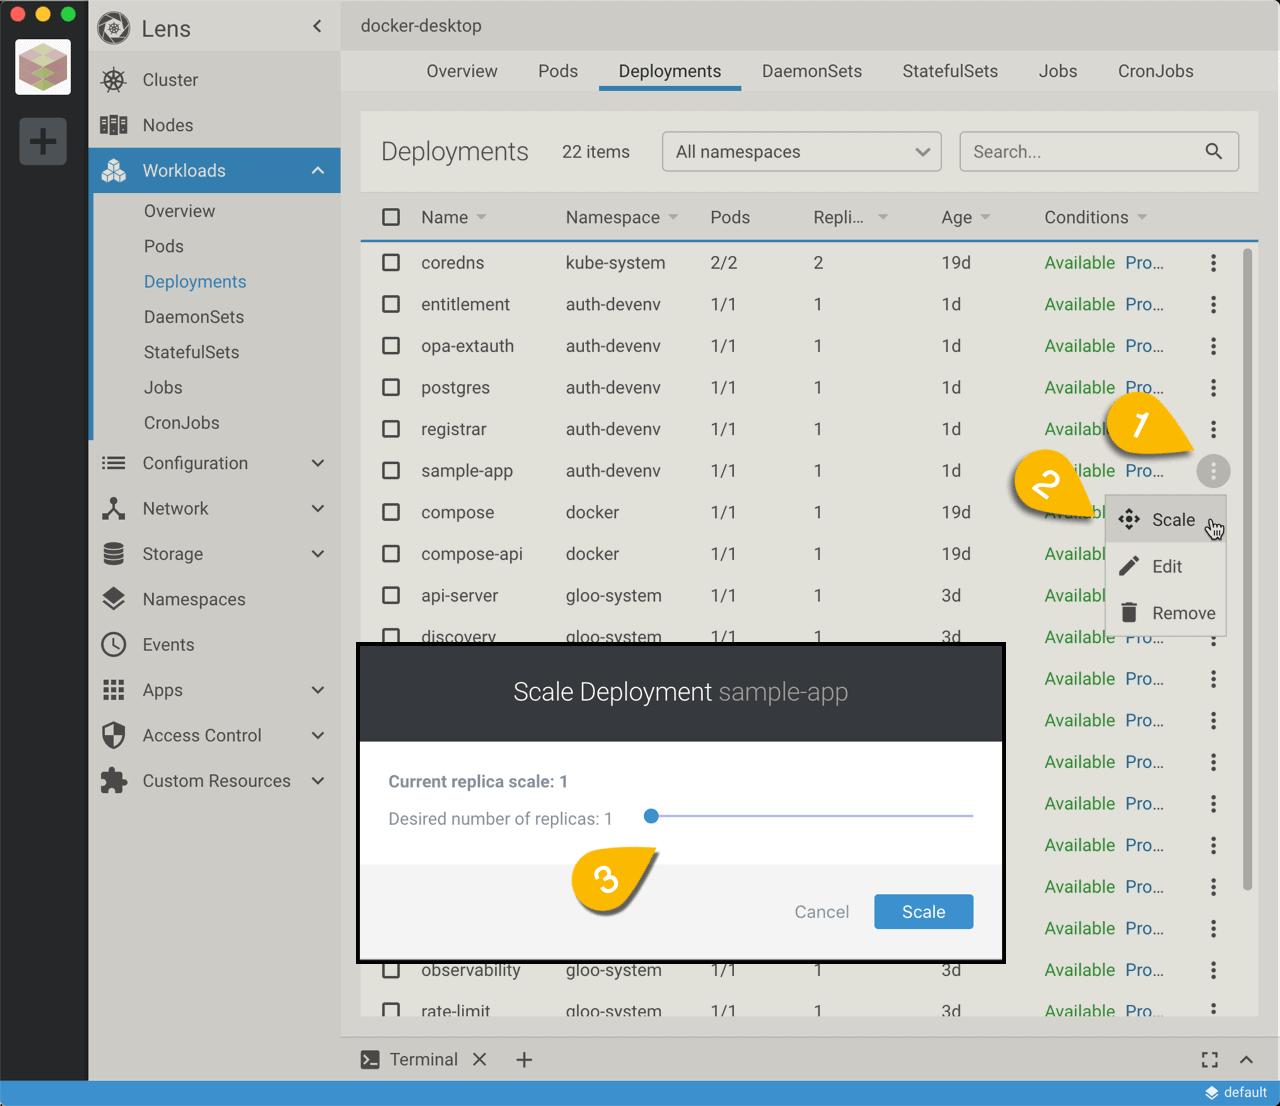
One very convenient feature about replicas, though, is available in the deployment view. Opening the control menu for a given deployment, you can select the “Scale” option, and then adjust your desired replica count with the slider!
One thing that Lens revealed to me (because you have to pick your cluster upon startup): it found two clusters on my development box: docker-desktop and docker-for-desktop. (You can also see both from kubectl config get-contexts.) Two different cluster names, yes, but they both point to the same actual cluster! It turns out that it was an artifact introduced a few months ago by Docker because they decided a name change was in order. They chose to leave the legacy docker-for-desktop in place so as not to break user scripts that might rely on it. However, due to feedback on the issue (https://github.com/docker/for-mac/issues/4089) they have fixed it (removed it) as of the latest Edge release 2.3.2.0 (at the time of writing).
Stern
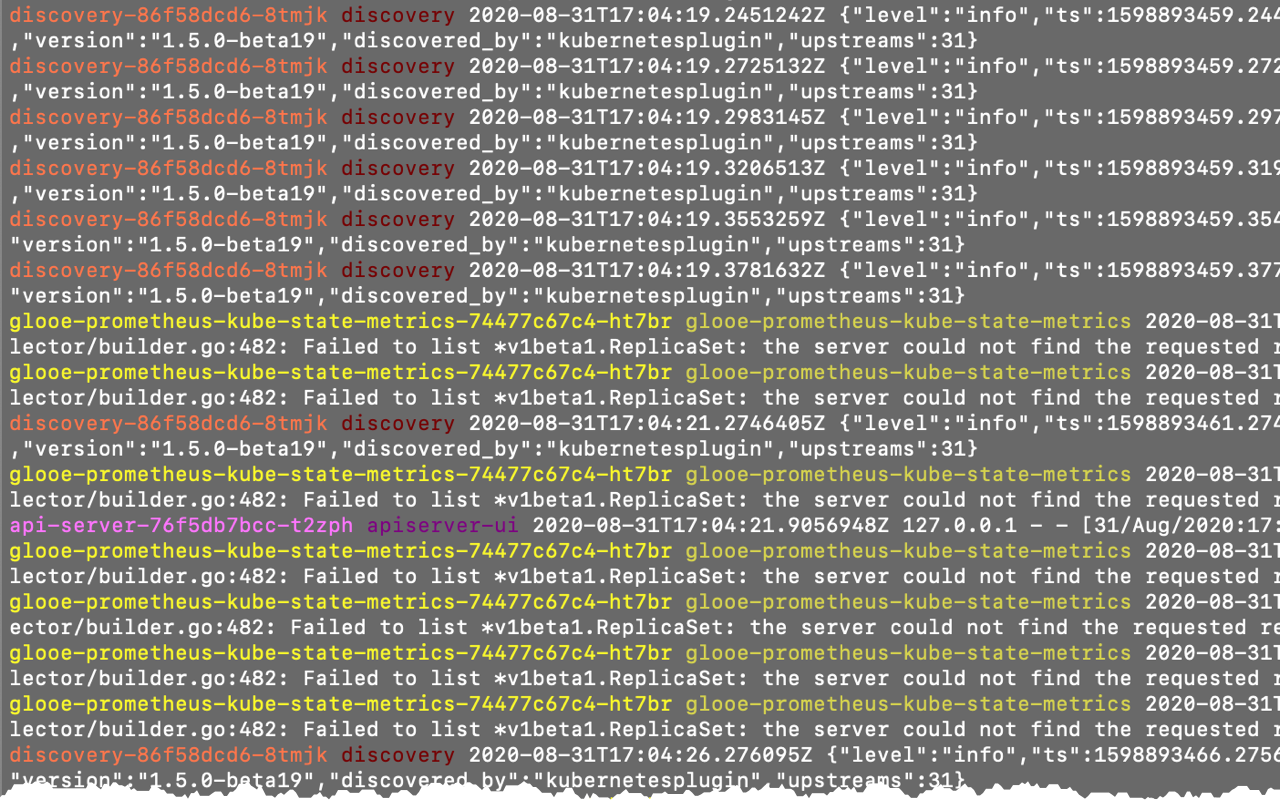
There is one more piece of crucial tooling for me that none of the previous tools can offer: when I am trying to diagnose a failure during development, I usually pore over the logs. It is tedious to have to do that one log at a time, particularly when you do not have a notion of where to start looking. The good folks at Wercker have a multi-log viewing tool called stern that lets you tail all the logs you might want. For example, with this command, I am asking to see the latest entries in real-time from the “gloo-system” namespace (-n gloo-system), except for any message that is involved in health checks (-e health), going back only as far as one minute ago (--since 1m). You can also filter by the content of messages, too, with regular expressions. I have just given a single dot as the final argument, meaning any character–in other words, unfiltered by message.
|
1 |
stern -n gloo-system -t -e health --since 1m . |
Here is a partial output when I exercised my API. Stern color codes each pod name so you can see three different pods have reported new log messages here.
Summary
This article just scratches the surface of what one can do to check the pulse of your Kubernetes installation. These tools have been invaluable to me as I have been learning to understand the state of my k8s world and to diagnose issues with it. There are likely many more useful tools out there; please post a comment to share your favorites!
Load comments