Render diagrams on the fly in your Blazor apps
October 1, 2020 · 2 minute read · Tags: blazor | javascript
Nothing beats a good diagram!
If you’ve ever tried to describe your software’s architecture using just words you know the power of an effective visual.
But what if you want to define that diagram using a simple text based language, then render it in your Blazor app?
Turns out you can, using something called GraphViz and a teeny tiny bit of javascript interop.
First you’ll need to reference a few JS scripts in your index.html file (if using Blazor WASM).
<script src="//d3js.org/d3.v5.min.js"></script>
<script src="https://unpkg.com/@hpcc-js/wasm@0.3.11/dist/index.min.js"></script>
<script src="https://unpkg.com/d3-graphviz@3.1.0/build/d3-graphviz.js"></script>
Then you’ll need to write a tiny bit of javascript code.
wwwroot\diagrams.js
export async function renderDot(model, element) {

    var graphviz = d3.select(element)
        .graphviz();

    graphviz.renderDot(model);
}
The latest version of .NET 5 makes it possible to import javascript modules like this one, so over in a Blazor component you can do something like this…
Markup
@inject IJSRuntime JsRuntime

<div @ref="_renderTo"></div>
Code
@code {
    private ElementReference _renderTo;

    protected override async Task OnInitializedAsync()
    {
        var diagramModule = await JsRuntime
            .InvokeAsync<IJSObjectReference>("import", "/diagrams.js");

        var diagram = "digraph { HelloWorld }";

        await diagramModule.InvokeVoidAsync("renderDot", diagram, _renderTo);
    }
}
This imports our diagrams.js javascript. We’re then able to call the renderDot method, passing in the following:
- The “markup” for a diagram written using DOT language
- A reference to the
divwhere we want the diagram to be rendered
That’s all there is to it. Run this now and you should see an SVG of your diagram, rendered right there in your Blazor component!
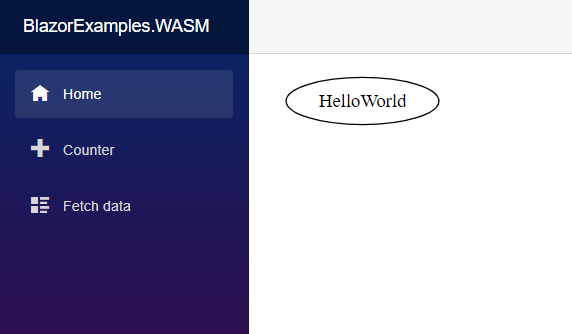
Now admittedly this graph is not all that impressive, but from here you can create all sorts of things…
Here’s a slightly more involved example.

And here’s the DOT code for it…
digraph Layerz {

graph [fontsize=8 fontname="Verdana"]
ranksep = "1.4 equally";

node [style=filled shape=record fontsize=8 fontname="Verdana"]

    subgraph cluster_1 {
        label = "UI"
        bgcolor = "#d79fd7"

       subgraph cluster_2 {
            bgcolor = "white"
            label = "User Controller"

            ListAll
       }
    }

    subgraph cluster_3 {
        label = "Business Logic"
        bgcolor = "#b2e3b0"

       subgraph cluster_4 {
            bgcolor = "white"
            label = "User Service"

            List
       }
    }

    ListAll -> List
}
Happy graphing!
For more examples check out the GraphViz web site.
If you want to play around with your own DOT diagrams you can give it a whirl in the online editor here.