Getting pregnant is a topic that’s not openly discussed and verges on taboo. Because of this, I worry that many lack a good mental model of what this process looks like and underestimate the difficulty of a successful pregnancy. Sex ed encourages the belief that getting pregnant is easy, and that every precaution must be taken to prevent unplanned pregnancies. The opposite risk, the risk of involuntary childlessness, is not discussed. As couples delay the age at which they have their first child (archived link), many may unintentionally delay until it’s too late. And it’s not just couples who face this risk. Many individuals are delaying marriage (archived link). While one needn’t be married to have children, I imagine not being married makes it more difficult. Those who wish to have children with a partner may want to account for the length of time it takes to make a baby when prioritizing long term relationships.
In this article I calculate the average time it takes to make a baby, and how this changes as we age. I hope this information will be helpful to other couples and individuals trying to plan their lives.
How are babies made?
First a quick primer on getting pregnant. Approximately two weeks after menstruation begins, the ovaries release an egg. This is called ovulation. To fertilize this egg, the sperm must meet the egg as it travels down the fallopian tube. This fertile window is limited which means sex must occur between ovulation and five days before it. Timing this right doesn’t guarantee pregnancy, but it gives you between a 10% and 30% shot at getting pregnant. Once the egg is fertilized it implants in the uterus where the embryo continues to develop.
For the pregnancy to be successful, the embryo must develop over the course of approximately 40 weeks. During this period, the pregnancy can spontaneously terminate for a variety of reasons. The chance of this is highest during the first trimester, and drops dramatically after this period. If the pregnancy terminates during the first trimester, it’s called a miscarriage. If it happens after, it’s called a stillbirth. Miscarriages are common and affect around 15% of known pregnancies. A much higher percent likely occur before the mother even knows she is pregnant.
How hard is it to get pregnant?
The first step to getting pregnant is conceiving. How difficult is this? It’s easiest in your 20s, starts to get harder in your 30s, and becomes impossible around age 45.1 This is a pattern we’ll see over and over again.
The probability of conceiving is captured by the chance of pregnancy after one year of trying. The table below presents this probability as determined by three different studies.
| Age | Impact of female age and nulligravidity on fecundity in an older reproductive age cohort (2016) | Female fecundity as a function of age: results of artificial insemination in 2193 nulliparous women with azoospermic husbands (1982) | Volitional Determinants and Age-related Decline in Fecundability: A General Population Prospective Cohort Study in Denmark (2013) | Average |
|---|---|---|---|---|
| 26-30 | 74.1% | 87% | 80.6% | |
| 31-35 | 85% | 61.5% | 90% | 78.8% |
| 36-40 | 73.5% | 55.8% | 75% | 68.1% |
| 40-44 | 51% | 51% |
Each of these studies tracks women who are trying to get pregnant and don’t have any known fertility issues. The 1982 study is the most pessimistic, and I suspect it’s for two reasons. First, this study tracks women undergoing IVF (they don’t have fertility issues, but their partner is sterile). Second, they determine ovulation using body temperature, which is less reliable than modern hormone test strips. In any case, the pattern is not hard to see. In your 20s, the chance is at its highest at around 80%. It drops a bit in your early 30s to 79%, and starts to decline more dramatically after 35 to 68.1%. After 40, getting pregnant becomes much more difficult with a 51% success rate during the first year.
One way of modeling this is as a series of trials which occur each menstrual cycle and can either succeed or fail. Knowing the chance of success after 13 trials,2 I can work backwards to calculate the chance of success per trial. In other words, I model this as a geometric distribution. The chance of conceiving per month is in the table below. I also calculate the probability excluding the 1982 study, which may not be representative for the reasons given above.
| Age | Chance of conception per month | Excluding 1982 study |
|---|---|---|
| 26-30 | 11.9% | 14.5% |
| 31-35 | 11.2% | 14.8% |
| 36-40 | 8.4% | 9.9% |
| 41-44 | 5.3% | 5.3% |
This probability can also be found empirically. One study (archived link) calculates the chance of pregnancy given sex a specific number of days before ovulation. Having sex the day of ovulation yields the highest chance of success at around 30%. Sex five days before ovulation yields a success rate of 10%.

Given that couples can’t always perfectly time sex, the actual success rate per month is likely to be less than 30% but greater than 10%. This gives me confidence my derived numbers are reasonable.
One caveat is that a geometric distribution assumes that each trial is independent like a coin flip. This isn’t true of conception. Each time a couple doesn’t conceive, the probability that one or both have a fertility problem increases. If a couple hasn’t conceived despite a year of trying, they are diagnosed with infertility. This affects 12% of couples under 35. While scary, this is not the end of the road. Some causes of infertility can be treated, and methods like IVF might be an option. In any case, once a couple has reached this point, my simple model no longer holds. I haven’t done the research to extend it to these scenarios.
How hard is it to stay pregnant?
The two additional hurdles mentioned above, miscarriage and stillbirth, also get worse with age.
Miscarriage is common. Across all pregnancies, the rate may be as high as 50%. Many of these occur before the mother even knows she is pregnant. These miscarriages are already factored into the statistics above because those studies only count known pregnancies. To extend the model, what we need to know is the rate of known pregnancies that end in miscarriage. I’ve found two studies that calculate this, which I present in the table below.
| Age | Role of maternal age and pregnancy history in risk of miscarriage: prospective register based study (2019) (archived link) | Practice Bulletin Number 200: Early Pregnancy Loss (2018) (archived link) | Average |
|---|---|---|---|
| 26-30 | 9.8% | 13% | 11.4% |
| 31-35 | 10.8% | 10.8% | |
| 36-40 | 16.7% | 20% | 18.4% |
| 41-45 | 32.2% | 40% | 36.1% |
The rate of miscarriage is similar between one’s late twenties and early thirties at around 11%, but starts to take off in one’s mid thirties (18.4%) and doubles to a troublesome 36.1% in one’s early forties.
After 20 weeks, spontaneous terminations are called stillbirths, and they are much rarer. I’ve found one paper that stratifies this by age group. The risk is <1% for all age groups. The data are presented below.
| Age | Advanced Maternal Age and Stillbirth Risk in Nulliparous and Parous Women (2015) (archived link) |
|---|---|
| 26-30 | 0.27% |
| 31-35 | 0.31% |
| 36-40 | 0.40% |
| >40 | 0.53% |
The last piece of this puzzle is how long it takes the baby to develop. Forty weeks is the most commonly cited number. I model this as a normal distribution, with an average of 280 days and a standard deviation of 16 days. One important detail is that 40 weeks is not counted from fertilization. It’s counted from the first week of menstruation.
How long does it take to make a baby?
To put these numbers together and arrive at a final estimate of how long it takes to make a baby, I plug all probabilities into a Monte Carlo simulation. The details of this simulation are described in the appendix below, but the quick explanation is that the chance of success at each stage of the pregnancy is simulated, and the simulation keeps track of how long has elapsed until the pregnancy is successful.
I run this simulation thousands of times with parameters picked for each age group and record how long each run takes to achieve a successful birth. In this model, the zeroth day is the first day of the cycle when the couple begins trying.
I visualize this data as a histogram of the number of days it takes to achieve a successful birth.
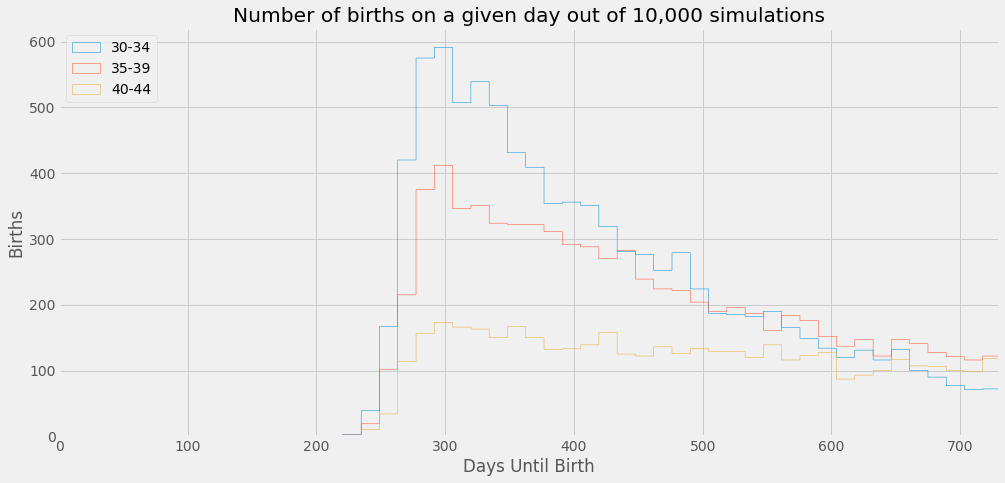
The vertical axis is the number of successful births, and the horizontal axis is how many days it took to achieve those successful births. For example, the value above the “300 days” tick mark is almost 600 for the youngest age group, meaning that, out of 10,000 simulations, almost 600 babies were born around the 300 day mark.
Some observations:
- Few couples will have babies before the 280 day mark because gestation takes on average 280 days. Only couples that conceive on the first try and then have a premature baby will have a baby that early. We don’t need the simulation to know this, but it’s a good sanity check that it’s not generating crazy numbers.
- There is a peak around 300 days that trails off to the right. This is a common pattern for this type of process and resembles a geometric distribution. At first glance, it might appear that most couples have a baby at the 300 day mark, but this is deceiving because much of the probability mass stretches off to the right. Indeed, the 50th percentile is to the right of the peak.
- The distribution flattens out as age increases. This reflects the fact that it takes longer for older age groups to conceive in the first place, and, once they do, the elevated chance of miscarriage and stillbirth means it’s more likely they’ll have to restart the process. It’s easy to gloss over these numbers, but it’s important to consider what this actually means. It means that not only will it take longer to have a baby, but the expected emotional cost also increases. Having to restart the process after a miscarriage could be a traumatic event.
Another way of visualizing this is with a cumulative distribution curve, which shows the proportion of couples who have a baby before some date.
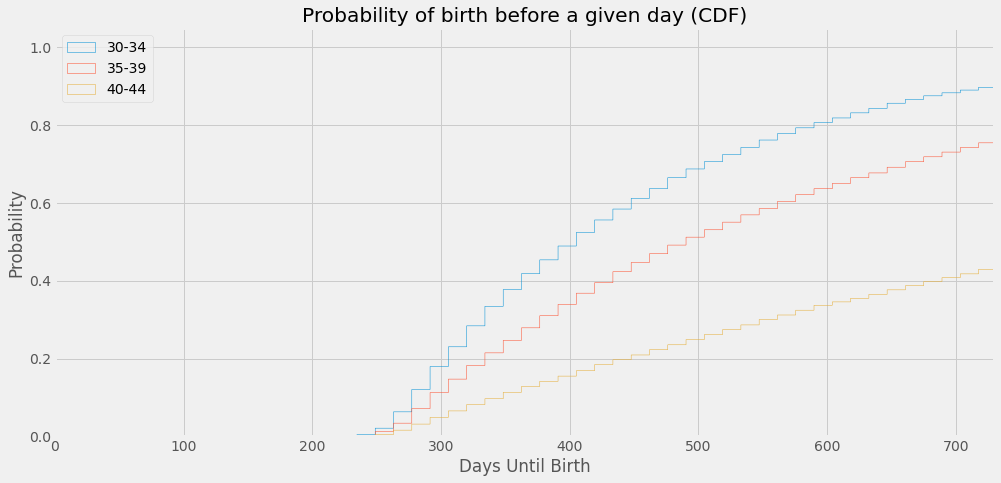
The horizontal axis again shows the days until a successful birth, but now the vertical axis shows the proportion of couples that had a successful birth on or before that day. I interpret this as a probability. For example, looking again at the 300 day tick mark, we see that almost 20% of couples in the youngest age group have a successful birth on or before 300 days. This graph extends out to 2 years or 730 days.
Some observations:
- In the previous graph, it was clear that the older age groups had a flatter curve. This graph illustrates the implication of that. Looking again at the 300 day tick mark, the chance of a successful birth drops from almost 20% for the youngest age group to less than 10%, perhaps as low as 5%, for the oldest age group. That’s a dramatic difference.
- Looking at the right side of the graph, over 90% of couples in the youngest age group will have a baby before 2 years, whereas less than 50% will have a baby in the oldest age group.
- The difference between the youngest and middle age group is significant, but the bigger drop occurs between the middle and oldest. This means the rate at which it becomes more difficult to have a baby is nonlinear. When measured in these terms, the distance between 35 and 40 is larger than the distance between 30 and 35.
Finally, one last way to summarize the data is in percentiles.
| Percentile | 30-34 | 35-39 | 40-44 |
|---|---|---|---|
| 25th | 325 | 364 | 506 |
| 50th | 409 | 496 | 839 |
| 75th | 552 | 726 | 1402 |
| Average | 471 | 600 | 1098 |
The 50th percentile is the point at which 50% of couples in a given age group will have had a baby. Similarly, the 75th percentile is when 75% have had a baby. So, for the youngest age group, 50% of couples have a baby by day 409. For the oldest age group, it takes more than twice as long for 50% of couples to have a baby.
These numbers make vivid, not only the timescales required to make a baby, but the potential difficulties that only become more severe as time goes on. A roughly 10% chance of miscarriage and a 10% chance of being diagnosed with infertility are nontrivial. Nine times out of ten, it won’t be me, but that remaining one in ten chance disabuses me of the notion that these are problems that only happen to other people.
Other factors to consider
- Many couples want to have multiple kids, so the time in between pregnancies must also be taken into account. I’ve done less research on this, but it looks like doctors recommend waiting 18 months (archived link) between pregnancies. For the youngest age group, this means having two children takes on average 3.7 years (408 + (18*29) + 408).
- If you’ve been on the pill for a long time, it may take several months (archived link) for your menstrual cycle to become regular and predictable. At the very least, this makes timing sex during the fertile window difficult.
- Before getting pregnant, you may want to do genetic testing to see if you’re a carrier for diseases like Tay-Sachs, cystic fibrosis, and spinal muscular atrophy. This process takes time.
- Rubella is a disease that can lead to miscarriage or birth defects. Most people are vaccinated when they’re young, but it’s possible for the vaccine to wear off. For this reason, doctors recommend getting a rubella antibody test before getting pregnant. If this comes back negative, it’s safest to get re-vaccinated. And because it’s a live vaccine, you need to wait a month after getting the vaccine before attempting to conceive.
Appendix: Monte Carlo Simulation
I model this with a Monte Carlo simulation:
- A coin is flipped until conception is achieved. The simulation keeps track of the number of months this takes.
- A coin is flipped for miscarriage. If miscarriage occurs, I draw from a uniform distribution between 1 and 3, which represents the number of months into the pregnancy the miscarriage occurred. Then the process starts over at step (1).
- A coin is flipped for stillbirth. If stillbirth occurs, I draw from a uniform distribution between 4 and 9, which represents the number of months into the pregnancy the stillbirth occurred. Then the process starts over at step (1)
- If neither miscarriage nor stillbirth occur, I draw from a normal distribution with a mean of 280 and a standard deviation of 16 to model the number of days the baby gestates.
Implicit in this simulation are a few simplifying assumptions:
- I assume that a couple will keep trying until they have a successful pregnancy no matter how long it takes. In reality, after a certain point a couple would either give up or try a different method such as IVF. This model doesn’t capture those scenarios.
- I assume that, given that a miscarriage or stillbirth occurs, it will occur with uniform probability between 1 and 3 months and 4 and 9 months. In reality, a miscarriage is more likely to occur toward the beginning of the pregnancy. I’m not sure about stillbirth.
- I assume that if a miscarriage or stillbirth occurs, the couple can try again as soon as the next menstrual cycle. I’m not sure if this is true in all cases. I also imagine some couples might not want to try again immediately.