
’What's the good of Mercator's North Poles and Equators,
Tropics, Zones, and Meridian Lines?’
So the Bellman would cry: and the crew would reply
‘They are merely conventional signs!’
-Lewis Carroll, "The Hunting of the Snark"
When I first started at GitLab I was hired to automate a specific task for the advanced search team: search for security holes in our data redaction logic. Shortly after my being hired this mandate became moot. Simultaneously, the search team was also in the middle of transitioning our product manager to a new team and introducing a new one. This left me with some existential angst around my role as the software engineer in test for the search team. I mean, there’s always work to do, but what work would be most helpful?
After a few months of seeing bug reports being filed by users and GitLab team members, I thought it would be best to try to direct our testing efforts where we have the most unmitigated risk. But, how would we come to know with any degree of certainty where that is? To find out I made a risk map.
Risk maps are not new. The United States Federal Emergency Management Agency uses them, insurance companies use them, and software companies use them.
The point of the risk map is to show you and your team where in the project you are responsible for is the most unmitigated risk. It can then be used to inform what areas of the project should be the focus of adding testing, preferably automation, though not exclusive of manual testing (exploratory testing, bug bashes, etc.).
“The Map is Not the Territory”
Risk maps are not perfect reflections of where the risk exists in your project. Any criticism of the map, “It gets stale too quickly”, “You’re distorting where the real risk lies”, “It takes too much time to keep updated”, have validity and could apply just as well to maps of physical places. In my case I would say that even a low resolution map, supported by data, of where risk is in the project is better than no map at all. Without such a map I would continue working by just relying on my gut instinct of where the risk is, or worse, I would be in the reactive state of fixing things after they’ve gone wrong. Isn’t an old, out of date map sometimes useful?
Should You Make A Risk Map?
Of course I can’t be prescriptive about this. If you’re reading this, you are likely the best judge of if you and your team will get utility from making one. I can say that in my situation: new to the search team, transitioning to a new product manager, and no clear signal as to where the riskiest part of the project was, it made sense for me to make one.
How to get started
If you do decide you want to make a risk map for your team, here are some steps and tips that may help.
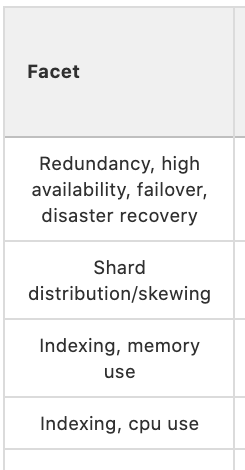
First you’ll want to get a sense of what can go wrong. I call these “risk facets”. For example: a simplified view of Elasticsearch (the underlying tech we use for our advanced search feature at Gitlab) is that users insert records (Merge Requests, Issues, Users, Comments etc.) they want to be searchable into GitLab, that record gets indexed, and then, later, a user tries to recall that record. In this simplified view the facets could be problems around record insertion, indexing, and recall. These could be multiplexed by considerations of: speed, efficiency, and cost. So, that may yield a risk map with nine rows, or risk facets: record insertion - speed, record insertion - efficiency, record insertion - cost, record indexing - speed, etc.
A helpful starting point for understanding what risk facets may be for your project is to look at the list of features it has. This is not likely to be an exhaustive list of the risk facets your project presents, but it is a good place to start.
Some of these facets may have a label (or, more likely, a combination of labels) that accurately map issues to the risk facet. If your project is anything like mine, many facets will not have these corresponding labels. For future extensibility and automated aggregation of issues around each facet, it is important to create labels or create combinations of labels that can accurately map issues to a single risk facet.
So, take some time to read through recent issues. Look at the issues your users are filing. See if there are some shared areas around which the issues are filed. These are likely the more important risk facets. I did this over several weeks of reading issues as they were filed and extrapolating where problems could arise. I then created a list of these facets in a notebook until I found that I had a substantial amount of facets that could be tracked. Next, I transferred those risk facets to the rows of the table in the risk map issue.
Do not, as I did, confuse solutions to risk facets for the risk facets themselves. For example, I erroneously added a row to my map for “regex - optimization”, which is a solution to the risk facet “regex - efficiency”.
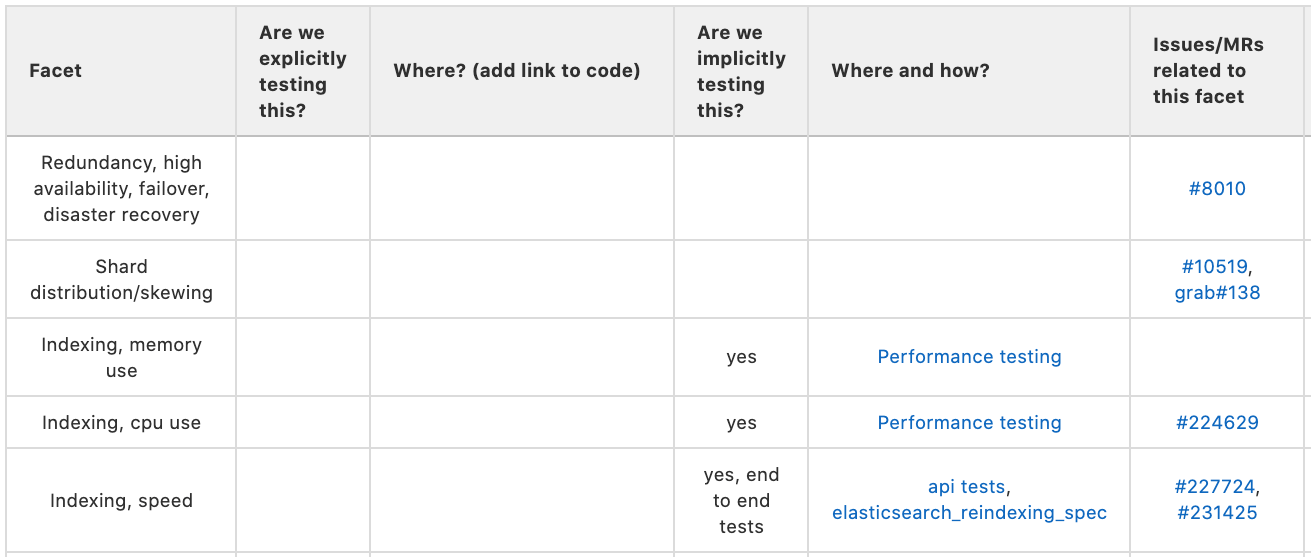
After a time of gathering the risk facets and adding them to the rows of the table in the issue it’s time to add the other columns to the table and track if those risk facets are being implicitly or explicitly tested and where. It felt important to differentiate between implicit and explicit testing because explicitly testing for every risk facet is prohibitively expensive in either time, cost, effort, etc. (or some combination thereof). Just because we aren’t explicitly testing some facet doesn’t mean there isn’t some kind of test coverage for that facet. Since the exercise is aimed at showing the team where risk facets are, their severity, and if they are being mitigated or not, showing where the implicit testing is happening is important. Fill in the implicit/explicit testing columns and add the links that point to where this testing is happening.
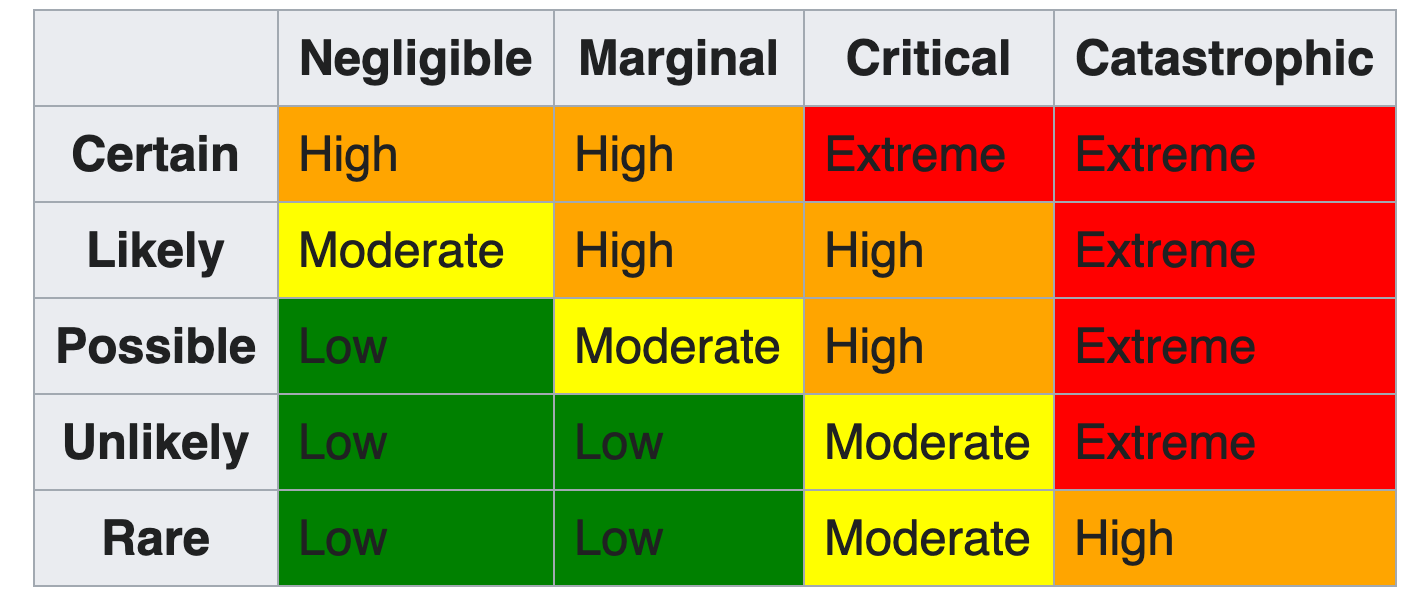
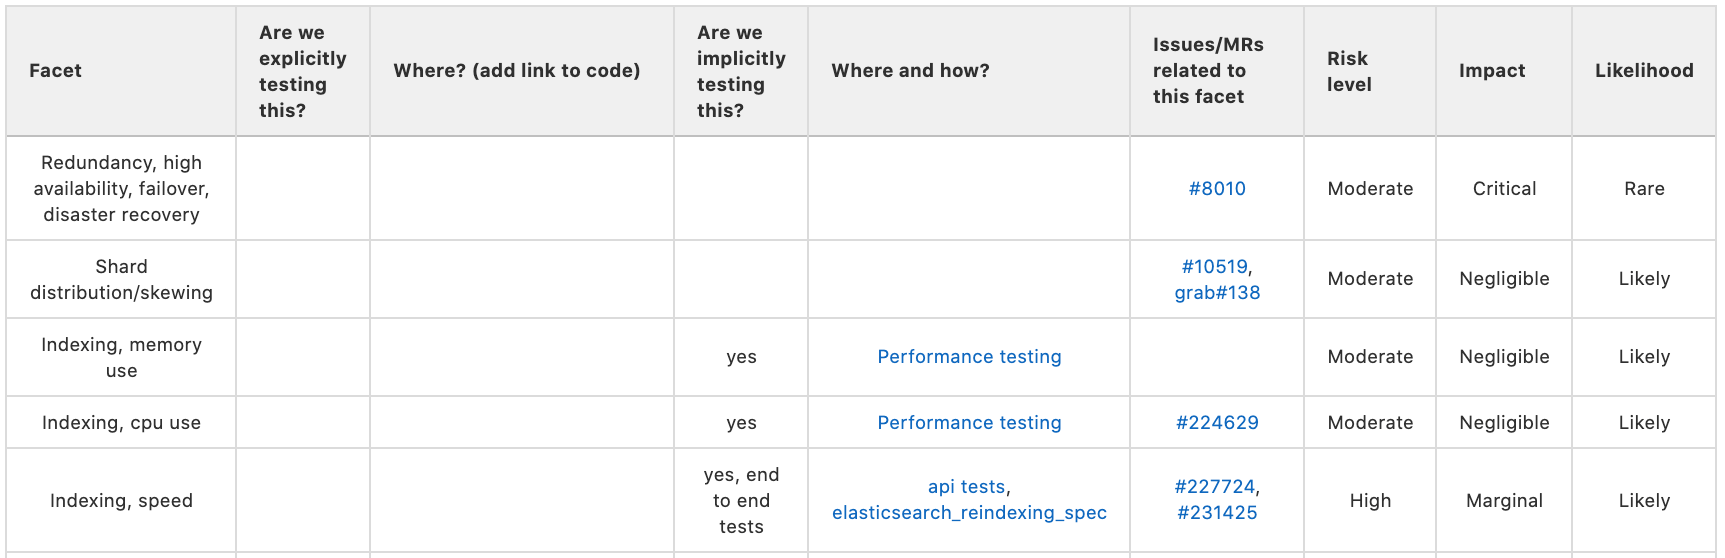
The last three columns compose your risk matrix. They are: risk level, impact, and likelihood, so ordered so that the most important of the three columns, risk level (which is just a composite of the other two columns), is more likely to be visible before horizontally scrolling off the screen, are most likely to need input from the rest of the team. Actively solicit other team members to help fill out these columns.
It’s important to recognize that this map will never be done. You’ll never “finish it”. Incompleteness is to be expected. But what should emerge is a picture of where most of the testing is being done, and where most of the risk is being carried in the project. You can then use this to help the team align testing toward facets to better mitigate risk.
Product Management
To Product Managers a risk map helps quantify the amount of energy to spend mitigating a possible risk. With a goal of not over investing in a mitigation, as well as avoiding catastrophe. Product Managers can also help identify primary and secondary effects that can create a need to change the level of risk assessed. History is full of examples where improper risk assessments lead to preventable disasters. PMI.org Deepwater Horizon Lessons in Probabilities
Next steps
- Identify where the highest risk is and try to mitigate it.
- Decide with the team how often we should update the risk map.
- Add labels so that each issue for the search team falls into one unique risk facet.
- Automate some of the creation of the map by aggregating issues and MRs based on the newly created labels.
- Compare my efforts at doing this exercise with other teams (should they decide to do it as well).
- Add features like:
- Sorting by risk level
- Toggle by open/closed/all for issues/MRs.
- Toggle displaying issues found by customers.
Link to Risk Map: https://gitlab.com/gitlab-org/gitlab/-/issues/229431
Link to Risk Mapping Epic: https://gitlab.com/groups/gitlab-org/-/epics/4253
Cover image by Niklas Hamann on Unsplash.