This article was created in partnership with WRLD. Thank you for supporting the partners who make SitePoint possible.
We’re just about wrapping up our series on the WRLD platform. So far, we’ve looked at how to use WRLD with outside maps. In this tutorial, we’re going to design and use an indoor map (also known as a floorplan, if you’re going to be pedantic about it like a Dwight Schrute). As you might be able to tell, I think The Office would be a good theme for this one. Let us start off with a quote:
Would I ever leave this company? Look, I’m all about loyalty. In fact, I feel like part of what I’m being paid for here is my loyalty. But if there were somewhere else that valued loyalty more highly… I’m going wherever they value loyalty the most. – Dwight K. Schrute
In this tutorial, we’re going to cover the following topics:
- Creating an indoor map
- Importing the map into WRLD
- Highlighting specific rooms
- Creating a schedule and looping through it
The code for this tutorial has been tested with a modern version of Chrome.
Creating Indoor Maps
We’re going to try and re-create the office, from The Office. I think it’s going to be a bit of a fun challenge. We’ll start by installing some software. I’m on a Mac, so these are the instructions for how to do it on a Mac. Apparently, it’s a lot simpler on Windows…
The first bit of software we need is called QGIS. You can download it directly from their site, but the Mac link goes off-site to a rather dodgy looking place. I’m a bit more trusting with software I can install through Homebrew, because I can see what it’s doing at each step of the way. If you are on a Mac, and you haven’t already got Homebrew, I suggest you install it. Once that’s done, you can start the QGIS installation via some Python packages:
brew install gdal
brew install python
When I tried installing
python, Homebrew told me I already had Python installed. However, thepipcommand was missing. I had to reinstallpython, usingbrew reinstall python; and then I had to re-link it, usingbrew unlink python && brew link python. After this, I had thepipcommand.
You can follow this up with:
pip install matplotlib
pip install psycopg2
brew tap osgeo/osgeo4mac
brew install qgis2
All of this works, at the time of writing. That’s no guarantee that it’ll work by the time you read this. You may have to resort to the seemly official, yet utterly dodgy-looking QGIS download site I mentioned earlier.
I learned of this process from a tutorial, about installing QGIS through Homebrew.
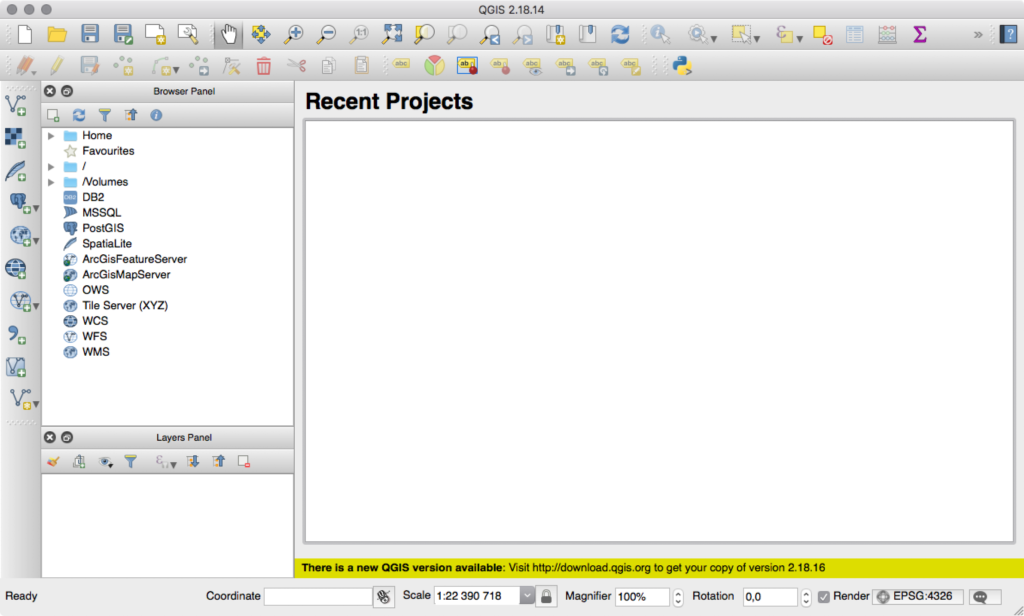
After all that, you should be able to run the qgis2 command…
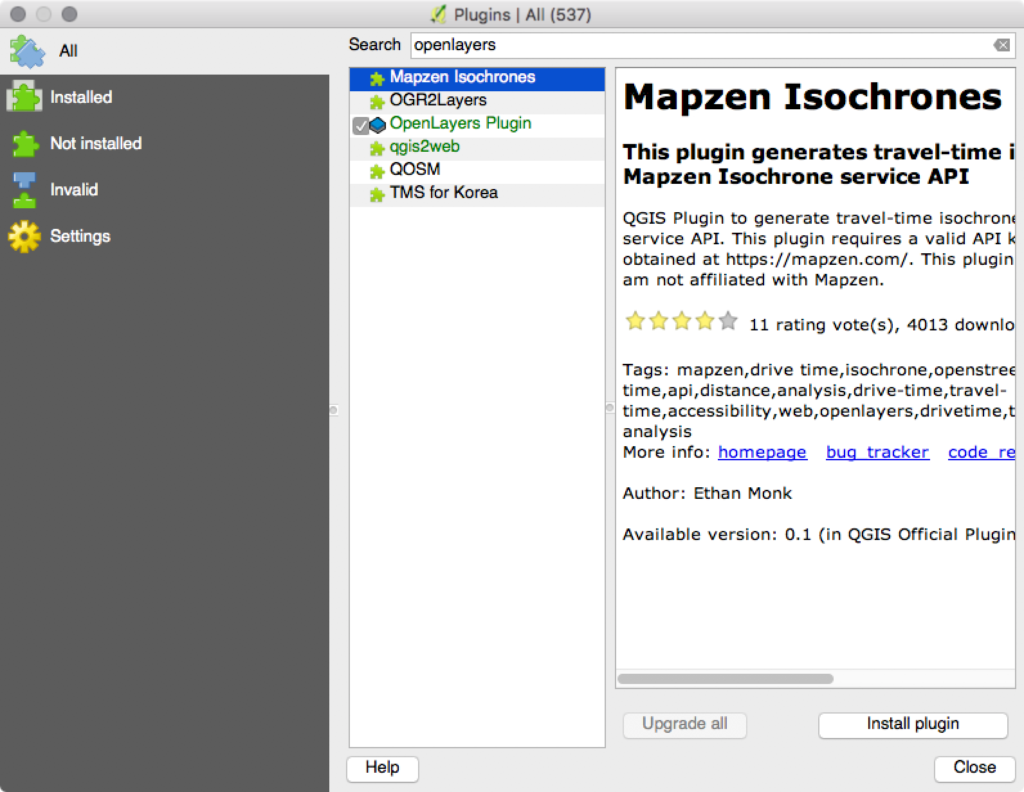
You will also need to install a few plugins. Go to Plugins → Manage and Install Plugins. Install the OpenLayers plugin and the Lat Lon Tools plugin.
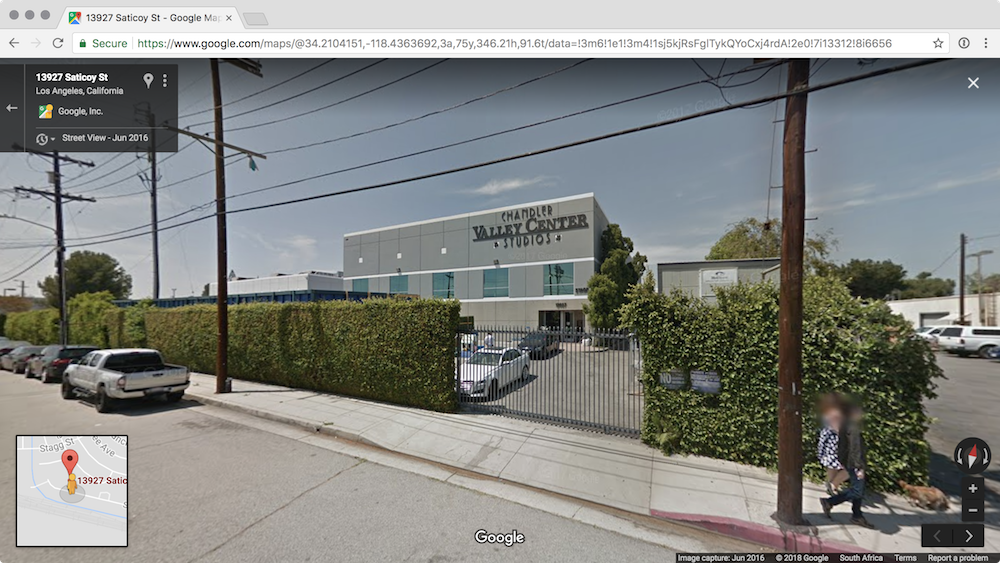
Next, we need to figure out where it is. In the show, it’s said that the office is located at 1725 Slough Avenue in Scranton, PA. The actual location of the building is really at 13927 Saticoy Street in Panorama City, CA.
The easiest way to confirm a map location (if you remember how the place looks) is to search for the address in something like Google Maps, which provides a street view mode. Just to prove that the Panorama City location is the right one, I searched for that address in street view, and got this:
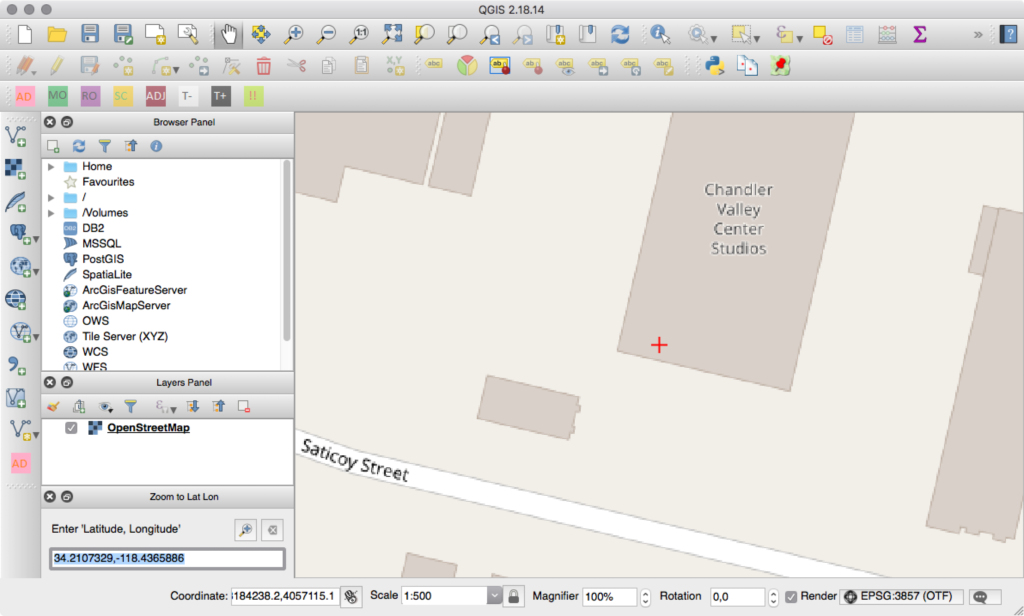
Now, it’s time to start creating the map. Add a new OpenStreetMap layer by going to Web → OpenLayers plugin → OpenStreetMap → OpenStreetMap. You should see a zoomed-out map of the world. Go to Plugins → Lat Lon Tools → Zoom To Latitude, Longitude and enter in the coordinates you want (in this case: 34.2107329,-118.4365886). You can change the scale to 1:500 for a closer look.
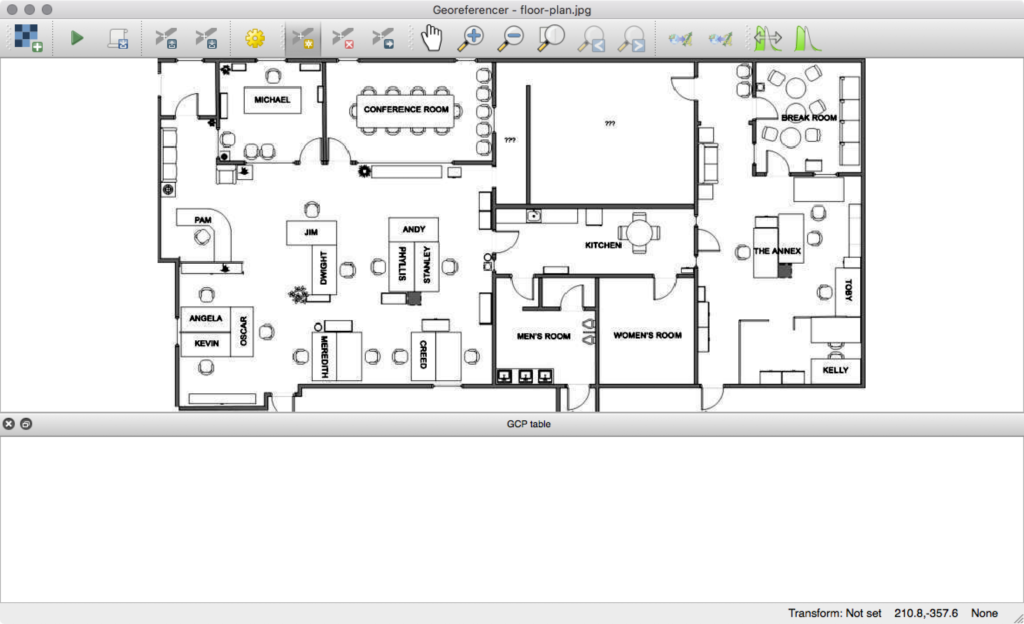
Next, click Raster → Georeferencer → Georeferencer. That’ll pop up a new, empty window. Click File → Open Raster to select the floor plan. “What floor plan?”, you ask. The very same you can download by searching for “The Office floor plan”.
I should mention that you’ll be asked what kind of Coordinate Reference System (CRS or SRS) you need. Select “WGS 84 / Pseudo Mercator”. I don’t really understand why, but it was the default and it seems to have worked well for me! The floor plan should then be displayed in the editor.
We need to link the indoor map to the outdoor map. Click Add Point (in the Georeferencer window) and click on a perimeter point (like the corner of the building). Then click From map canvas and select the corresponding point from the outdoor map.
Repeat this a few times. I know it’s probably technically not accurate to match the indoor map 1:1 with the outdoor building shape but that’s what I’ve done for now. Feel free to do the same. Try to be as accurate as possible.
When you’re happy with the points you’ve mapped, click Settings → Transformation Settings and make the settings look similar to this:
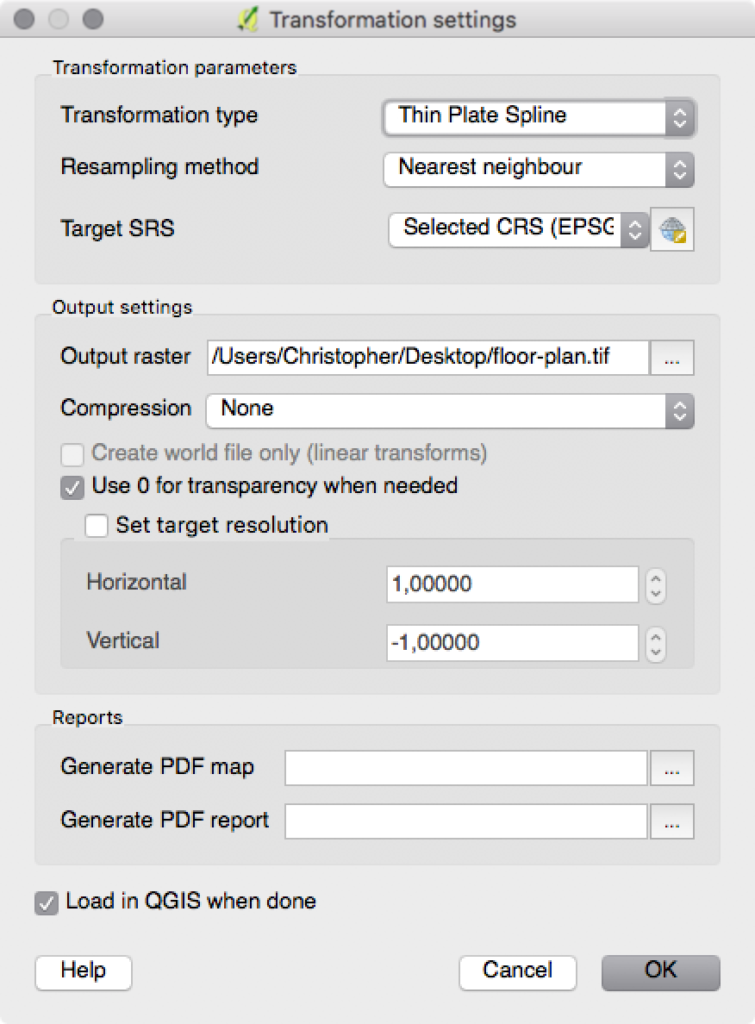
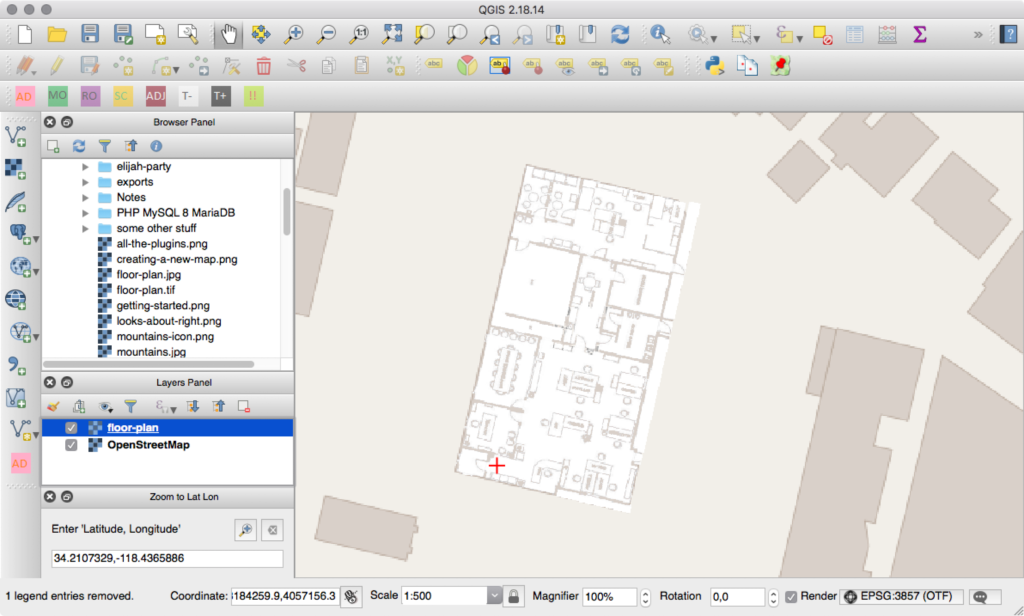
Most of that is default, but the Target SRS should be EPSG:3857. Click on. Then click the green play button (which is the Start Georeferencing button). This will take you back to the main QGIS window, except now the floor plan will overlay the outdoor map. You can right-click on the floor plan, in the layers panel, and click Properties. There, you can adjust the blend mode to something a little less jarring. I like the Lighten blend mode.
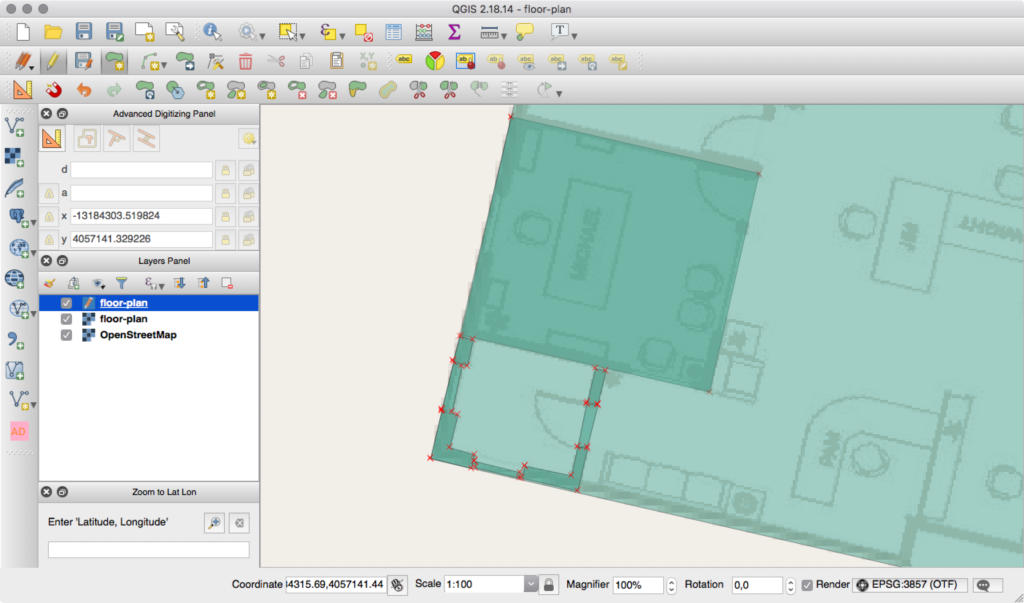
Now, we need to start drawing features on the floor plan. Click Layer → Create Layer → New Shapefile Layer. Set the Type to Polygon, pick the same SRS of EPSG:3857, and add type, name and highlight attributes to the attributes list. The defaults of “Text data” and “80” are fine for type and name attributes, but the highlight attribute needs to be set to integer. Values in the Length field don’t need to change. Click Ok and give the shape file a name.
When you see it in the layer panel, double-click it and set the transparency to 50% so that you can still see the map underneath. The shapes layer needs to be the top layer, so drag it if it’s not there already. Next, click the Toggle Editing button (the pencil) and then click the Add Features button (which looks like a green blog with a yellow icon over it).
Trace the boundary of the floor plan. When you’ve done that, right-click on the shape you’ve made and give it a type of building_outline. This is the boundary for how WRLD will render the indoor map. Click the Add Features button again, and begin to trace things like walls, windows, doors, and rooms. These shouldn’t overlap. When you’ve traced a segment, give it the corresponding type, like wall, window, door, or room. You can usually leave the “name” field empty, but if you specify a room name then WRLD will display it. If you plan on using any highlights, you can add a 1 to the room features in the highlight attribute.
It’s a little less chaotic if you draw rooms instead of the walls, windows, and doors that make them up. There’s a full list of elements you can trace (and their types) here. Keep tracing features until you’ve got as much detail as you need.
Before we can import the map into WRLD, we need to make sure the feature IDs are unique. If you’ve been giving unique IDs then you’re all set. Otherwise, open the list of features by clicking Layer → Open Attribute Table and give each feature an ID. The order doesn’t matter.
Right-click on the shapefile layer and click Save As. To upload your building, you now need to update the CRS to EPSG: 4326 and export it as a geojson file, rather than a shapefile. Converting to 4326 changes the format from Pseudo-Mercator to Mercator which means that the points of your constructed floorplan are now being stored in latitude and longitude – which WRLD Indoor Map Designer uses to place your map correctly in the world when converting it into a 3D model. Save the file somewhere, and open your text editor to the same folder you saved the shape layer file into. Create a new JSON file, called main.json:
{
    "id": "the-office",
    "name": "The Office",
    "owner": "Dunder Mifflin",
    "location": {
        "type": "Point",
        "coordinates": [-118.4365886, 34.2107329]
    },
    "levels": [
        {
            "id": "the-office-1",
            "name": "1",
            "readable_name": "First floor",
            "z_order": 0,
            "filename": "floor-plan.geojson"
        }
    ]
}
This is from main.js
The id field is just something for you to recognize the map by. You can put anything there. Name is the human-readable name of the map. Owner is the name of your company (or the company claiming the building on WRLD). Location is the point on the map where the indoor map lives. That array is [longitude, latitude].
Then, there’s an array of levels. You can have multiple floors per building. We’ve only designed one, so that’s the one we’ve defined in the array. Put these two files in a folder and create a ZIP file from the folder. Then, head over to https://mapdesigner.wrld3d.com/indoormap/latest and start to create a map!
Click New Indoor Map, and name it. Then, search for the appropriate building, using latitude and longitude. When you see the building you want, click on it and click Claim Buildings. Make sure you take the option to Download Floor Plan, as this’ll make tracing it in QGIS easier in a moment. Next, skip to the Upload Map step and upload the ZIP file you created. It’ll take a few moments to process. Once successful, you should see a button on the map to click on. Clicking on it will take you inside the building…
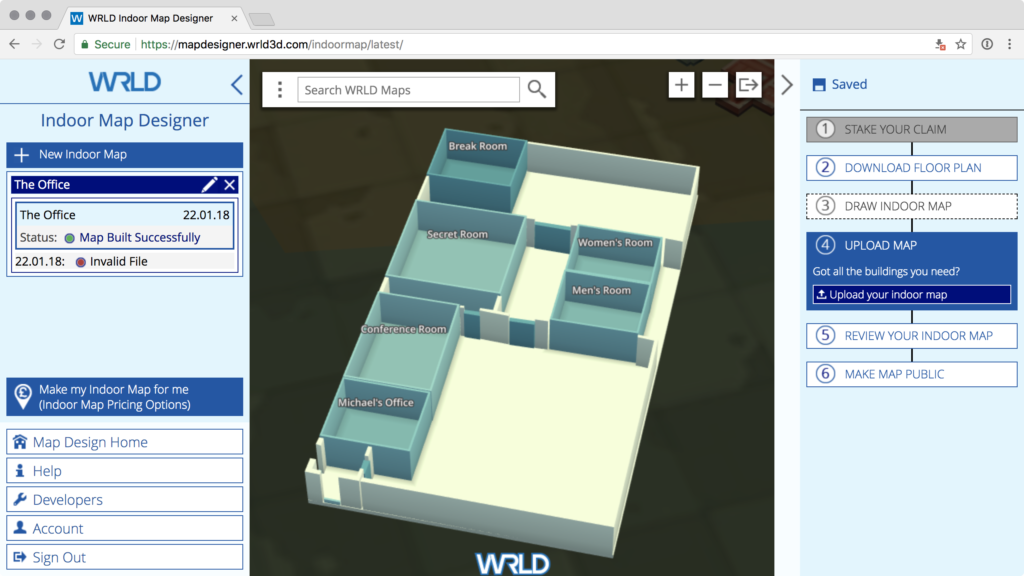
As you can see, I took a while to figure out that the location coordinates were “longitude, latitude” instead of “latitude, longitude”. When you’re happy with the indoor map, click Make map public.
There’s a longer, more detailed guide to creating these maps here. I found parts of it unhelpful, but your mileage may vary…
Interacting with Indoor Maps
It may take some time for your map to be approved. In the meantime, let’s look at how we can interact with indoor maps.
For this part of the tutorial, we’re going to work with code hosted on CodePen. The CodePens are demonstrative and best results will be achieved using the code extracts and steps in the article. If you’d like a local setup, look for details of how to set that up in the previous tutorial.
Let’s begin by creating a map and entering a pre-made building:
const map = L.Wrld.map("map", "f24b71dd92ab9e38cf4aa53806ab813d", {
    center: [56.459801, -2.977928],
    zoom: 15,
    indoorsEnabled: true,
})

map.indoors.on("indoormapenter", () => {
    map.indoors.setFloor(2)
    map.setView([56.459984, -2.978238], 20)
})

map.on("initialstreamingcomplete", () => {
    map.indoors.enter("westport_house")
})
This is from CodePen
In this example, we’re moving to the coordinates of the WRLD offices. Once the map has finished loading (via initialstreamingcomplete) then we ask the map to “go indoors”. On the indoormapenter event, we set the selected floor to 2 and zoom the map in further.
That’s going to work with the maps you’ve submitted, as well, once they’ve been approved.
We can interact with features by listening for a click event:
map.indoors.on("indoorentityclick", (event) => {
    map.indoors.clearEntityHighlights()
    map.indoors.setEntityHighlights(event.ids[0], [255, 0, 0, 128])
})
This is from CodePen
The indoorentityclick receives an event which holds the ID of the feature that we’re clicking on. We can use the clearEntityHighlights and setEntityHighlights events to toggle any custom colours on the features we want to highlight.
It’s probably time for another quote…
I saw Wedding Crashers accidentally. I bought a ticket for “Grizzly Man” and went into the wrong theater. After an hour, I figured I was in the wrong theater, but I kept waiting. Cuz that’s the thing about bear attacks… they come when you least expect it. – Dwight… again
Creating a Repeatable Highlight Pattern
Let’s try an experiment. Let’s make a “record” button that records clicks we make on the map; and then replays them all back to us. We’d need a record and play button, as well as an array of clicks…
<button id="record">record</button>
<button id="play">play</button>
This is from CodePen
Now, let’s connect to these buttons with click events:
map.indoors.on("indoorentityclick", (event) => {
    map.indoors.clearEntityHighlights()
    map.indoors.setEntityHighlights(event.ids[0], [255, 0, 0, 128])

    clicks.push({
        time: new Date(),
        id: event.ids[0]
    })
})

let recording = false
let started = null
let clicks = []

const record = document.querySelector("#record")
const play = document.querySelector("#play")

record.addEventListener("click", () => {
    if (recording) {
        recording = false
        record.innerText = "record"
    } else {
        recording = true
        record.innerHTML = "stop"
        started = new Date()
        clicks = []
    }
})

play.addEventListener("click", () => {
    map.indoors.clearEntityHighlights()

    for (let click of clicks) {
        setTimeout(() => {
            map.indoors.clearEntityHighlights()
            map.indoors.setEntityHighlights(click.id, [255, 0, 0, 128])
        }, click.time.getTime() - started.getTime())
    }
})
This is from CodePen
Let’s look at the record button event first. When clicked, if recording hasn’t yet started, we change the button’s text value to stop and we clear the clicks array. We also capture the moment at which the record button was clicked, so that we can time our events relative to it.
If we click on it again, we can reset the button text value, and stop recording.
Then, when we click on the play button; we clear all highlighted features and start to loop through the “recorded” events. They’re in an array, so we can use a for...of loop. We set a timeout for each click event by taking the time of the click and subtracting the started time from it. All the timeouts are created at virtually the same time, but they are triggered relative to how long after the recording started they happened.
Finally, we need to capture the click events when features are clicked on. So, we hijack our earlier indoorentityclick event listener by adding the click events to the clicks array. Give it a go, by recording some clicks and then playing them back. It’s quite addictive…
Creating a Schedule
Let’s expand this idea to include a configurable schedule. Let’s say someone at WRLD moves around the office, during the day. Or, imagine (in fitting with our theme) that Dwight wanted to track the movements of Jim…
He could do that if he knew Jim’s schedule:
const schedule = [
    {
        "start": "08:00",
        "duration": "00:30",
        "id": "0003"
    },
    {
        "start": "08:30",
        "duration": "00:30",
        "id": "0004"
    },
    {
        "start": "09:15",
        "duration": "00:45",
        "id": "0028"
    },
    {
        "start": "10:00",
        "duration": "01:00",
        "id": "Meeting Room"
    },
    {
        "start": "12:00",
        "duration": "01:30",
        "id": "0039"
    }
];
This is from CodePen
We can make a function that calculates the number of minutes for the time format we’re using (i.e 01:30 → 90):
const timeToMinutes = (time) => {
    let holder = new Date();

    holder.setHours(0);
    holder.setMinutes(0);
    const start = holder.getTime();

    const parts = time.split(":");

    holder.setHours(parseInt(parts[0], 10));
    holder.setMinutes(parseInt(parts[1], 10));
    const end = holder.getTime();

    return (end - start) / 1000 / 60;
};

const schedule = [
    // ...
]

for (let event of schedule) {
    console.log(timeToMinutes(event.duration))
}
This is from CodePen
This will print 30, 30, 45, 60, and 90 in order. Then we need to add these minutes to the start time, to work out when the end time is:
const timeToMinutes = (time) => {
    // ...
}

const startFromTime = (time) => {
    const parts = time.split(":");

    let holder = new Date();
    holder.setSeconds(0);
    holder.setHours(parseInt(parts[0], 10));
    holder.setMinutes(parseInt(parts[1], 10));

    return holder;
};

const endFromStartAndMinutes = (start, minutes) => {
    return new Date(start.valueOf() + (minutes * 1000 * 60));
};

const schedule = [
    // ...
]

for (let event of schedule) {
    const start = startFromTime(event.start)
    const minutes = timeToMinutes(event.duration)
    const end = endFromStartAndMinutes(start, minutes)

    console.log(start, end)
}
This is from CodePen
…And this will log the start and end times relative to the current day. You may want the start and end times to be relative to a fixed day, so you’d need to modify startFromTime and endFromStartAndMinutes to take a day into account.
Given these start and end times, we could code the indoor map to display the room where this staffer is right now:
const schedule = [
    // ...
]

setInterval(() => {
    map.indoors.clearEntityHighlights();

    for (let event of schedule) {
        const start = startFromTime(event.start);
        const minutes = timeToMinutes(event.duration);
        const end = endFromStartAndMinutes(start, minutes);

        const now = new Date();

        if (now >= start && now <= end) {
            console.log("Time is now " + now.toLocaleTimeString() +
                        ", in the " + start.toLocaleTimeString() +
                        " to " + end.toLocaleTimeString() +
                        " interval. Highlighting entity " + event.id);
            map.indoors.setEntityHighlights(event.id, [255, 0, 0, 128]);
        }
    }
}, 1000);
This is from CodePen
By comparing the current time to the start and end times of each event; we can tell which event the staffer is currently in (and highlight the feature accordingly).
If you don’t see any highlighted entities, you probably don’t have any scheduled for the exact time you’re looking at the code. Try adjusting the schedule of that CodePen, and open the console to see which entity should be highlighted. I’ve also removed the record/play code from previous examples, to make it easier to see what’s going on in this demo.
Just think of how this could be expanded. You could add everyone’s schedules to create a virtual event booking system. Or, you could create an animated visualization to see if there are any conflicts. This too is another jumping-off point for an app.
Summary
We spent a lot of time learning the ins and outs of creating indoor maps. WRLD isn’t the only platform that understands QGIS-made maps, so it’s a good skill to learn if you want to do all kinds of mapping.
We also looked at how QGIS-made maps are imported and used inside the WRLD platform. We can define maps with a huge amount of detail, and interact with them in real time. Once you know what to install and how to draw features, indoor mapping is pretty straightforward.
Take some time to think of how you could use this, to model your home or office. Perhaps you could use the indoor maps, in conjunction with other Leaflet functionality, to create heat flow maps or energy use per room maps. Perhaps you could create your own office scheduling application.
I should mention: if you want to work on custom indoor maps but don’t feel like designing them yourself, WRLD offer an indoor mapping service, for a fee. I haven’t experimented with the higher tiers of service and functionality, but it appears WRLD are quite flexible with regards to how the 3D indoor maps are made public (for things like stadiums and airports) vs. private (for things like hospitals and schools). Following this tutorial, they’ve also told me they’re looking to simplify the documentation and workflow for indoor map making. It’s a bit detailed at the moment, but well worth the results if you ask me. Imagine if it was even easier to do…
We’re at the end of our WRLD journey. It has become one of my favorite embeddable services. It’s fun to work with and can be quite detailed and flexible. What’s more, I haven’t paid a cent to use it. I hope you’ve had as much fun following these tutorials as I have had writing them. Let me know what you’ve built on Twitter. You can also contact WRLD with questions or to show them what you’ve built.
Frequently Asked Questions (FAQs) about Building an Indoor Office Map
What are the benefits of creating an indoor office map?
An indoor office map can significantly improve the efficiency and productivity of an office environment. It provides a visual representation of the office layout, making it easier for employees and visitors to navigate the space. It can also help in space management, allowing you to optimize the use of available space. Furthermore, it can aid in emergency planning, providing clear evacuation routes and locations of safety equipment.
How can I create an indoor office map using WRLD?
WRLD is a powerful tool that allows you to create interactive 3D maps. To create an indoor office map, you first need to sign up for a free WRLD account. Then, you can use the WRLD Indoor Map Designer to upload your floor plans and create your 3D map. You can add points of interest, such as meeting rooms or restrooms, and customize the appearance of your map.
Can I integrate my indoor office map with other software?
Yes, WRLD provides a range of APIs and SDKs that allow you to integrate your indoor office map with other software. This can enable you to create a fully interactive office environment, integrating with tools such as room booking systems or asset tracking software.
How can I update my indoor office map?
Updating your indoor office map is straightforward with WRLD. You can use the Indoor Map Designer to make changes to your map, such as adding or removing points of interest, changing the layout, or updating the appearance. Any changes you make will be automatically reflected in the live version of your map.
Can I use an indoor office map on mobile devices?
Yes, WRLD supports both iOS and Android, allowing you to use your indoor office map on a range of mobile devices. This can be particularly useful for employees or visitors who need to navigate your office space on the go.
What are the alternatives to WRLD for creating an indoor office map?
There are several alternatives to WRLD for creating an indoor office map, including SmartDraw, OfficeMaps, and yarooms. These tools offer a range of features, such as drag-and-drop design, integration with other software, and customizable appearance.
How can I make my indoor office map more interactive?
There are several ways to make your indoor office map more interactive. For example, you can add clickable points of interest that provide more information when clicked. You can also integrate your map with other software to provide real-time updates, such as room availability or asset location.
Can I use an indoor office map for emergency planning?
Yes, an indoor office map can be a valuable tool for emergency planning. You can use it to clearly mark evacuation routes and the locations of safety equipment, such as fire extinguishers or first aid kits. This can help to ensure that everyone in the office knows what to do in the event of an emergency.
How can I optimize the use of space with an indoor office map?
An indoor office map can help you to visualize the use of space in your office, allowing you to identify areas that are underutilized or overcrowded. You can then make changes to your office layout to optimize the use of space, improving efficiency and productivity.
Can I share my indoor office map with others?
Yes, WRLD allows you to share your indoor office map with others. You can provide a link to your map, or embed it in a website or app. This can be particularly useful for helping visitors to navigate your office space, or for collaborating with colleagues on office planning.
 Christopher Pitt
Christopher is a writer and coder, working at Over. He usually works on application architecture, though sometimes you'll find him building compilers or robots.