
Debugging Async Code: Parallel Stacks for Tasks
In the last async debugging blog post, we explored several tools in Visual Studio to help you debug your async code. One of the tools we discussed was the Parallel Stacks window for Tasks (or Parallel Tasks), a tool that provides task and thread information while debugging. Unlike the tabular Task and Thread windows, this information is presented graphically, displaying the relationships between threads and tasks, like an illustrative version of a call stack. In the latest version of Visual Studio, we’ve made some major improvements to the Parallel Tasks window for .NET applications, so let’s do a deep dive into the updated feature!
The code we’ll be using to demonstrate the Parallel Tasks tool can be found at this in-depth Microsoft documentation walkthrough on async debugging tools.
Why use the Task View in the Parallel Stacks window?
The “magic” of asynchronous programming in .NET can be both a blessing and a curse. The additions of the Task type, async, and await in .NET provide an extra layer of abstraction, which enable you to write responsive applications but also make it harder to navigate through and understand the status of each awaiting or active task while debugging. The Parallel Stacks window (Debug > Windows > Parallel Stacks, select “Tasks” dropdown) is a great way to help you visualize and better navigate through the execution of your async code.
It’s common to break up the async code into blocks that are scheduled after another piece of code is completed. The Threads view in the Parallel Stacks window can tell you when a code block isn’t running on a thread. Unlike the Tasks view, however, it won’t help you determine why a code block isn’t running.
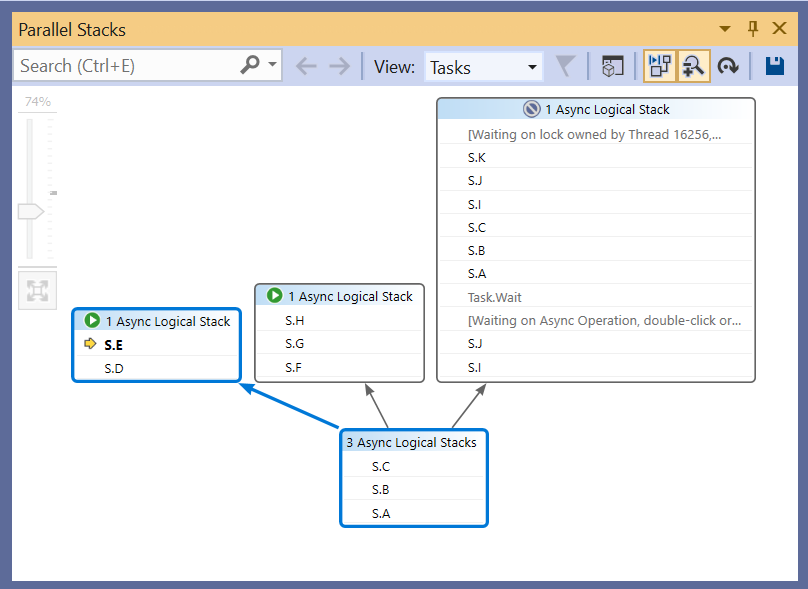
An awaited Task and the code scheduled to run after it don’t share a direct caller-callee relationship (such as a call stack on a thread). Instead, they have a “logical” relationship. This is where each piece of code knows about the next scheduled block, creating a “logical stack”. Figure 2 shows three tasks sharing a call stack at the start of the program, thus sharing the same box.
If an async method is “active” (i.e. it is running on a thread), these logical stacks are sometimes displayed in the Threads view. However, the Tasks view will show both active and awaiting logical stacks. This is helpful for debugging hangs or figuring out why your particular task or code block is not running.
How is the new Parallel Tasks window structured?
At any given program state, tasks sharing the same logical call stack are grouped into boxes/nodes. These nodes reveal how many tasks are doing the same operations before branching out to different functions. As a result, this grouping can provide a clearer picture of the whole program’s state.
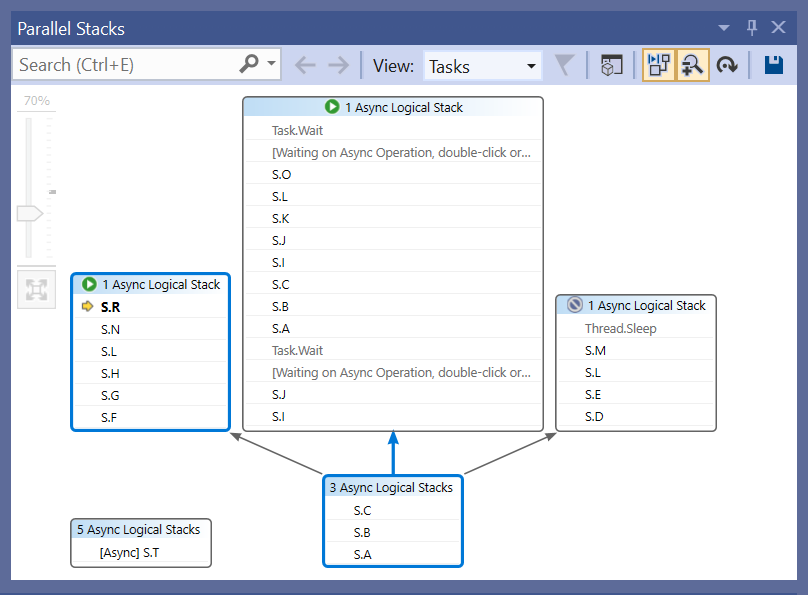
By default, Parallel Tasks displays a top-down display for task progression, branching from the most recent function call to the initial caller. Using the reverse layout button in the Parallel Task window’s toolbar gives you a bottom-up display for task progression. This reverse layout shows tasks branching from an initial caller to the most recent function call. In Figure 3, three tasks branch from function S.C to three different call stacks, with their most recent calls being S.R, S.O, and S.M, respectively.
What else is new in the Parallel Tasks Window?
Hovering over each line in the window and view the tabular representation of all the tasks currently in that method. Like the Task Window, this table lets you view the status, ID, duration, and more specific info of each Task. Selecting a task will now direct you to its corresponding async call stack. You can use this call stack to navigate to related code and inspect local variables within your async methods.
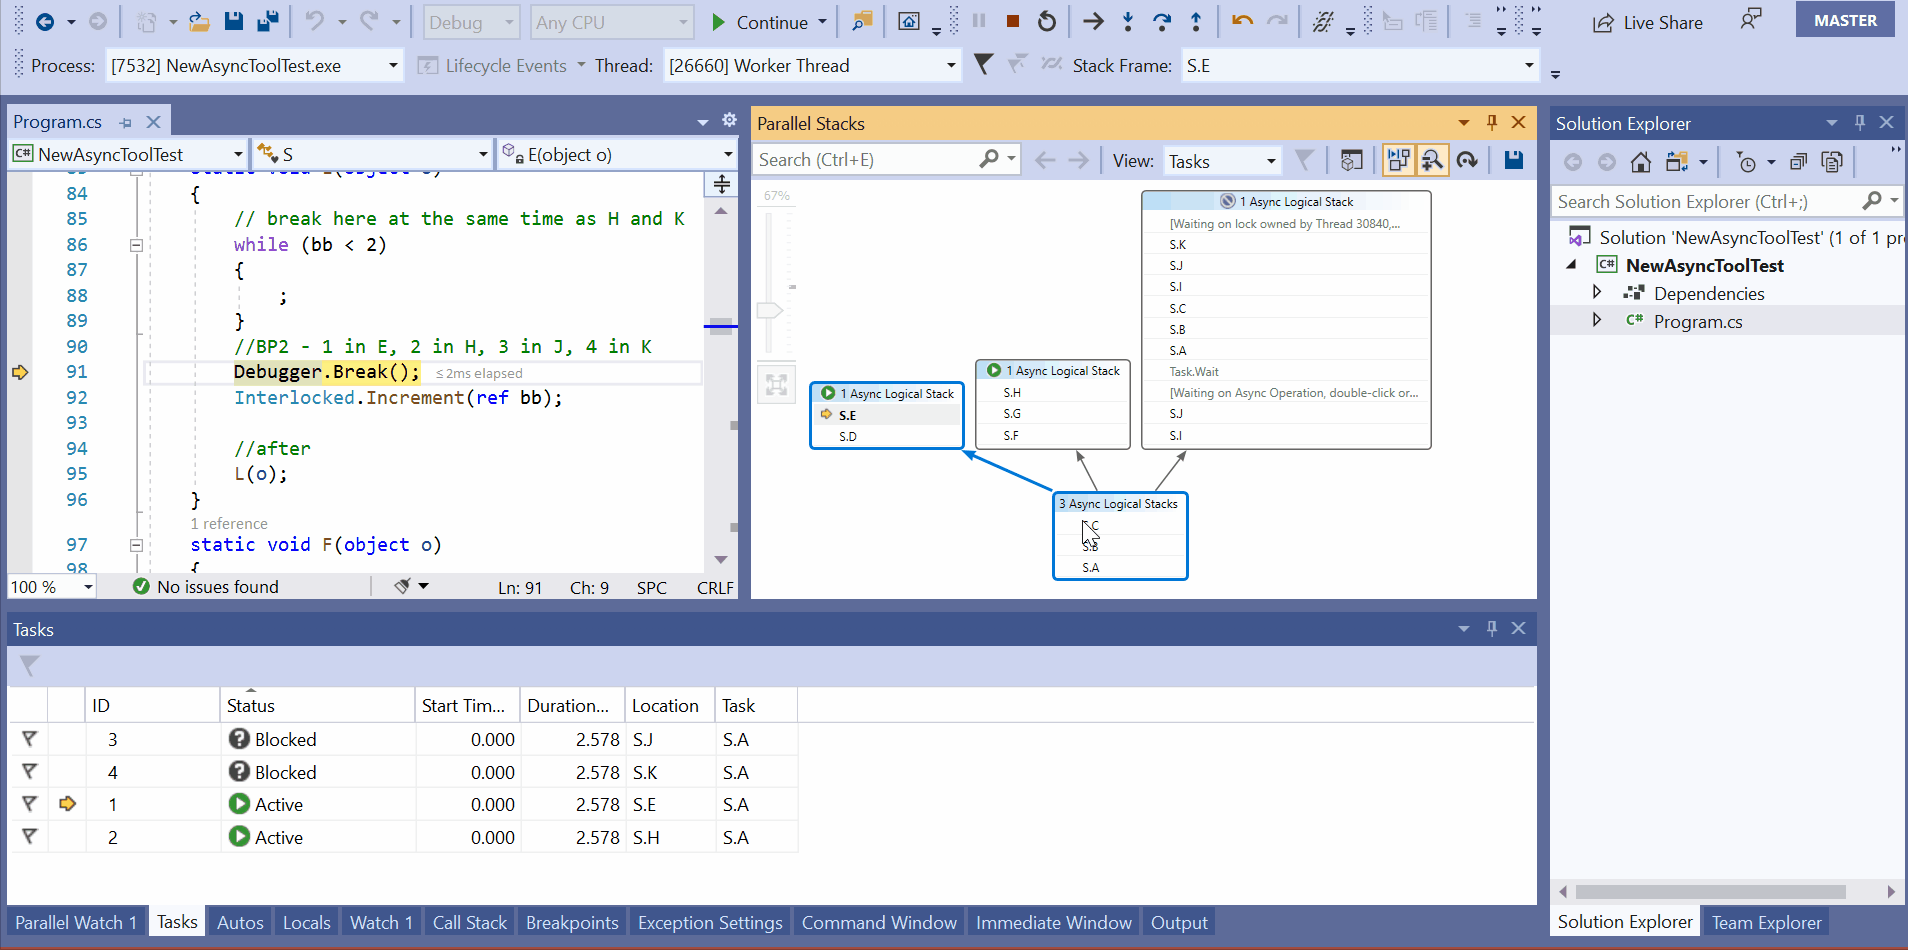
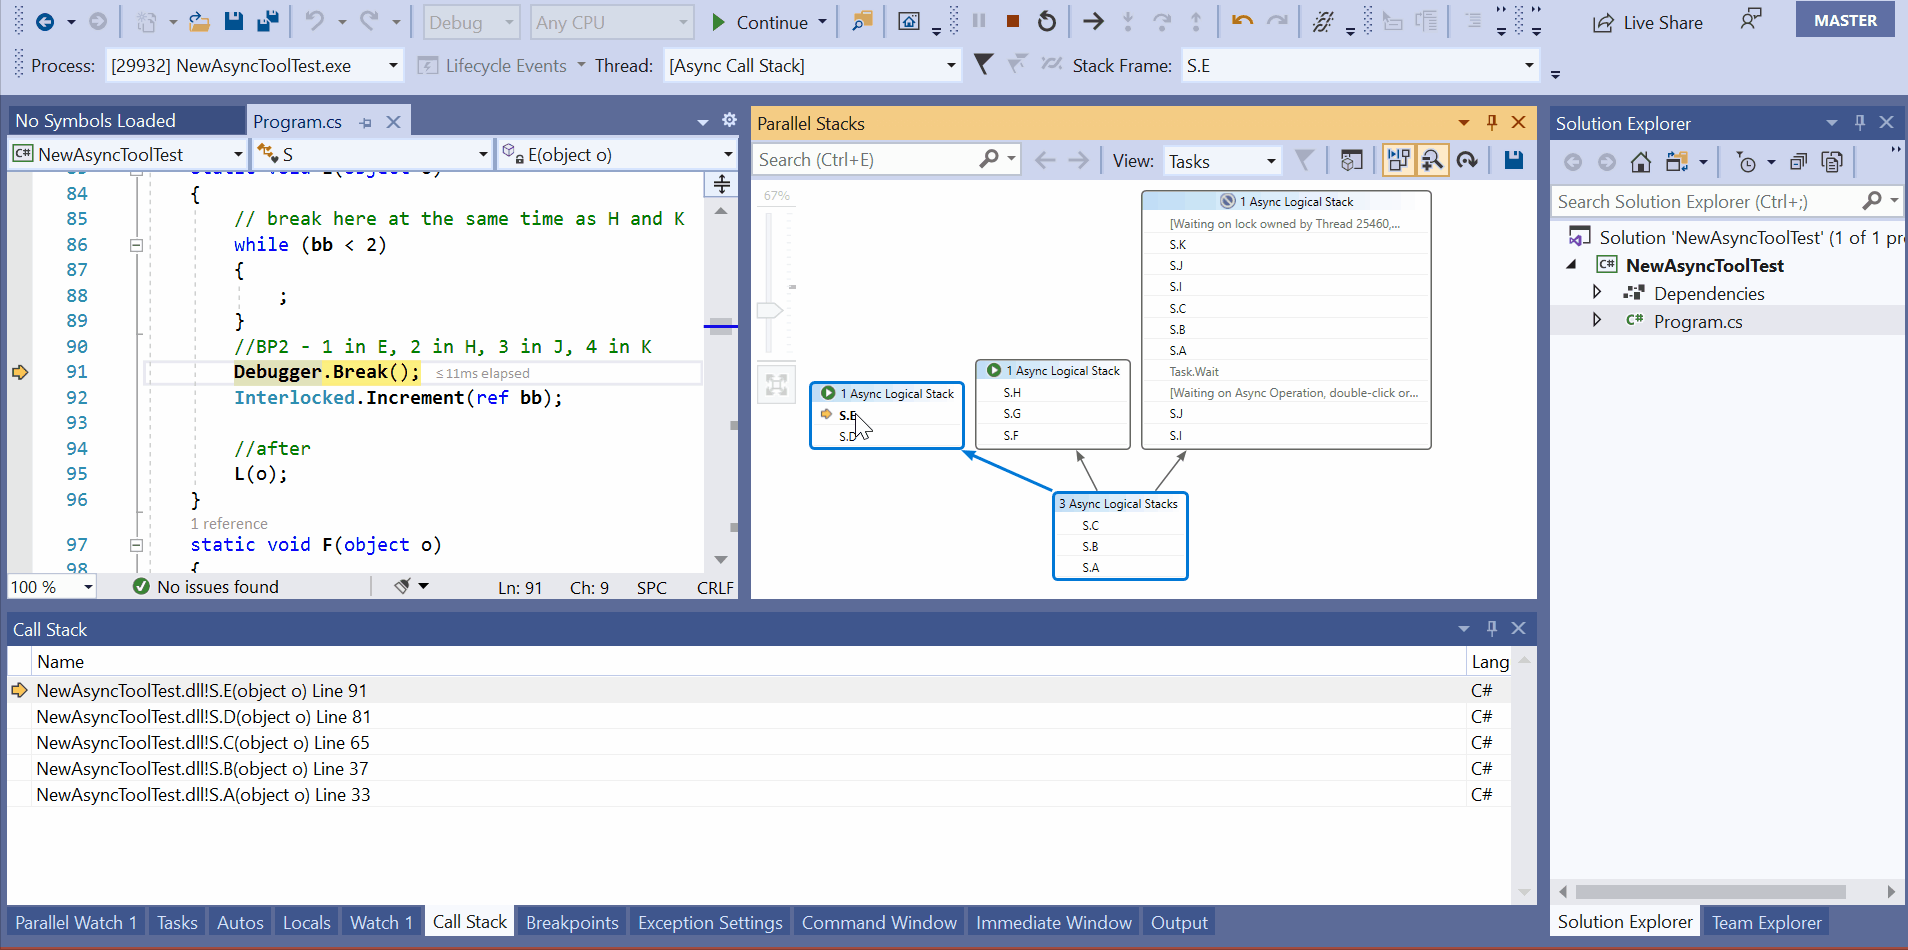
For multi-threaded applications, you may want to navigate between a specific task and the thread running that task. Now, you can quickly jump between tasks in the Tasks View and their corresponding threads in the Threads View via the context menu.

You’ll also receive notifications about tasks waiting on locks owned by specific threads or threads waiting on specific async operations to complete. When this happens, you can double-click the notification to navigate directly to that thread or task.
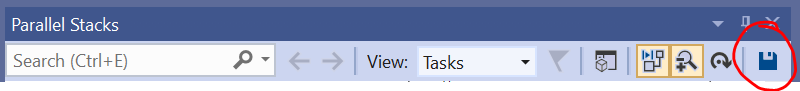
Finally, you can save the Parallel Stacks window contents as a PNG file using the save icon in the window’s toolbar.
Ready to try the new and improved Parallel Tasks window while debugging your asynchronous code? Give us your feedback!
There are still plenty of improvements we can make in future versions of this tool. Your feedback will help us do that! If you’d like to share your experience using the improved Parallel Stacks tool or debugging async code in general, please complete this survey.
 Light
Light Dark
Dark
2 comments
how to solve xamarin project libraries issues on creating project in Visual Studio
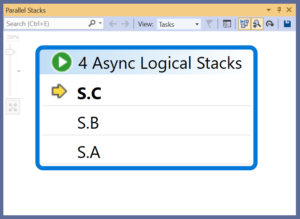
Thank you. It says, “Figure 2 shows four tasks sharing…”. Should that say Figure 1? Or “three tasks sharing”?