Drawing SVG Graphs with Rust
Using tera to draw SVG graphs with rustrust lorikeet 2020-05-22
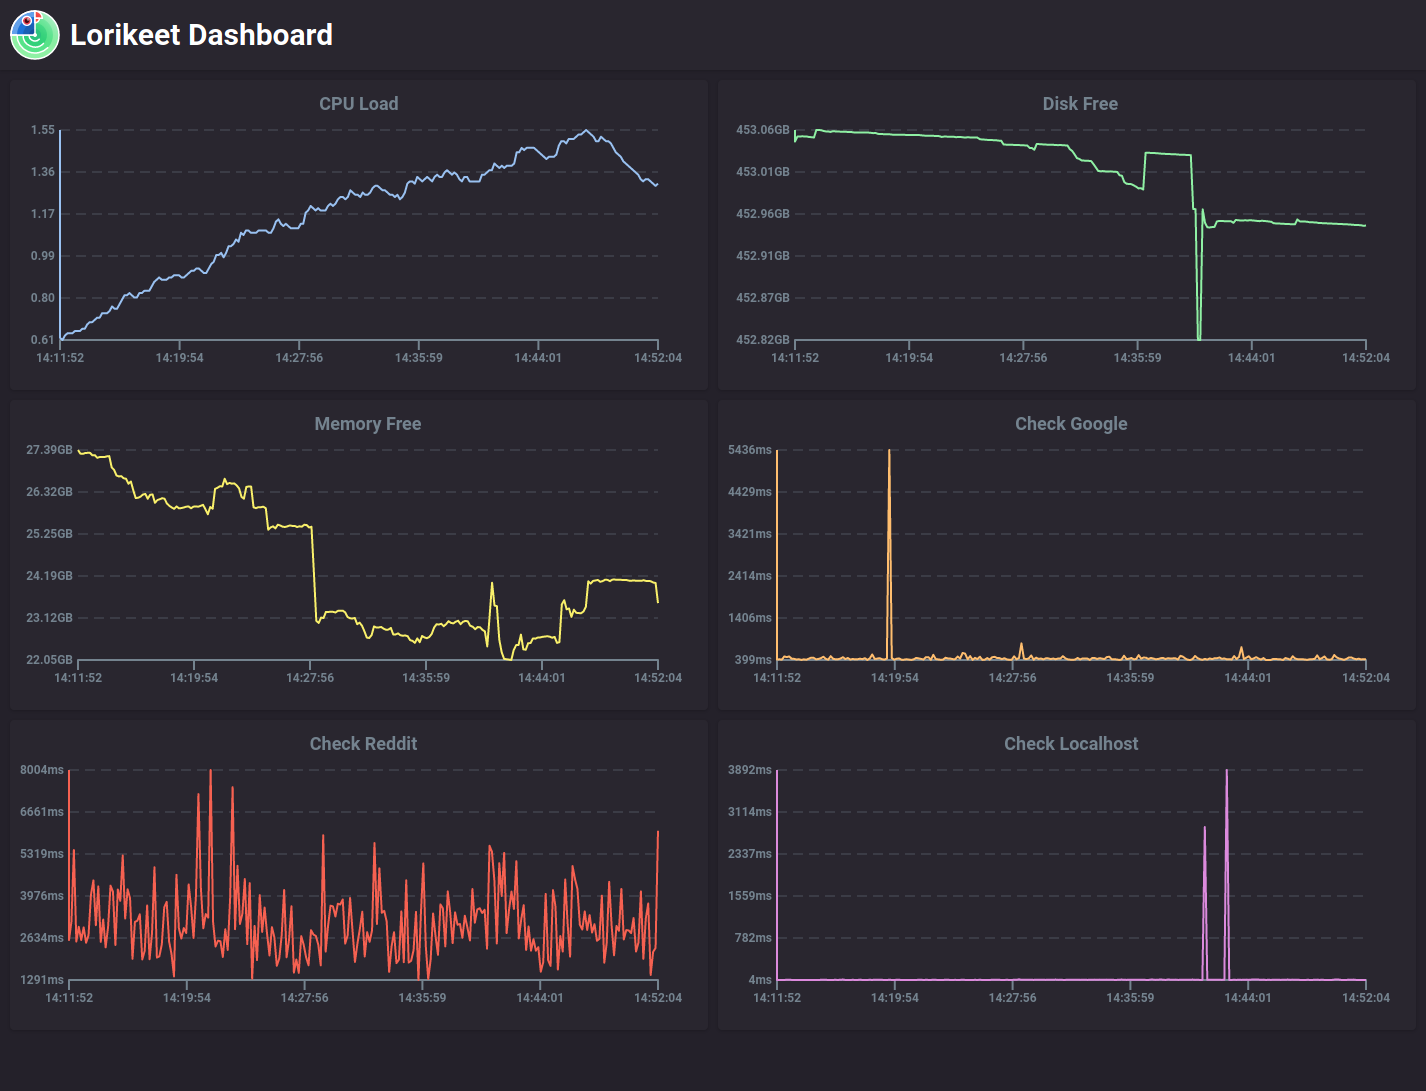
I have just released the first version of lorikeet-dash and part of that exercise was to find out a way to draw SVG graphs using rust.
I thought my findings & approach may be useful for others looking to do the same thing and so I have documented the design evolution in this blog.
Here's what the end result looks like in the lorikeet-dash project:
Defining the Graph
First we want to define what a graph is. A minimal example of what a graph would have is:
- A List of Points
- A Name/Description
- A Colour for the line
So, in a rust struct, this would look like the following:
#[derive(Clone, Debug)]
pub struct Graph {
    pub name: String,
    pub points: Vec<Point>,
    pub colour: String
}

#[derive(Clone, Debug, Copy)]
pub struct Point {
    pub x: f64,
    pub y: f64,
}
Let's add some initial helper methods, one to create a new graph, and another to add points to it:
impl Graph {
    pub fn new(name: String, colour: String) -> Self {
        Graph {
            name,
            points: Vec::new(),
            colour,
        }
    }
    pub fn add_point(&mut self, x: f64, y: f64) {
        self.points.push(Point { x, y });
    }
}
SVG Template
An SVG image is an XML file, which means that we can use standard templating engines to generate SVG with some parameters. I am going to use tera in this example, as lorikeet already uses it. You could, however, use any template engine.
Let's start with a simple SVG template, of which just simply draws the graph name:
<?xml version="1.0" standalone="no"?>
<svg
  width="100%"
  height="100%"
  viewBox="0 0 {{height + padding * 2}} {{width + padding * 2}}"
  preserveAspectRatio="xMidYMid meet"
  xmlns="http://www.w3.org/2000/svg"
  >
  <text
    x="{{width/2 + padding}}"
    y="{{padding / 2}}"
    font-family="-apple-system, system-ui, BlinkMacSystemFont, Roboto"
    dominant-baseline="middle"
    text-anchor="middle"
    font-size="18"
    fill="#74838f"
    font-weight="700"
    >
    {{name}}
  </text>
</svg>
Let's visit some decisions I have made here:
- We are including a
width&heightfor the viewbox. Having the SVG display at its natural resolution increases the clarity of the line, so we'll allow them to be adjusted when generating an SVG. - There is a
paddingvalue to include around the graph so that axis labels and the name of the graph will fit on the SVG. To make things simple this can be hardset to a value such as50. We'll subtract that x 2 from the provided width/height. - We're using a big
font-familylist which should display roughly similar fonts depending on your OS.
With our tera template svg ready, we can use the include_str macro to have this compiled in:
Tera::one_off(include_str!("graph.svg"), &context, true).expect("Could not draw graph")
Drawing the Name
We'll add a draw_svg(&self, width: usize, height: usize) method to the Graph struct which should start by drawing the name as per the above template. The arguments are simply the width & height to draw. To ensure that the viewbox of the svg comes out the right size, we'll subtract the padding from both x 2.
To put it another way, the width and height become the width and height of the graph itself rather than the SVG.
pub fn draw_svg(&self, width: usize, height: usize) -> String {

    let mut context = Context::new();

    //hardset the padding around the graph
    let padding = 50;

    //ensure the viewbox is as per input
    let width = width - padding * 2;
    let height = height - padding * 2;

    context.insert("name", &self.name);
    context.insert("width", &width);
    context.insert("height", &height);
    context.insert("padding", &padding);

    Tera::one_off(include_str!("graph.svg"), &context, true).expect("Could not draw graph")

}
The Context here is what tera uses to provide variables to a template. Anything that implements serde::Serialize can be put into the context. At this moment we're providing a few strings and width/height parameters.
This can be run to spit out an SVG:
fn main() {
    let graph = Graph::new("Example".into(), "#8ff0a4".into());

    println!("{}", graph.draw_svg(800, 400));
}
Running this, should output the following SVG:
Drawing the Points
Let's fill up the graph with some dummy points so we have something to draw (note: we are assuming you'll add the points in order here):
graph.add_point(1.0, 1.0);
graph.add_point(2.0, 3.0);
graph.add_point(3.0, 2.5);
graph.add_point(4.0, 6.0);
graph.add_point(5.0, 3.0);
Scaling the Axis
To keep things simple, we'll start from the origin & scale both the x and y axis by the max value of either. We'll pull out both of those values and use these to scale the points within the svg:
let max_x = self
  .points
  .iter()
  .map(|point| point.x)
  .fold(0. / 0., f64::max);

let max_y = self
  .points
  .iter()
  .map(|point| point.y)
  .fold(0. / 0., f64::max);
Drawing a Line
To draw a line between points in an SVG, you can use the path element with draw commands. A simple line would look like:
<path d="M10 10 L15 15"/>
That is: move to point 10,10 and then draw a line to point 15,15. These points are in the SVG space, so we will need to translate our graph points onto this space, keeping in mind padding, width and height and scaling.
Translating the points
We want to draw a line between each of the points in the SVG but scaled to fit within the viewport.
To add another complication, the chart origin is in the bottom left, whereas the SVG origin is the top left.
For both the x and y axis, we want to scale down based upon the max value (width and height here are the chart width):
x = x / max_x * width
y = y / max_y * height
For the x axis, we need to shift them along the right based upon padding, otherwise they will sit on the left side of the svg:
x = x / max_x * width + padding
For the y axis, we want to flip this based upon the height, to translate the origin, then add height + padding:
y = y / max_y * (height * -1.0) + height + padding
Iterating through
We have our points commands, now let's iterate through and convert them to a bunch of draw commands. First we will use M to move to start drawing, then we will use L to draw a line between each.
We can use enumerate() on the iterator to get whether this is the first or subsequent value, and then join it together as a big string:
let path = self
    .points
    .iter()
    .map(|val| Point {
        x: (val.x / max_x * width as f64) + padding as f64,
        y: (val.y / max_y * (height as f64 * -1.0)) + (padding + height) as f64,
    })
    .enumerate()
    .map(|(i, point)| {
        if i == 0 {
            format!("M {} {}", point.x, point.y)
        } else {
            format!("L {} {}", point.x, point.y)
        }
    })
    .collect::<Vec<String>>().join(" ");
This will output a path string like so:
M 190 383.33333333333337 L 330 250 L 470 283.3333333333333 L 610 50 L 750 250
Adding to the SVG
We can add the path & colour to the Context:
context.insert("path", &path);
context.insert("colour", &self.colour);
Then add the following to have it drawn in the SVG:
<path stroke="{{colour}}" stroke-linejoin="round" d="{{path}}" stroke-width="2.0" fill="none" />
If all goes well, the graph should start looking more like a graph:
Adding in the Axis
We need to add in some axis scale so we know what the graph values represent. I'm gonna cheat here & break up both the x and y axis the same amount of times each. We'll break up the axis 5 times each, but have this set in the context to be changes later:
context.insert("lines", &5);
Tera allows us to do a loop within the template, so we'll use that to add some lines and nudges.
{% for i in range(end=(lines + 1)) %}
... draw some lines here
{% endfor %}
Let's set some variables within the template, based upon the current line we're drawing. These are the offsets for both the axis:
{% set offset_x = padding + loop.index0/lines * width%}
{% set offset_y = padding + loop.index0/lines * height%}
Horizontal Lines
We will draw 5 horizontal dashed lines, to give scale to the y value. This will start on the left side of the graph and continue to the end of the graph. We'll draw a solid horizontal line when y = 0 (keep in mind the axis is flipped in SVG), which means we skip drawing this for the last line:
{% if loop.last == false %}
<path stroke="#74838f" stroke-dasharray="10 6" stroke-width="0.5"  d="M {{padding}} {{offset_y}} L {{width + padding}} {{offset_y}}" />
{% else %}
<path stroke="#74838f" stroke-width="2" fill="none"  d="M {{padding}} {{offset_y}} L {{width + padding}} {{offset_y}}" />
{% endif %}
Now our graph will be a bit easier to read:
Vertical Lines
We will just put little 10px nudges in the axis rather than dotted vertical lines.
In the existing for loop, we can add the following:
<path stroke="#74838f" stroke-width="2.0" d="M {{offset_x}} {{height + padding}} L {{offset_x}} {{height + padding + 10}}" />
This will create nudges where we'll put our axis labels:
Axis Labels
We can add in axis labels in the same for loop.
For the y-axis, the loop starts at the top of the graph and goes down, so we will use the following formula to present the 1/5th value:
(lines - loop.index0)/lines * max_y
We can use the tera round helper to round the value up, so there is not a lot of decimal places:
{{((lines - loop.index0)/lines * max_y) | round}}
Putting this together:
<text
  x="{{padding - 5}}"
  font-family="-apple-system, system-ui, BlinkMacSystemFont, Roboto"
  y="{{offset_y}}"
  dominant-baseline="middle"
  text-anchor="end"
  font-size="12"
  fill="#74838f"
  font-weight="bold"
 >
 {{((lines - loop.index0)/lines * max_y) | round}}
</text>
And quite similarly, the x-axis can be generated the same way (width y being fixed to where the nudge starts & x being the offset):
<text
  x="{{offset_x}}"
  font-family="-apple-system, system-ui, BlinkMacSystemFont, Roboto"
  y="{{height + padding + 10}}"
  dominant-baseline="hanging"
  text-anchor="middle"
  font-size="12"
  fill="#74838f"
  font-weight="bold"
 >
 {{loop.index0/lines * max_x | round}}
</text>
Putting this all together, we should have our labels in the right place:
Bonus: Smooth Lines
One trick I have found is that you can make simple smoth lines by treating the points as a Catmull-Rom spline, and then converting to Cubic Beziers, which SVG will draw happily.
Using this method, you can make your charts nice and smooth:
Second Bonus: Scuba Dive Graph
I have also used a similar method to plot a dive, displaying the Depth and Air on a split axis, with my maximum depth displayed:

Conclusion
We used tera, as a template engine, to generate an SVG chart with rust. Some basic geometry was needed, but the results show for themselves. I hope you have found this educational and gives you some ideas.
Also: try out lorikeet-dash and let me know what you think!