
One Chart to Rule Them All
With the release of Couchbase Autonomous Operator 2.0, the Couchbase Operator and Cluster charts have been consolidated into a single chart. This streamlined approach means it’s now possible to install Autonomous Operator, Admission Controller, Couchbase Cluster, and Sync Gateway with a single command.
Improved CustomResource Installation
The new Couchbase Chart now installs all of the CustomResourceDefinitions (CRDs) that are managed by the Autonomous operator. This is an improvement to the previous release which required users to install the CRD’s as a separate step prior to installing the Couchbase Chart.
Getting Started
To quickly deploy the admission controller and Operator, as well as a Couchbase Server cluster:
Add the couchbase chart repository to helm:
|
1 2 |
$ helm repo add couchbase https://couchbase-partners.github.io/helm-charts/ $ helm repo update |
Install the Chart:
|
1 |
$ helm install default couchbase/couchbase-operator |
See Couchbase Helm Documentation for more information about customizing and managing your charts.
Prerequisites
Throughout this blog, we’ll use example charts from the Couchbase Partners github repository. Before proceeding, let’s clone the repo:
|
1 |
$ git clone https://github.com/couchbase-partners/helm-charts |
Also, Helm 3.1+ is required when installing the official Couchbase Helm Chart.
|
1 2 3 4 |
# linux wget https://get.helm.sh/helm-v3.2.1-linux-amd64.tar.gz tar -zxvf helm-v3.2.1-linux-amd64.tar.gz mv linux-amd64/helm /usr/local/bin/helm |
Follow Helm’s official steps for installing on your particular operating system.
Monitoring with Prometheus
Couchbase server metrics can be exported to Prometheus and organized into various dashboards within Grafana. Helm makes it very easy to get started with a Couchbase-Prometheus stack since it’s possible to bundle several components into a single chart.
The monitoring chart has dependencies for Prometheus and Grafana, and since we’re installing directly from a github repository, the first step is to build the chart:
|
1 |
$ helm dependency build couchbase-prometheus/ |
Now the chart is ready to be installed. The following command creates a Couchbase Cluster with each node exporting metrics to Prometheus:
|
1 |
$ helm install monitor couchbase-prometheus/ |
The install returns some information about managing the chart along with commands to run for viewing the grafana dashboard. You should see:
|
1 2 3 4 5 6 7 8 9 10 11 12 13 14 |
NAME: monitor NAMESPACE: default STATUS: deployed ... == Monitoring # Prometheus kubectl port-forward --namespace default prometheus-monitor-prom-prometheus-0 9090:9090 # open localhost:9090 # Grafana kubectl port-forward --namespace default deployment/monitor-grafana 3000:3000 # open localhost:3000 # login admin:admin |
Run the port-forward command for Grafana to view the Couchbase Metrics:
|
1 |
$ kubectl port-forward --namespace default deployment/monitor-grafana 3000:3000 |
Now open http://localhost:3000 and log in as admin:admin. Click on the Couchbase link in the dashboards sections:
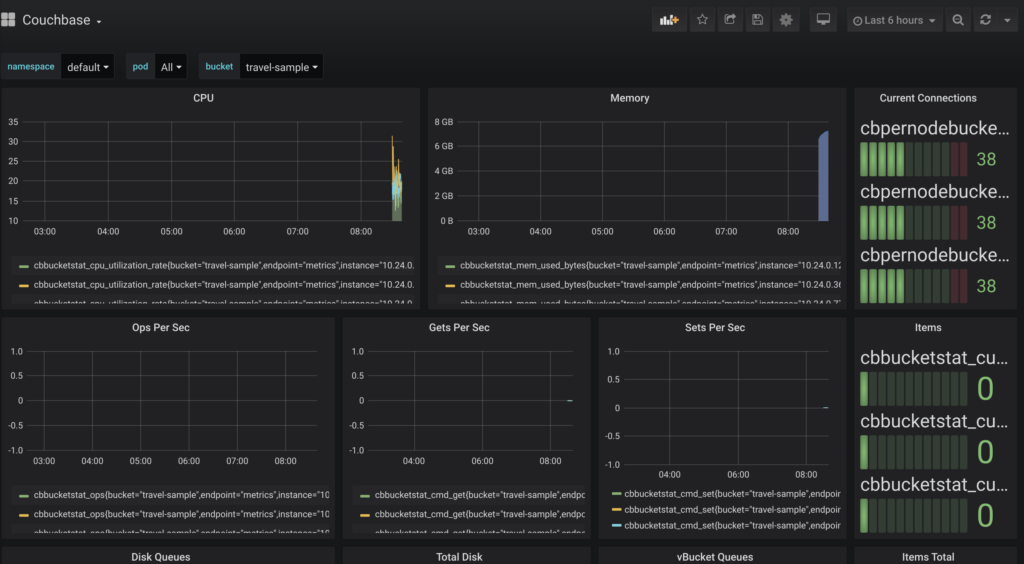
couchbase in grafana
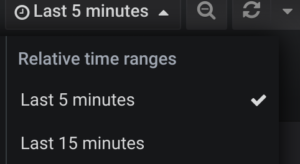
Change the time range from 6 hours to 5 minutes. This helps to visualize updates that occur within the first few minutes of monitoring:
Now populate the cluster with the sample travel data:
|
1 |
kubectl create -f couchbase-prometheus/travel-sample.yaml |
You should see set operations along with the number of items increasing in the Dashboard. Refer to the Couchbase Exporter repository to discover additional statistics that can be added for further customizing the dashboard.
What Next
Additional tutorials and blogs exists have been written by Daniel Ma.
Also, check out the documentation for the Couchbase Helm Chart to see additional ways Couchbase can be customized for your deployment.
Acknowledgments
Thanks to Daniel Ma & Matt Ingenthron for contributing to this post.
Hi Tommie, Thanks for sharing this
In your view, what would be the key metrics to monitor for auto/manual scaling of couchbase cluster, especially in a cloud env.
Regards
Thanks Purav,
The answer really varies on what your application objectives are, but in general it’s always good to check bucket quota % used. When that value approaches 80% or the high-water marks the cluster will begin ejecting items to disk which will lead to fetches that can cause latency.
For query workloads, you could collect stats and calculate the 99th percentile value of long-running queries as an indication of performance issues.