This investigation started, as so many of mine do, with me minding my own business, not looking for trouble. In this case all I was doing was opening my laptop lid and trying to log on.
The first few times that this resulted in a twenty-second delay I ignored the problem, hoping that it would go away. The next few times I thought about investigating, but performance problems that occur before you have even logged on are trickier to solve, and I was feeling lazy.
When I noticed that I was avoiding closing my laptop because I dreaded the all-too-frequent delays when opening it I realized it was time to get serious.
Luckily I had recently fixed UIforETW’s circular-buffer tracing to make it reliable, so I started it running and waited for the next occurrence. It didn’t take long.
It took me a few tries to get an ETW trace that I was completely happy with. And, since this was unfamiliar territory it took me a while to understand what was happening. I still don’t have a complete understanding of the problem, but I understand it 90% of the way. I learned a lot, including some new details of the Windows scheduler, and I found a completely effective mitigation
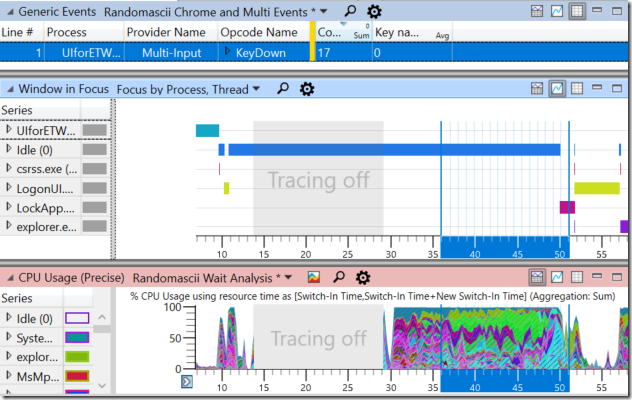
The perfect trace that I finally recorded looks like this when loaded into Microsoft’s Windows Performance Analyzer (WPA):
This table and two graphs contain a wealth of information. The table at the top (Generic Events) is showing keystrokes, as recorded by UIforETW. I tried to tap the control key (virtual key code 162) once a second until the password input field appeared. Because these 17 keystrokes are selected they show up as vertical blue lines in the graph below, for easier visualization of when critical events happened. The x-axis is time, in seconds.
The horizontal bars in the top graph (Window in Focus) show which process had focus over time, moving between six different processes. The Tracing off period represents the brief time when my laptop was closed.
The bottom graph shows CPU usage. This is obtained by context switch data so it should be complete and accurate. In this trace a value of 100% indicates where all eight logical processors on my four-core eight-thread laptop were in use.
With the data in this trace my task was to make sense of what my laptop does in the shadows, when the lid is closed and before I have logged back on.
The storm before the calm
You can see that my laptop was relatively idle at the beginning of the trace, as it should be. Then I closed the laptop lid. This seems to have triggered a flurry of CPU activity and window focus changes. Window in Focus changed from UIforETW to Idle, to csrss, back to Idle, to LogonUI, and then back to Idle. Who knew?
During this time my laptop did about 17 CPU seconds of processing, of various types. Some of this is necessary work for shutting down. Some of it is programs (including some internal Google tools) that have registered in Task Scheduler to run “On workstation lock of any user” – who knew? I even noticed work being done to create the UI elements for logging on when the user resumes – might as well get ready early, right?
17 seconds of CPU time seems like a lot for putting my laptop to sleep. Even on my four-core/eight-thread laptop this takes more than four seconds. On my home laptop it’s still more than 13 seconds of CPU time to go to sleep, almost all from Windows code. Does the Diagnostic Policy Service really need to do a couple of SruDbTableSearches before my laptop can get some rest?
I think that this excessive work when going to sleep is a problem, but it is not the problem that I am looking for. So, I reluctantly turned my eyes away.
I only realized much later that it was during this time that the seeds of destruction for this bug were planted…
Night time
While my laptop was suspended there was no CPU activity. On this particular test my laptop was only suspended for about 16 seconds.
Fitfully awakening
The CPU activity when my laptop was going to sleep was nothing compared to when it was waking up. During this time my poor overloaded laptop did about 172 CPU seconds (!!!) of processing, over a 22.6 second period. That’s a lot of work.
One mystery about this is why CPU usage drops to almost zero for around a second after an initial burst of business. This brief idleness seems quite anomalous given the surrounding chaos. But, I think that is an unrelated quirk, so I turned my eyes away.
Another mystery is why so many programs spring to life after this brief pause. Ironically the biggest offender, responsible for 31.6 of the 172 CPU seconds, is Windows Performance Analyzer (WPA), the very program I am using to analyze these traces. The three copies which I left running seem to be trying very hard to render their UI, despite the fact that it isn’t visible yet.
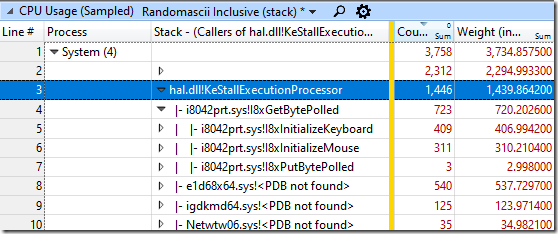
There are also some dark patterns going on as my laptop tries to initialize devices. KeStallExecutionProcessor is a busy wait and it was weird to see it as the single most executed function on my entire system. Is a second or more of busy waiting really the only way to get my hardware going? Should it really take 700 ms of CPU time to initialize my mouse and keyboard? Should Microsoft and Intel really be ignoring Microsoft’s max-50-microseconds advice?
Ultimately there are a lot of programs spinning very hard. Most of them seem to be hitting the same problem as WPA – trying desperately to put pixels on a hidden screen – which suggests a Windows bug. Even without that bug explorer.exe, and others, sure are eager to do something. But, ultimately, while this excess CPU usage is a necessary part of this problem, it is not the problem. So, again, I turned my eyes away.
Focus
When analyzing traces it is important to figure out when relevant things are happening. The input events were vital clues because I stopped tapping the control key when the password prompt appeared. You can see my last three control-key presses in the zoomed in Window in Focus graph below:
It looks like the critical events are that LockApp.exe gets focus and then almost immediately LogonUI.exe gets focus. Presumably I typed my password in to LogonUI.exe (conveniently not tracked by my keyboard hook, so that’s good) and then focus briefly went to explorer and then to UIforETW where I had started.
It also looks like LogonUI.exe can’t get focus until after LockApp.exe – this pattern repeated in all of the resume traces that I looked at.
Now, more than a thousand words into this mystery story, we finally have a well-formed question that we can investigate: why does it take twenty seconds after resume-from-standby before LockApp.exe gets focus?
We’ve got a question? Good, let’s answer it
Using the context-switch-derived CPU Usage (Precise) data I quickly found that LockApp.exe got less than one millisecond of CPU time in the first twenty seconds after resuming, and went for more than 14 seconds (from 35.158 s to 49.827 s) without running at all:
Documentation for the meanings of the columns in the CPU Usage (Precise) tables can be found here.
When a process or thread hasn’t run for a while and you want to find out why you can generally find the crucial clues on the first context switch after the long drought – the context switch at 49.827 s into the trace. I rearranged columns to show some more data for that context switch:
A count of one means that we are viewing data for a single context switch.
The Time Since Last of 38.2 million microseconds means that this thread has not run for 38.2 seconds. That, by itself, is neither good nor bad. Idle threads save power, and after all the laptop was asleep for a while.
The Switch-In Time just tells us exactly when the thread was put on CPU – when the context switch to this thread happened.
And now we get to the Ready column. This tells us how long the thread was ready to run, but wasn’t running. Put another way, this thread was waiting on something (a lock, or a handle) and that something was released or signaled, and yet the thread still did not run, for 19.493 seconds.
To get a better sense of the Ready (us) column we can look at the Ready Time (s) column. This tells us when the thread was readied. We can see that 30.333 s into the trace this thread was made ready to run but the thread didn’t actually run until 49.827 s into the trace. That seems important.
This arrangement of columns shows yet another view of the same context switch:
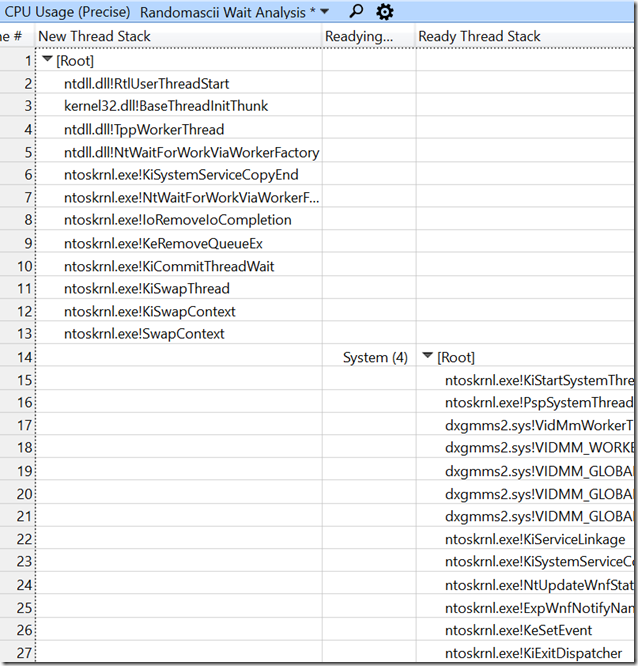
So, this thread (which the New Thread Stack shows was waiting on NtWaitForWorkViaWorkerFactory) was told to wake up (by the system process calling KeSetEvent) shortly after I opened my laptop lid, at 30.333 s into the trace. Instead of running then (which would be “good”) it didn’t run for 19.494 s, and that was bad.
Normally when doing wait analysis like this I spend a lot of time worrying about why a thread is waiting, and what stopped it from being readied. This was the first time I’ve done a wait analysis where that was not relevant and the question was instead “why did a readied thread not run.”
Duuude….
Most people don’t spend as much time staring at ETW traces as I do so I need to put this in context. This is really bizarre. When a thread is readied it will usually run immediately, or perhaps in a few milliseconds. Readying a thread means, as the name suggests, that the thread is ready to run, and there is little that can stop it. But let’s go through the things that can prevent a readied thread from running.
Thread priority
My initial assumption was that this was a simple case of CPU starvation. Dozens of processes wanted CPU time, and because of this LockApp wasn’t getting enough until things calmed down. This theory didn’t quite fit the symptoms however, because LockApp managed to go for about 18 seconds without getting any CPU time.
The nice thing about CPU starvation as a theory is that it is testable. I managed to raise the priority of the LockApp process using Task Manager (during one of the brief periods when it isn’t frozen by the UWP system) so the final trace that I used for this blog post had LockApp running at high priority. A normal Windows thread runs at around priority 8-10. The highest priority a normal (non-realtime) Windows thread can run is 15. My ETW traces showed that LockApp was always running at priority 13 or higher.
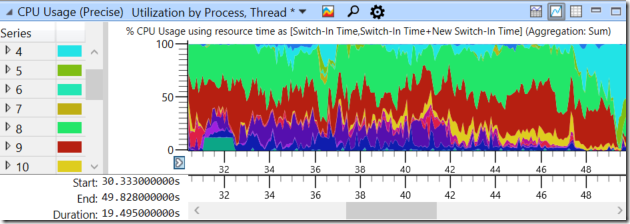
Here’s a graph of CPU time over the critical 19.494 seconds, grouped and colored by thread priority (New In Pri, the actual priority of the thread being scheduled). We can see that priority 4, 8, 9, and 10 threads consume most of the CPU time, especially at the end:
Here’s another view with the priority 0-12 threads hidden. Anytime this graph drops below 12.5% (representing one logical-processor-of CPU time on my eight thread laptop) then LockApp should definitely have run, and it simply defies plausibility to think that priority could have stopped it from running quite frequently when so many equal or lower priority threads were getting lots of time.
Priority inversion mitigations
One suggestion was that the Windows priority inversion algorithms could have boosted other threads enough to block LockApp.exe. But, since the graphs above show the actual thread priority used in scheduling decisions this (always tenuous) suggestion must be discarded.
Kernel stack swapped out
When I posed this puzzle on twitter one suggestion was that maybe the thread’s kernel stack was swapped out. This was not a situation that I was familiar with but after a bit of explanation from John Vert (he knows his stuff) I disabled kernel stack paging and rebooted. That made no difference. I really didn’t think it would, given that I have 32 GB of RAM and could reproduce the problem repeatedly and frequently, but it was good to be certain.
Process freezing
Since LockApp is a modern/UWP/name-du-jour app it is subject to restrictions similar to those imposed on smart-phone apps. Among other things this means it can be frozen when it is not in the foreground, and then thawed out when it comes back to the foreground. James Forshaw suggested recording the Microsoft-Windows-Kernel-Process ETW provider in order to get data on this.
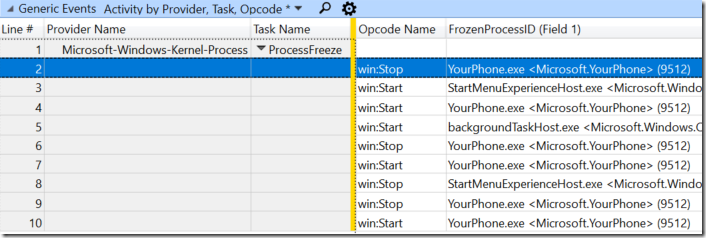
The events are designed for maximum confusion. The Task Name of Process Freeze is used for both thawing and freezing, with the win:Stop version of the event meaning that the process is starting (stop freezing) and the win:Start version meaning that the process is stopping (start freezing). This is intensely logical, but quite confusing. Separate event names for Freeze and Thaw would be less confusing.
There’s no documentation for these events, but with some analysis I determined that these events are always emitted by the Background Tasks/Broker Infrastructure Service. The name and process ID of the affected process are put in the FrozenProcessID field.
It was interesting to explore this provider – it has lots of promising sounding events – but ultimately it proved that LockApp was not getting frozen or thawed during the trace. However the provider seems useful enough that I changed UIforETW so that future versions will always record this provider.
Everything ruled out
None of the theories above seemed very likely to me in the first place, and now they were all ruled out. I reached out for help, asking a Microsoft friend for ideas. And this is when I found that the 0-31 thread priority that is so well known in Windows is actually just the low-priority five bits of the full priority system.
Pulling rank
It turns out that my ignorance was my own fault. If I had carefully read the 108 pages of the Threads section of Windows Internals, 7th Edition, Part 1 then I would have understood what was going on. Page 287 to 295 cover it if you want to jump ahead.
This ultra-priority field which I had been unaware of is called Rank. It shows up in WPA as a hidden-by-default column (you have to invoke the View Editor to find it) called NewThreadRank. Thread Rank takes precedence over priority when scheduling threads. Almost all threads are Rank 0, and a Rank-0 thread is always higher priority than a Rank-2 thread. With the NewThreadRank column enabled and at the left of the table we can can immediately see the problem:
LockApp.exe’s threads had a Rank of 2 and that means that they were, despite being priority 14, effectively the lowest priority on the system.
An explanation, mostly
Because LockApp.exe’s threads end up at Rank 2 they can only run when none of the Rank 0 threads want to run. Because (for unclear reasons) many apps were busily rendering their invisible screens they were fighting each other for every scrap of CPU time, leaving none for the higher ranks.. Once LockApp.exe got a tiny bit of CPU time it quickly got moved to Rank 0 (and the CPU load dropped) and the logon process ran normally.
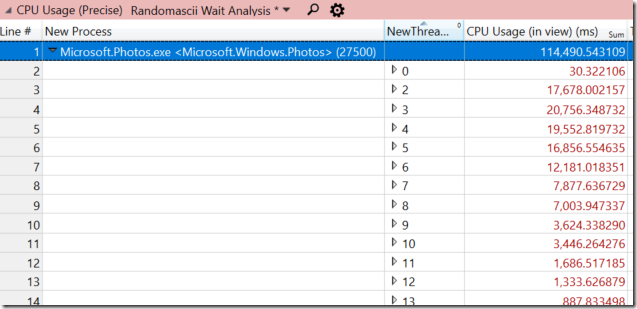
With this information in hand I looked to see how LockApp’s rank changed over time. In the last few seconds before my laptop went to sleep LockApp suddenly went from rank 0 to 2. Rank is supposed to be used to stop CPU hog processes from getting too much time, as when Windows Photos gets carried away with unwanted background processing and does a tour of ranks from 2 to 19:
The documentation suggests that the main purpose of thread rank is to fairly share CPU time between sessions on a machine, to stop one user’s processes from harming other users. Both of these variations on uses of rank suggest that a thread should only have its rank increased if it uses a lot of CPU time, and LockApp.exe used just 79.3 ms of CPU time while my laptop was going to sleep, while the rest of my system was using about 17 s of CPU time. And yet, somehow the OS decided to lower LockApp’s rank to 2 partway through the going-to-sleep process.
The OS will only change the rank of a thread if it belongs to a “scheduling group” (KSCHEDULING_GROUP) and most threads on a normal Windows install are not members. Therefore most threads aren’t subject to having their rank changed, so they can hog CPU time all that they want.
Remaining mysteries
It is, unfortunately, still unknown why LockApp.exe got demoted to Rank 2 before standby. I guess LockApp is in a scheduling group and I guess one of the algorithms went awry, but I haven’t found any APIs to investigate any of this, and my time is up anyway. Anyone who knows more details, please comment. The entire idea of using Rank as the most important component of scheduling decisions seems like it will inevitably break down if most of the processes on the system aren’t opted in – the threads that are in scheduling groups will always be at risk for dramatically losing out. Dynamic fair share scheduling (DFSS) seems doomed to failure if most threads don’t participate.
It is also unknown why so many apps were so busy after standby. The usual explanation of “lots of timers expiring after a laptop was on standby for hours” doesn’t really work when the laptop was only on standby for seconds, and the rendering behavior of WPA points to something going awry in the windowing system. Add in a few badly behaved apps and some busy-waiting drivers, and it all adds up to a lot of CPU time.
The CPU storm subsiding and LockApp running happening at the same time leads to the obvious explanation that LockApp could run once CPU demand dropped. But an equally compelling explanation is that once LockApp was able to run (or perhaps once LogonUI was able to run) the CPU demand dropped. Both explanations work, but I actually think that the second one is more predictive, since otherwise there is no explanation for why the seemingly-ceaseless WPA rendering would suddenly stop.
Mitigating the problem
Once I knew that LockApp.exe was a separate application that was struggling to run, and that raising its priority didn’t help I disabled it. This DisableLockScreen.reg file does the trick:
Windows Registry Editor Version 5.00
[HKEY_LOCAL_MACHINE\SOFTWARE\Policies\Microsoft\Windows\Personalization]
“NoLockScreen”=dword:00000001
With the lock screen turned off my laptop was instantly responsive when I opened it up. I didn’t notice any sluggishness or CPU storms, and logging in took one less step.
The initial twitter thread that I started when I first hit this issue contains a timeline of the investigation which may be instructive. Also, I have a lot of helpful twitter peeps – thank you.
When I went back to write up what I had learned I re-enabled the lock screen and found that the problem had gone away. It wasn’t as simple as a reboot fixing the problem – I did many reboots back in February – but we’ll probably never know why it disappeared.





Also, cool title!
Rank is also used for Universal Apps not in the foreground according to the compositor/shell. This state of backgroundness triggers a kernel mechanism called “rank bias”. Maybe the weirdness of the lock app is such that the higher level os components don’t eliminate the rank bias early enough.
-Neeraj
Author of the original scheduling group code.
That sounds like it is what happens. Are backgrounded apps supposed to immediately go to rank 2, or just be *eligible* for having their rank changed?
If you have any pointers to documentation or APIs for exploring this space that would be great, and thanks for commenting.
Nice and deep analysis ^_^. Is there anyway to change thread rank manually as you change process priority from task manager?
Regards
You can’t even *view* thread rank in any tool I have seen, probably because there is no API to read it. ETW traces are the only system I’ve seen that can view thread ranks.
Microsoft may add APIs for reading thread rank but I doubt they will add APIs for modifying it, and those would be of minimal use anyway because the whole idea is that the OS dynamically adjusts thread rank.
It would be nice if they would add APIs both to read thread rank and also to read and modify processes’ membership in group scheduling. And maybe some documentation as well.
Great insightful article again. Thank you!
I’ve just tried out sorting several etw traces by the NewThreadRank column (using first triage profile for the traces). The thread ranks are either -1 (Idle) or 0. Is that to be expected? Or do I have to enable a specific provider to capture the rank?
Cheers
Christina
My understanding is that “normal” apps in a single-user (not terminal services) environment should always have a rank of zero. Store apps like Calculator do get their rank changed, although the details are poorly documented. No specific provider is needed – the one that grabs the context switch events (DISPATCHER?) should do the trick.