When Microsoft came out with columnstore in SQL Server 2012, they introduced a new way to process data called Batch Mode. Batch mode processes a group of rows together as a batch, instead of processing the data row by row. By processing data in batches, SQL Server uses less CPU than row by row processing. To take advantage of batch mode, a query had to reference a table that contained a column store index. If your query only involved tables that contain data in row stores, then your query would not use batch mode. That has now changed. With the introduction of version 15.x of SQL Server, aka SQL Server 2019, Microsoft introduced a new feature call Batch Mode on Rowstore.
Batch Mode on Rowstore is one of many new features that was introduced in the Azure SQL Database and SQL Server 2019 to help speed up rowstore queries that don’t involve a column store. The new Batch Mode on Rowstore feature can improve performance of large analytic queries that scan many rows, where these queries aggregate, sort or group selected rows. Microsoft included this new batch mode feature in the Intelligent Query Processing (IQP). See Figure 1 for a diagram from Microsoft’s documentation that shows all the IQP features introduced in Azure SQL Database and SQL Server 2019. It also shows the features that originally were part of Adaptive Query Processing included in the older generation of Azure SQL Database and SQL Server 2017.
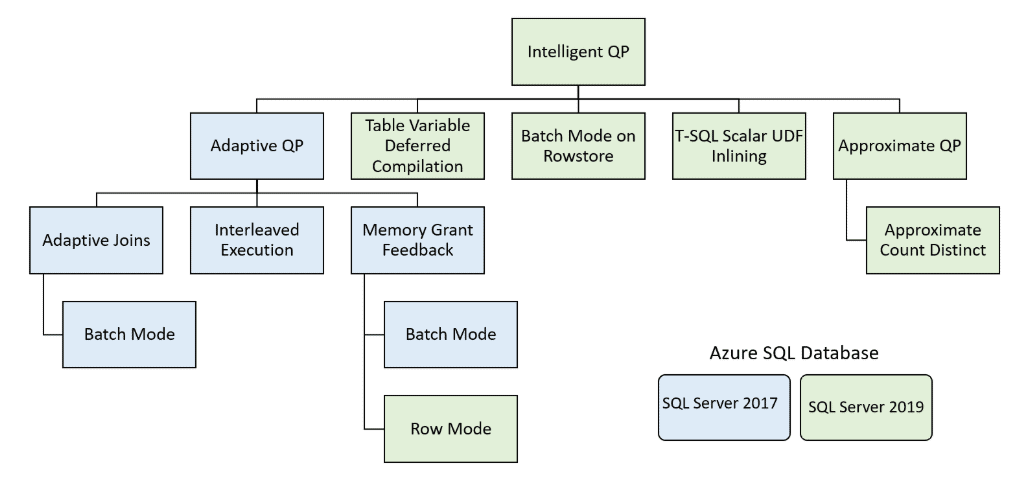
Figure 1: Intelligent Query Processing
Batch Mode on Rowstore can help speed up your big data analytic queries but might not kick in for smaller OLTP queries (more on this later). Batch mode has been around for a while and supports columnstore operators, but it wasn’t until SQL Server version 15.x that batch mode worked on Rowstores without performing a hack. Before seeing the new Batch Mode on Rowstore feature in action, let me first explain how batch mode processing works.
How Batch Mode Processing Works
When the database engine processes a transact SQL statement, the underlying data is processed by one or more operators. These operators can process the data using two different modes: Row or Batch. At a high level, row mode can be thought of as processing rows of data, one row at a time. Whereas, batch mode processes multiple rows of data together in a batch. The processing of batches of rows at a time versus row by row can reduce CPU usage.
When batch mode is used for rowstore data, the rows of data are scanned and loaded into a vector storage structure, known as a batch. Each batch is a 64K internal storage structure. This storage structure can contain between 64 and 900 rows of data, depending on the number of columns involved in the query. Each column used by the query is stored in a continuous column vector of fixed size elements, where the qualifying rows vector indicates which rows are still logically part of the batch (see Figure 2 which came from a Microsoft Research paper).
Rows of data can be processed very efficiently when an operation uses batch mode, as compared to row mode processing. For instance, when a batch mode filter operation needs to qualify rows that meet a given column filter criteria, all that is needed is to scan the vector that contains the filtered column and mark the row appropriately in the qualifying rows vector, based on whether or not the column value meets the filter criteria.
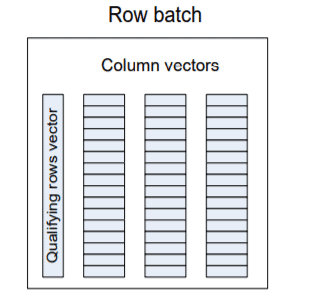
Figure 2: A row batch is stored column-wise and contains one vector for each column plus a bit vector indicating qualifying rows
SQL Server executes fewer instructions per row when using batch mode over row mode. By reducing the number of instructions when using batch mode, queries typically use less CPU than row mode queries. Therefore, if a system is CPU bound, then batch mode might help reduce the environment’s CPU footprint.
In a given execution plan, SQL Server might use both batch and row mode operators, because not all operators can process data in batch mode. When mixed-mode operations are needed, SQL Server needs to transition between batch mode and row mode processing. This transition comes at a cost. Therefore, SQL Server tries to minimize the number of transitions to help optimize the processing of mixed-mode execution plans.
For the engine to consider batch mode for a rowstore, the database compatibility level must be set to 150. With the compatibility level set to 150, the database engine performs a few heuristic checks to make sure the query qualifies to use batch mode. One of the checks is to make sure the rowstore contains a significate number of rows. Currently, it appears that the magic number seems to be 131,072. Dmitry Pilugin wrote an excellent post on this magic number. I also verified that this is still the magic number for the RTM release of SQL Server 2019. That means that batch mode doesn’t kick in for smaller tables (less than 131,072 rows), even if the database is set to compatibility mode 150. Another heuristic check verifies that the rowstore is using either a b-tree or heap for its storage structure. Batch mode doesn’t kick in if the table is an in-memory table. The cost of the plan is also considered. If the database optimizer finds a cheaper plan that doesn’t use Batch Mode on Rowstore, then the cheaper plan is used.
To see how this new batch mode feature works on a rowstore, I set up a test that ran a couple of different aggregate queries against the WideWorldImportersDW database.
Batch Mode on Rowstore In Action
This section demonstrates running a simple test aggregate query to summarize a couple of columns of a table that uses heap storage. The example runs the test aggregate query twice. The first execution uses compatibility level 140, so the query must use row mode operators to process the test query. The second execution runs under compatibility mode 150 to demonstrate how batch mode improves the query processing for the same test query.
After running the test query, I’ll explain how the graphical execution plans show the different operators used between the two test query executions. I’ll also compare the CPU and Elapsed time used between the two queries to identify the performance improvement using batch mode processing versus row mode processing. Before showing my testing results, I’ll first explain how I set up my testing environment.
Setting up Testing Environment
I used the WideWorldImportersDW database as a starting point for my test data. To follow along, you can download the database backup for this DB here. I restored the database to an instance of SQL Server 2019 RTM running on my laptop. Since the Fact.[Order] table in this database isn’t that big, I ran the code in Listing 1 to create a bigger fact table named Fact.OrderBig. The test query aggregates data using this newly created fact table.
Listing 1: Code to create the test table Fact.OrderBig
|
1 2 3 4 5 6 7 8 9 10 11 12 13 14 15 16 17 18 19 20 21 22 23 24 25 26 |
USE WideWorldImportersDW; GO CREATE TABLE Fact.[OrderBig]( [Order Key] [bigint], [City Key] [int] NOT NULL, [Customer Key] [int] NOT NULL, [Stock Item Key] [int] NOT NULL, [Order Date Key] [date] NOT NULL, [Picked Date Key] [date] NULL, [Salesperson Key] [int] NOT NULL, [Picker Key] [int] NULL, [WWI Order ID] [int] NOT NULL, [WWI Backorder ID] [int] NULL, [Description] [nvarchar](100) NOT NULL, [Package] [nvarchar](50) NOT NULL, [Quantity] [int] NOT NULL, [Unit Price] [decimal](18, 2) NOT NULL, [Tax Rate] [decimal](18, 3) NOT NULL, [Total Excluding Tax] [decimal](18, 2) NOT NULL, [Tax Amount] [decimal](18, 2) NOT NULL, [Total Including Tax] [decimal](18, 2) NOT NULL, [Lineage Key] [int] NOT NULL); GO INSERT INTO Fact.OrderBig SELECT * FROM Fact.[Order]; GO 100 |
The code in Listing 1 created the Fact.OrderBig table that is 100 times the size of the original Fact.[Order] table with 23,141,200 rows.
Comparison Test Script
To do a comparison test between batch mode and row mode, I ran two different test queries found in Listing 2.
Listing 2: Test script
|
1 2 3 4 5 6 7 8 9 10 11 12 13 14 15 16 17 18 19 20 21 22 23 24 25 26 27 28 29 30 31 32 33 34 35 36 |
USE WideWorldImportersDW; GO -- Turn on time statistics SET STATISTICS IO, TIME ON; -- Clean buffers so cold start performed DBCC DROPCLEANBUFFERS GO -- Prepare Database Compatibility level for Test #1 ALTER DATABASE WideWorldImportersDW SET COMPATIBILITY_LEVEL = 140; GO -- Test #1 SELECT [Customer Key], SUM(Quantity) AS TotalQty, AVG(Quantity) AS AvgQty, AVG([Unit Price]) AS AvgUnitPrice FROM Fact.[OrderBig] WHERE [Customer Key] > 10 and [Customer Key] < 100 GROUP BY [Customer Key] ORDER BY [Customer Key]; GO -- Clean buffers so cold start performed DBCC DROPCLEANBUFFERS GO -- Prepare Database Compatibility level for Test #2 ALTER DATABASE WideWorldImportersDW SET COMPATIBILITY_LEVEL = 150; GO -- Test #2 SELECT [Customer Key], SUM(Quantity) AS TotalQty, AVG(Quantity) AS AvgQty, AVG([Unit Price]) AS AvgUnitPrice FROM Fact.[OrderBig] WHERE [Customer Key] > 10 and [Customer Key] < 100 GROUP BY [Customer Key] ORDER BY [Customer Key]; GO |
The code in Listing 2 executes two different tests, collects some performance statistics, and cleans the data buffer cache between each test. Both tests run the same simple aggregate query against the Fact.OrderBig table. Test #1 runs the aggregate SELECT statement using compatibility level 140, whereas Test #2 runs the same aggregate SELECT statement using compatibility level 150. By setting the compatibility level to 140, Test #1 uses row mode processing. Whereas Test #2, uses compatibility level 150, so batch mode can be considered for the test query. Additionally, I turned on the TIME statistics so I could measure performance (CPU and Elapsed time) between each test. By doing this, I can validate the performance note in Figure 3, that was found in this Microsoft documentation.

Figure 3: Documentation Note on Performance
When I ran my test script in Listing 2, I executed it from a SQL Server Management Studio (SSMS) query window. In that query window, I enabled the Include Actual Execution Plan option so that I could compare the execution plans created for both of my tests. Let me review the execution artifacts created when I ran my test script in Listing 2.
Review Execution Artifacts
When I ran my test script, I collected CPU and Elapsed Time statistics as well as the actual execution plans for each execution of my test aggregate query. In this section, I’ll review the different execution artifacts to compare the differences between row mode and batch mode processing.
The CPU and Elapsed time statistics, as well as the actual execution plan for when I ran my first test query, which was using compatibility level 140, can be found in Figure 4 and Figure 5 respectfully.
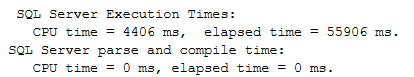
Figure 4: CPU and Elapsed Time Statistics for Test #1
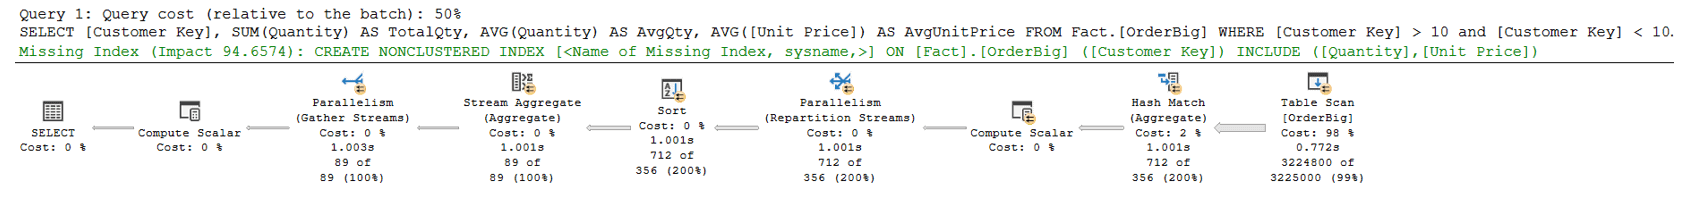
Figure 5: Actual Execution Plan under Compatibility Level 140 for Query 1
Figure 6 and 7 below, show the time statistics and the actual execution plan when I ran my test query under compatibility level 150.
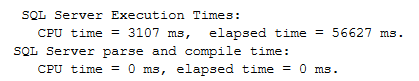
Figure 6: Execution Statistics for Test #2
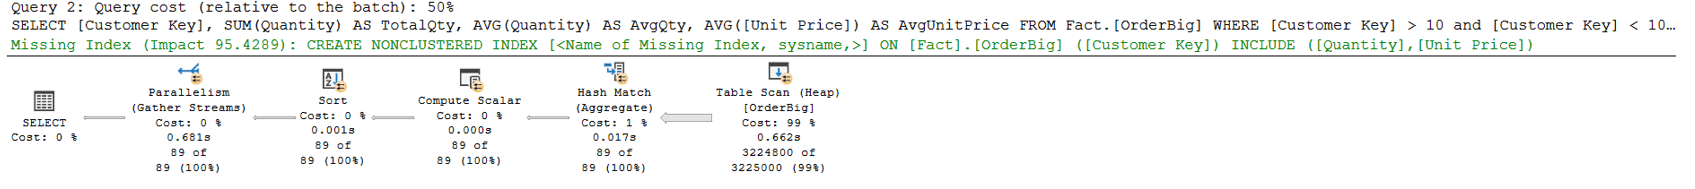
Figure 7: Execution Plan for Test #2
The first thing to note is that the plan that ran under compatibility level 150 (Figure 7) is more streamlined than the one that ran under compatibility mode 140 (Figure 6). From just looking at the execution plan for the second test query, I can’t tell whether or not the query (which ran under compatibility mode 150) uses batch mode or not. To find out, you must right-click on the SELECT icon in the execution for the Test #2 query (Figure 7) and then select the Properties item from the context menu. Figure 8 shows the properties of this query.
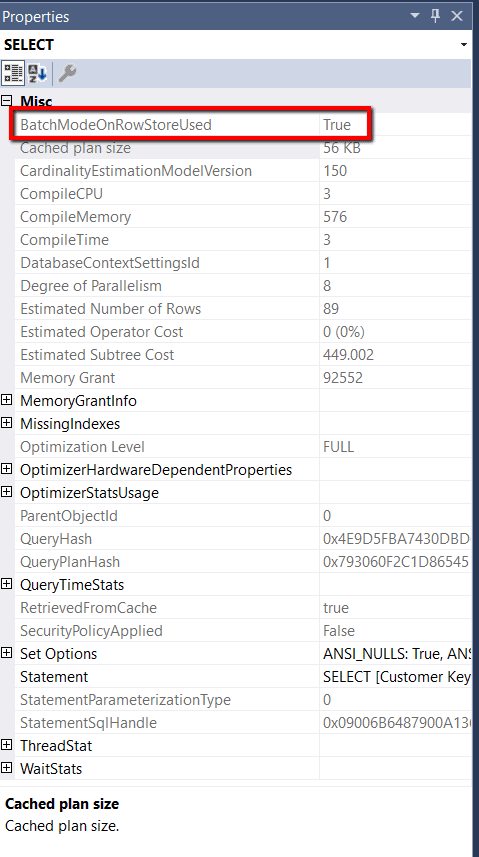
Figure 8: Properties for Compatibility Level 150 Query (Test #2)
Notice that the property BatchModeOnRowstoreUsed is True. This property is a new showplan attribute that Microsoft added in SSMS version 18. When this property is true, it means that some of the operators used in processing Test #2 did use a batch mode operation on the Rowstore Fact.OrderBig table.
To review which operators used Batch Mode on Rowstore, you must review the properties of each operator. Figure 9 has some added annotations to the execution plan that shows which operators used batch mode processing and which ones used row mode processing.
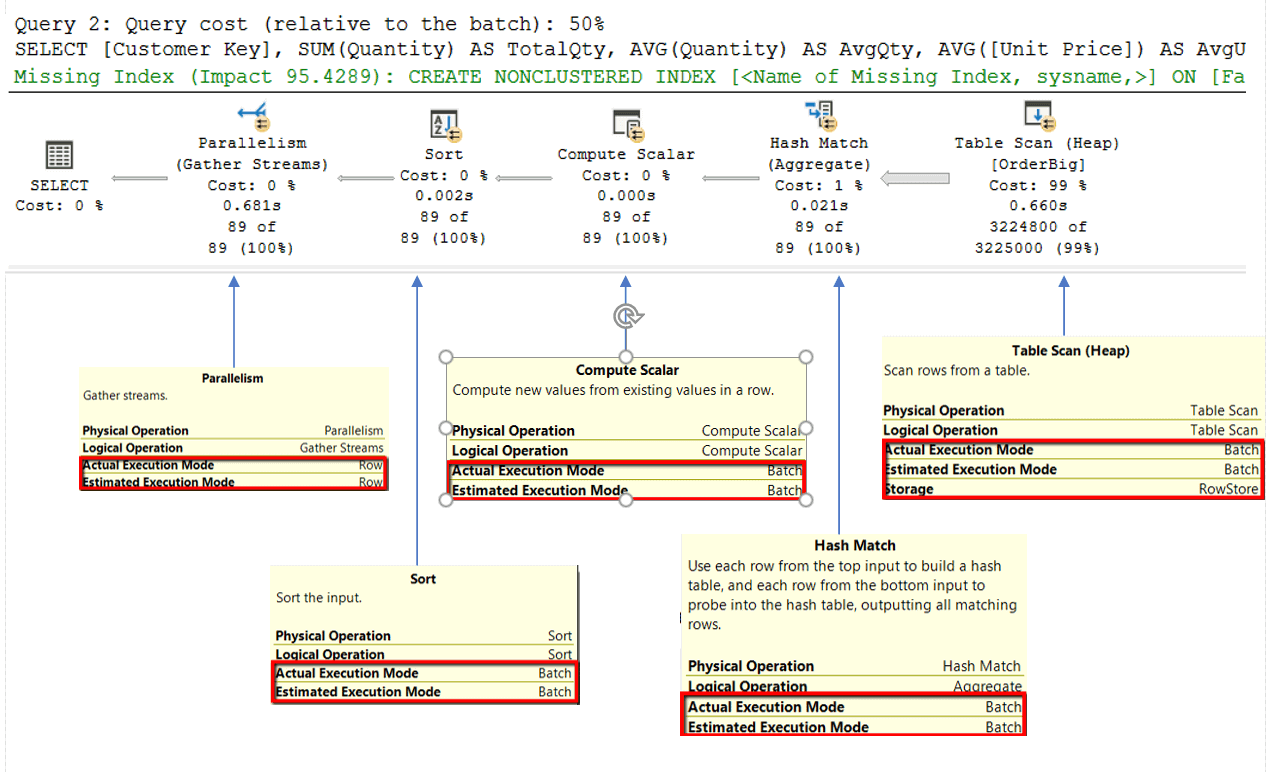
Figure 9: Execution Plan for Batch Mode query with Operator property annotations
If you look at the Table Scan (Heap) operator, you can see that the Fact.OrderBig table is a RowStore by reviewing the Storage Property. You can also see that this operation used batch mode by looking at the Actual Execution Mode property. All the other operators ran in batch mode, except the Parallelism operator, which used row mode.
The test table (Fact.OrderBig) contains 23,141,200 rows and the test query referenced 3 different columns. The query didn’t need all those rows because it was filtered to include the rows where the customerid was greater than 10 and less than 100. To determine the number of batches the query created, look at the properties of the table scan operator in the execution plan, which is shown in Figure 10.
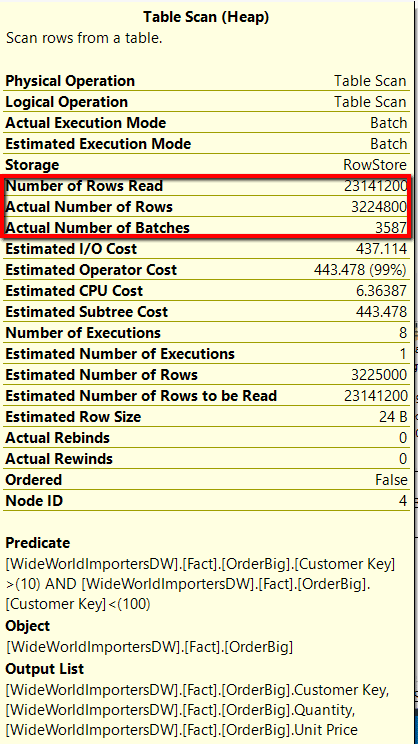
Figure 10: Number of batches used for Test #2.
The Actual Number of Batches property in Figure 8 shows that the table scan operator of the test #2 query created 3,587 batches. To determine the number of rows in each batch, use the following formula: Actual Number of Rows divided by the Actual Number of Batches. By using this formula, I got, on average, 899.02 rows per batch.
The cost estimate for each of the queries is the same, 50%. Therefore, to measure performance between batch mode and row mode, I’ll have to look at the TIME statistics.
Comparing Performance of Batch Mode and Row Mode
To compare performance between running batch mode and row mode queries, I ran my test script in Listing 2 ten different times. I then averaged the CPU and Elapsed times between my two different tests and then graphed the results in the chart found in Figure 11.
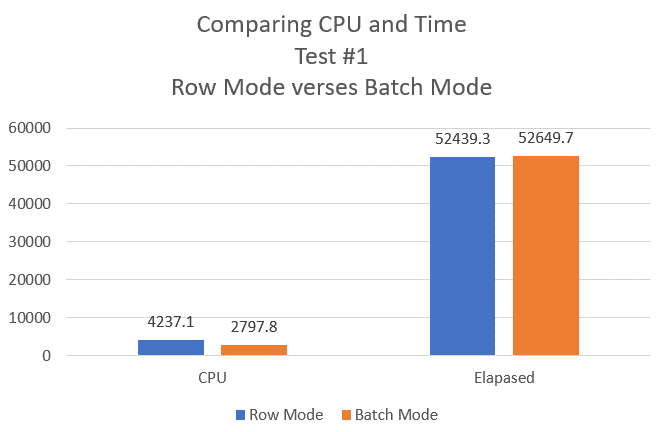
Figure 11: CPU and Elapsed time Comparison between Row Mode and Batch Mode
The chart in Figure 11 shows that the row mode test query used a little more than 30% more CPU over the batch mode test query. Both the batch and row mode queries ran about the same elapsed time. Just like the note (Figure 4) above suggested, this first test showed considerable CPU improvement could be gained when a simple aggregate query uses Batch Mode processing. But not all queries are created equal when it comes to performance improvements using Batch Mode versus Row Mode.
Not All Queries are Created Equal When It Comes to Performance
The previous test showed a 30% improvement in CPU but little improvement in Elapsed Time. The resource (CPU and Elapsed Time) improvements using Batch Mode operations versus Row mode depend on the query. Here is another contrived test that shows some drastic improvements in Elapsed Time, using the new Batch Mode on Rowstore feature. The test script I used for my second performance test can be found in Listing 3.
Listing 3: Stock Item Key Query Test Script
|
1 2 3 4 5 6 7 8 9 10 11 12 13 14 15 16 17 18 19 20 21 22 23 24 25 26 27 28 29 30 31 32 33 34 35 36 |
-- Turn on time statistics SET STATISTICS IO, TIME ON; -- Clean buffers so cold start performed DBCC DROPCLEANBUFFERS GO -- Prepare Database Compatibility level for Test #1 ALTER DATABASE WideWorldImportersDW SET COMPATIBILITY_LEVEL = 140; GO SELECT [Stock Item Key],[City Key],[Order Date Key],[Salesperson Key], AVG(Quantity) OVER(PARTITION BY [Stock Item Key]) AS StockAvgQty, AVG(Quantity) OVER(PARTITION BY [Stock Item Key],[City Key]) AS StockCityAvgQty, AVG(Quantity) OVER(PARTITION BY [Stock Item Key],[City Key], [Order Date Key]) AS StockCityDateAvgQty, AVG(Quantity) OVER(PARTITION BY [Stock Item Key],[City Key], [Order Date Key],[Salesperson Key]) AS StockCityDateSalespersonAvgQty FROM Fact.OrderBig WHERE [Customer Key] > 10 and [Customer Key] < 100 -- Clean buffers so cold start performed DBCC DROPCLEANBUFFERS GO -- Prepare Database Compatibility level for Test #2 ALTER DATABASE WideWorldImportersDW SET COMPATIBILITY_LEVEL = 150; GO SELECT [Stock Item Key],[City Key],[Order Date Key],[Salesperson Key], AVG(Quantity) OVER(PARTITION BY [Stock Item Key]) AS StockAvgQty, AVG(Quantity) OVER(PARTITION BY [Stock Item Key],[City Key]) AS StockCityAvgQty, AVG(Quantity) OVER(PARTITION BY [Stock Item Key],[City Key], [Order Date Key]) AS StockCityDateAvgQty, AVG(Quantity) OVER(PARTITION BY [Stock Item Key],[City Key], [Order Date Key],[Salesperson Key]) AS StockCityDateSalespersonAvgQty FROM Fact.OrderBig WHERE [Customer Key] > 10 and [Customer Key] < 100 |
In Listing 3, I used the OVER clause to create four different aggregations, where each aggregation had a different PARTITION specification. To gather the performance statistics for Listing 3 queries, I ran this script ten different times. Figure 12 shows the numbers for CPU and Elapsed Time numbers graphically.
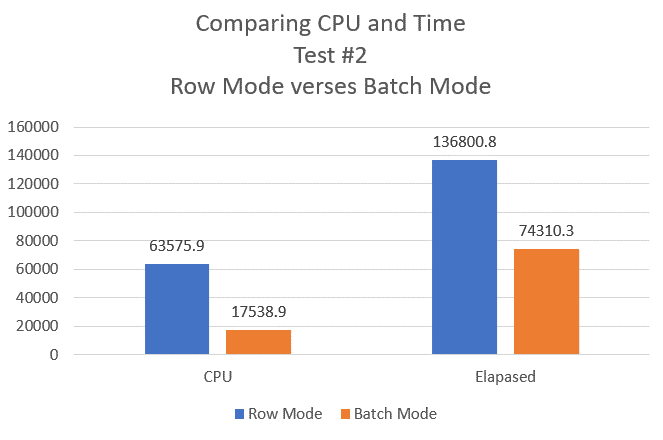
Figure 12: CPU and Elapsed Time comparison for Window Function Query test
As you can see by creating the different aggregation in Listing 3, I once again saw a big performance improvement in CPU (around 72%). This time, I also got a big improvement in Elapsed Time (a little more than 45%) when batch mode was used. My testing showed that not all queries are created equal when it comes to performance. For this reason, I recommend you test all the queries in your environment to determine how each query performs using this new Batch Mode on Rowstore feature. If you happen to find some queries that perform worse using batch mode, then you can either rewrite the queries to perform better or consider disabling batch mode for those problem queries.
Disabling Batch Mode on Row Store
If you find you have a few queries that don’t benefit from using batch mode, and you don’t want to rewrite them, then you might consider turning off the Batch Mode on Rowstore feature with a query hint.
If you use the DISALLOW_BATCH_MODE hint, you can disable Batch Mode on Rowstore feature for a given query. The code in Listing 4 shows how I disabled batch mode for the first test query I used in this article.
Listing 4: Using “DISALLOW BATCH MODE” hint to disable batch mode for a single query
|
1 2 3 4 5 6 7 8 9 |
SELECT [Customer Key], SUM(Quantity) AS TotalQty, AVG(Quantity) AS AvgQty, AVG([Unit Price]) AS AvgUnitPrice FROM Fact.[OrderBig] WHERE [Customer Key] > 10 and [Customer Key] < 100 GROUP BY [Customer Key] ORDER BY [Customer Key] OPTION(USE HINT('DISALLOW_BATCH_MODE')); |
When I ran the query in Listing 4 against the WideWorldImportersDW database running in compatibility mode 150, the query didn’t invoke any batch mode operations. I verified this by reviewing the properties of each operator. They all processed using a row mode operation. The value of using the DISALLOW_BATCH_MODE hint is I can disable the batch mode feature for a single query. This means it’s possible to be selective on which queries will not consider batch mode when your database is running under compatibility level 150.
Alternatively, you could disable the Batch Mode on Rowstore feature at the database level, as shown in Listing 5.
Listing 5: Disabling Batch Mode at the database level
|
1 2 |
-- Disable batch mode on rowstore ALTER DATABASE SCOPED CONFIGURATION SET BATCH_MODE_ON_ROWSTORE = OFF; |
Disabling the batch mode feature at the database level still allows other queries to take advantages of the other new 15.x features. This might be an excellent option to use if you wanted to move to version 15.x of SQL Server while you complete testing of all of your large aggregation queries to see how they are impacted by the batch mode feature. Once testing is complete, reenable batch mode by running the code in Listing 6.
Listing 6: Enabling Batch Mode at the database level
|
1 2 |
-- Enable batch mode on rowstore ALTER DATABASE SCOPED CONFIGURATION SET BATCH_MODE_ON_ROWSTORE = ON; |
By using the hint or database scoped configure method to disable batch mode, I have control over how I want this new feature to affect the performance of my row mode query operations. It is great that the team at Microsoft allows these different methods to disable/enable the Batch Mode on Rowstore feature. By allowing these different options for enable/disabling batch mode on rowstore, I have more flexibility in how I roll out the batch mode feature across a database.
Which Editions Support Batch Mode?
Before you get too excited about how this feature might help the performance of your large analytic queries, I have to tell you the bad news. Batch Mode on Rowstore is not available to all version of SQL. Like many cool new features that have come out in the past, they are first introduced in Enterprise edition only, and then over time, they might become available in other editions. Batch Mode on Rowstore is no exception. As of the RTM release of SQL Server 2019, the Batch Mode on Rowstore feature is only available in Enterprise Edition, as documented here. Also note that developer edition supports Batch Mode on Rowstore, but of course cannot be used for production work. Be careful when doing performance testing of this new feature on the developer edition of SQL Server 2019 if you plan to roll out your code into any production environment except Enterprise. If you want to reduce your CPU footprint using this new feature, then you better get out your checkbook and upgrade to Enterprise edition, or just wait until Microsoft rolls this feature out to other editions of SQL Server. It also works on Azure SQL Database.
Reduce CPU of Large Analytic Queries Without Changing Code
If you have large analytic queries that perform aggregations, you might find that using the new Batch Mode on Rowstore feature improves CPU and Elapsed time without changing any code if your query environment meets a few requirements. The first requirement is that your query needs to be running using SQL Server version 15.x (SQL Server 2019) or better. The second requirement is you need to be running on an edition of SQL Server that supports the Batch Mode on Rowstore feature. Additionally, the table being queried needs to have at least 131,072 rows and be stored in a b-tree or heap before batch mode is considered for the table.
I am impressed by how much less CPU and Elapsed time was used for my test aggregation queries. If you have a system that runs lots of aggregate queries, then migrating to SQL Server 2019 might be able to eliminate your CPU bottlenecks and get some of your queries to run faster at the same time.

Load comments