blog
What to Check if the MySQL I/O Utilisation is High

The I/O performance is vital for MySQL databases. Data is read and written to the disk in numerous places. Redo logs, tablespaces, binary and relay logs. With an increase of the usage of solid state drives I/O performance has significantly increased allowing users to push their databases even faster but even then I/O may become a bottleneck and a limiting factor of the performance of the whole database. In this blog post we will take a look at the things you want to check if you notice your I/O performance is high on your MySQL instance.
What does “High” I/O utilisation mean? In short, if the performance of your database is affected by it, it is high. Typically you would notice it as writes slowing down in the database. It will also clearly manifest as high I/O wait on your system. Please keep in mind, though, on hosts with 32 and more CPU cores, even if one core will show 100% I/O wait, you may not notice it on a aggregated view – it will represent only 1/32 of the whole load. Seems not impacting but in fact some single-threaded I/O operation is saturating your CPU and some application is waiting for that I/O activity to finish.
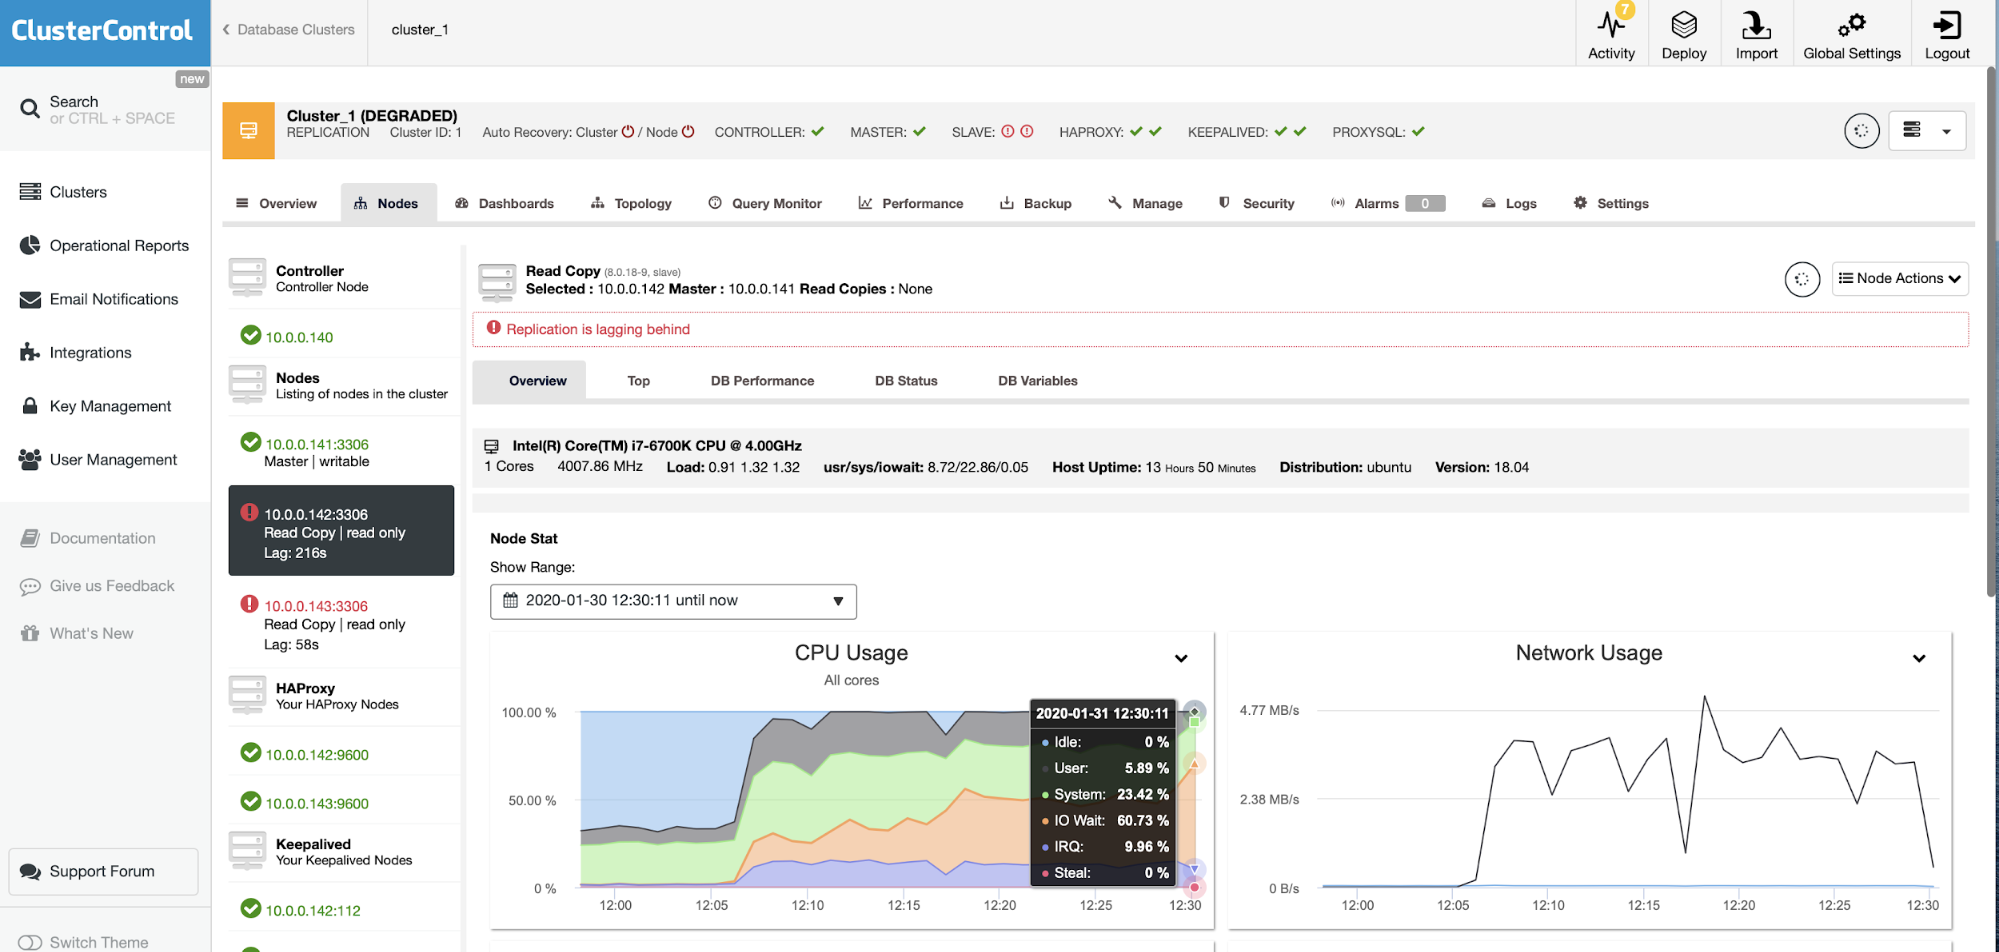
Let’s say we did notice an increase in the I/O activity, just as in the screenshot above. What to look at if you noticed high I/O activity? First, check the list of the processes in the system. Which one is responsible for an I/O wait? You can use iotop to check that:
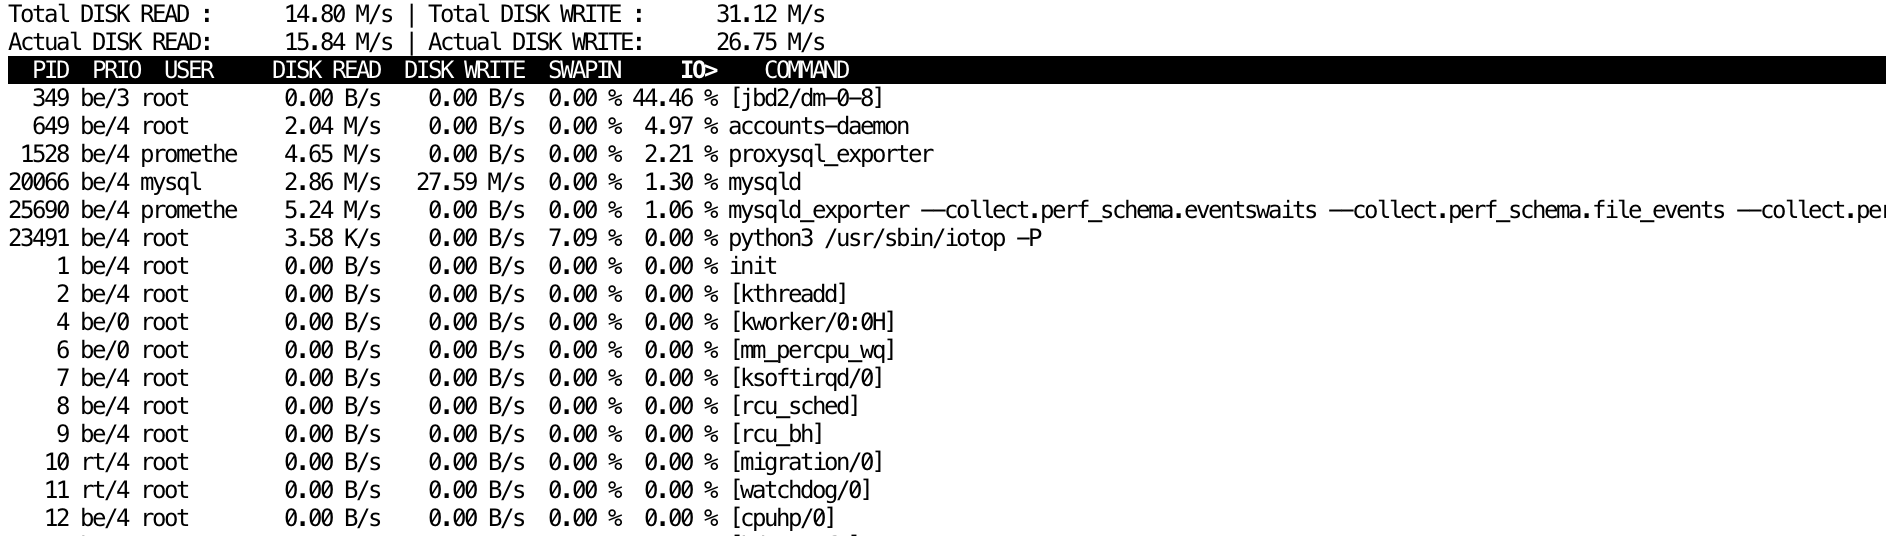
In our case it is quite clear that it is MySQL which is responsible for most of it. We should start with the simplest check – what exactly is running in the MySQL right now?
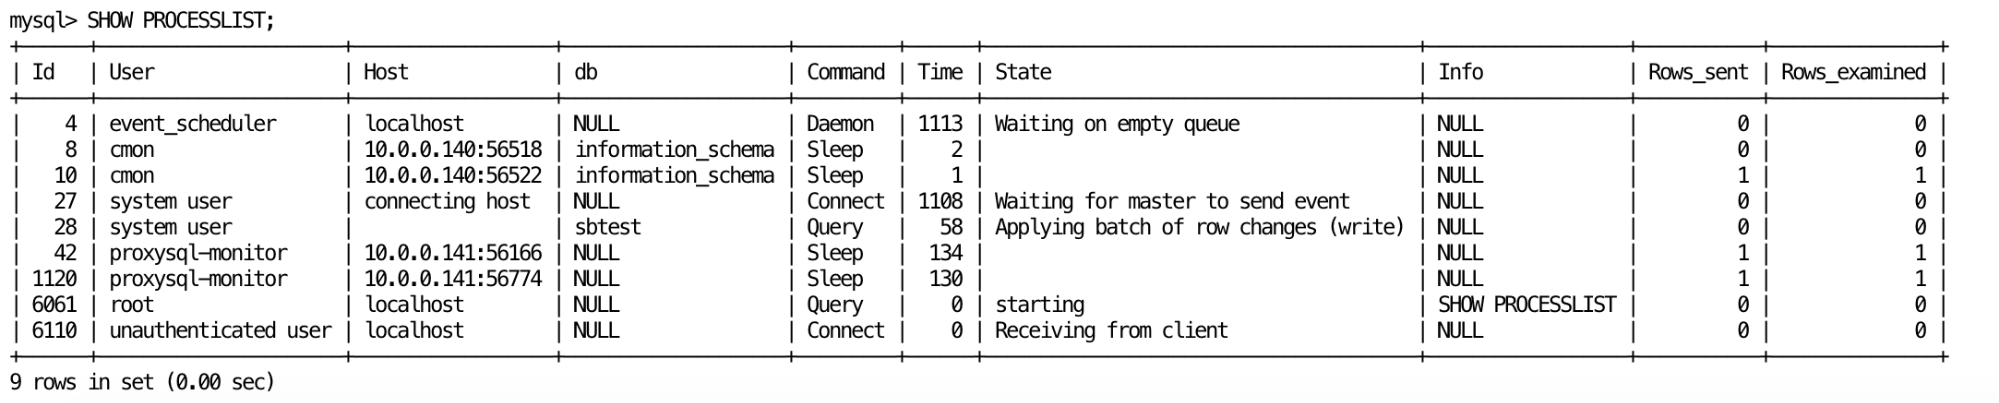
We can see there is replication activity on our slave. What is happening to the master?

We can clearly see some batch load job is running. This sort of ends our journey here as we managed to pinpoint the problem quite easily.
There are other cases, though, which may not be that easy to understand and track. MySQL comes with some instrumentation, which is intended to help with understanding the I/O activity in the system. As we mentioned, I/O can be generated in numerous places in the system. Writes are the most clear ones but we may also have on-disk temporary tables – it’s good to see if your queries do use such tables or not.
If you have performance_schema enabled, one way to check which files are responsible for the I/O load can be to query ‘table_io_waits_summary_by_table’:
*************************** 13. row ***************************

                FILE_NAME: /tmp/MYfd=68

               EVENT_NAME: wait/io/file/sql/io_cache

    OBJECT_INSTANCE_BEGIN: 140332382801216

               COUNT_STAR: 17208

           SUM_TIMER_WAIT: 23332563327000

           MIN_TIMER_WAIT: 1596000

           AVG_TIMER_WAIT: 1355913500

           MAX_TIMER_WAIT: 389600380500

               COUNT_READ: 10888

           SUM_TIMER_READ: 20108066180000

           MIN_TIMER_READ: 2798750

           AVG_TIMER_READ: 1846809750

           MAX_TIMER_READ: 389600380500

 SUM_NUMBER_OF_BYTES_READ: 377372793

              COUNT_WRITE: 6318

          SUM_TIMER_WRITE: 3224434875000

          MIN_TIMER_WRITE: 16699500

          AVG_TIMER_WRITE: 510356750

          MAX_TIMER_WRITE: 223219960500

SUM_NUMBER_OF_BYTES_WRITE: 414000000

               COUNT_MISC: 2

           SUM_TIMER_MISC: 62272000

           MIN_TIMER_MISC: 1596000

           AVG_TIMER_MISC: 31136000

           MAX_TIMER_MISC: 60676000

*************************** 14. row ***************************

                FILE_NAME: /tmp/Innodb Merge Temp File

               EVENT_NAME: wait/io/file/innodb/innodb_temp_file

    OBJECT_INSTANCE_BEGIN: 140332382780800

               COUNT_STAR: 1128

           SUM_TIMER_WAIT: 16465339114500

           MIN_TIMER_WAIT: 8490250

           AVG_TIMER_WAIT: 14596931750

           MAX_TIMER_WAIT: 583930037500

               COUNT_READ: 540

           SUM_TIMER_READ: 15103082275500

           MIN_TIMER_READ: 111663250

           AVG_TIMER_READ: 27968670750

           MAX_TIMER_READ: 583930037500

 SUM_NUMBER_OF_BYTES_READ: 566231040

              COUNT_WRITE: 540

          SUM_TIMER_WRITE: 1234847420750

          MIN_TIMER_WRITE: 286167500

          AVG_TIMER_WRITE: 2286754250

          MAX_TIMER_WRITE: 223758795000

SUM_NUMBER_OF_BYTES_WRITE: 566231040

               COUNT_MISC: 48

           SUM_TIMER_MISC: 127409418250

           MIN_TIMER_MISC: 8490250

           AVG_TIMER_MISC: 2654362750

           MAX_TIMER_MISC: 43409881500
As you can see above, it also shows temporary tables that are in use.
To double-check if a particular query uses temporary table you can use EXPLAIN FOR CONNECTION:
mysql> EXPLAIN FOR CONNECTION 3111G

*************************** 1. row ***************************

           id: 1

  select_type: SIMPLE

        table: sbtest1

   partitions: NULL

         type: ALL

possible_keys: NULL

          key: NULL

      key_len: NULL

          ref: NULL

         rows: 986400

     filtered: 100.00

        Extra: Using temporary; Using filesort

1 row in set (0.16 sec)
On the example above a temporary table is used for filesort.
Another way of catching up disk activity is, if you happen to use Percona Server for MySQL, to enable full slow log verbosity:
mysql> SET GLOBAL log_slow_verbosity='full';

Query OK, 0 rows affected (0.00 sec)
Then, in the slow log, you may see entries like this:
# Time: 2020-01-31T12:05:29.190549Z

# User@Host: root[root] @ localhost []  Id: 12395

# Schema:   Last_errno: 0  Killed: 0

# Query_time: 43.260389  Lock_time: 0.031185 Rows_sent: 1000000  Rows_examined: 2000000 Rows_affected: 0

# Bytes_sent: 197889110  Tmp_tables: 0 Tmp_disk_tables: 0  Tmp_table_sizes: 0

# InnoDB_trx_id: 0

# Full_scan: Yes  Full_join: No Tmp_table: No  Tmp_table_on_disk: No

# Filesort: Yes  Filesort_on_disk: Yes  Merge_passes: 141

#   InnoDB_IO_r_ops: 9476  InnoDB_IO_r_bytes: 155254784  InnoDB_IO_r_wait: 5.304944

#   InnoDB_rec_lock_wait: 0.000000  InnoDB_queue_wait: 0.000000

#   InnoDB_pages_distinct: 8191

SET timestamp=1580472285;

SELECT * FROM sbtest.sbtest1 ORDER BY RAND();
As you can see, you can tell if there was a temporary table on disk or if the data was sorted on disk. You can also check the number of I/O operations and amount of data accessed.
We hope this blog post will help you understand the I/O activity in the system and let you manage it better.