It can sometimes be handy to automate the generation of presentations slides ,such as listing KPIs/Health for production servers needed for capacity planning or other purpose.
The source data may be stored in different locations/different databases.So let’s see how we can do that in python !
We are going to use here the “python-pptx” library for the slide/chart generation and “cx_Oracle” for connecting to our oracle database.
Without going to much in detail here is the sample script and output :
from pptx import Presentation
from pptx.chart.data import CategoryChartData
from pptx.enum.chart import XL_CHART_TYPE
from pptx.util import Inches
from pptx.enum.chart import XL_LEGEND_POSITION
import cx_Oracle

con = cx_Oracle.connect('hatem/hatem@192.168.56.2/salespdb.localdomain')

cur = con.cursor()
cur.execute("select to_char(TIMESTAMP,'dd-mm-yy-hh24:mm') ,CVALUE from MGMT$METRIC_HOURLY where metric_column= 'cpuUtil' and TARGET_NAME = 'bdd001' and ROLLUP_TIMESTAMP > sysdate -10 order by TIMESTAMP desc")

mylist1=[]
mylist2=[]
for result in cur:
mylist1.append(result[0])
mylist2.append(result[1])

cur.close()
con.close()

prs = Presentation()

#Slide 1

title_slide_layout = prs.slide_layouts[0]
slide = prs.slides.add_slide(title_slide_layout)
title = slide.shapes.title
subtitle = slide.placeholders[1]
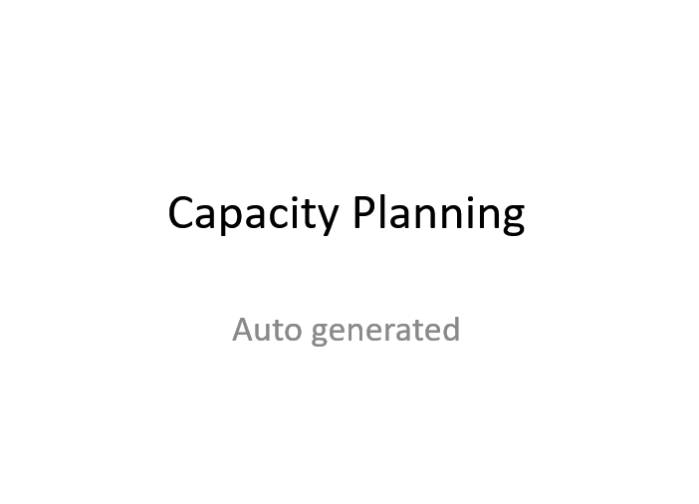
title.text = "Capacity Planning "
subtitle.text = "Auto generated"

#Slide 2

bullet_slide_layout = prs.slide_layouts[1]
slide2 = prs.slides.add_slide(bullet_slide_layout)
title2 = slide2.shapes.title
title2.text = "Second slide "

#Slide 3

slide3 = prs.slides.add_slide(prs.slide_layouts[5])
title3 = slide3.shapes.title
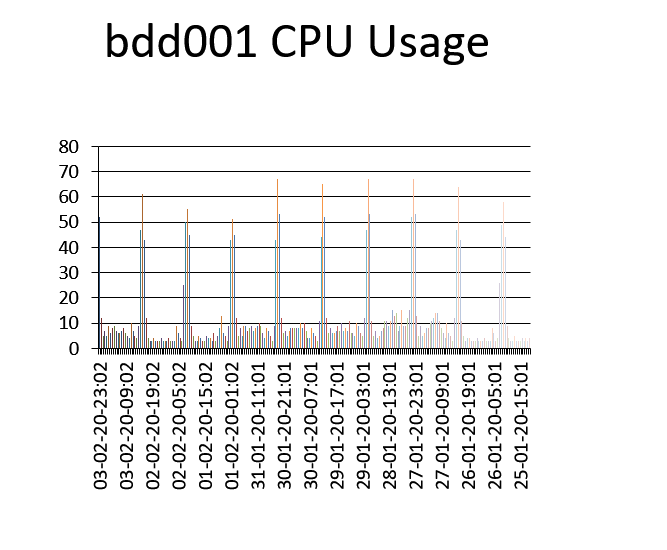
title3.text='bdd001 CPU Usage'

# define chart data ---------------------
chart_data = CategoryChartData()
chart_data.categories = mylist1
chart_data.add_series('bdd001 CPU Usage',mylist2)

# add chart to slide --------------------
x, y, cx, cy = Inches(2), Inches(2), Inches(6), Inches(4.5)
chart = slide3.shapes.add_chart(
XL_CHART_TYPE.COLUMN_STACKED, x, y, cx, cy, chart_data
).chart

prs.save('test.pptx')
That’s it 😀
Ref :
- https://python-pptx.readthedocs.io/en/latest/
- https://www.oracle.com/technical-resources/articles/database/python-with-database-11g.html

