
This piece was originally posted on my blog at legobox, if you want to follow the full series on Machine learning and my experiments with software development, check it out.
Introduction to ML: How to frame data
Origins.
Data has always been a problem, understanding it, dealing with it, sourcing it. Yea it's always been a dread to work with data, therefore the process of presenting data in understandable form also known as framing is pretty important.
Data as we know it can take all shapes and forms, from the text, images and audio files to CSV, SQL, and other data structures. Therefore in machine learning, collecting data, arranging data, and understanding it, is of utmost importance.
Framing is the process of arranging data in ways that can be easily understood by machine learning models.
In the piece we are going to explore more on framing and how it works, how we could use it and libraries in python which allow us to work with framing data easily.
What's framing.
Framing is about arranging data in ways that can be easily understood by machine learning algorithms, pretty simple. With supervised machine learning, Framing is seriously important.
Supervised machine learning can be viewed as ML systems learning how to combine input to produce useful predictions on never-before-seen data. which almost defines all of machine learning.
With framing, here are the key concepts to learn.
The key concept's of Framing: Features and Labels
Labels: These are outputs we are trying to predict, i.e the y in the y = mx + c equation.
Features : These are the inputs, x , these can be anything ranging from words / text to numbers etc.
Simply put Labels are the outputs, and features are the inputs, make no mistake though, Inputs and outputs, in this case, are not
Example
For an instance of data we can break the data sets into two categories for the process of training out models, These are particular instances of data relating feature to labels, these categories would include:
- Labeled examples
- Unlabelled examples.
The labeled examples are the ones in which we have features associated with their corresponding labels, while the unlabelled are those with no corresponding label.
For example, here's a labeled example of California housing data.

The unlabelled examples contain features but no label, This is meant for testing after training in order to ascertain and predict the values.

In order to expand our understanding of Framing, we have to take a brief look at models how they work and how it affects how we frame data.
What are Models.
We all know what models are, the usual slim beautiful women, on runways and IG, but in the study of Machine learning and mathematics in general, Models are definitions of relationships between features and labels, i.e they are the relationship between a set of inputs and a set of outputs, therefore, they outline how a certain input produces a certain output.
Models are definitions of relationships between features and labels
There are two major phases of a model's life.
- Training - The model looks at several examples, draws relationships between the features and the labels. To learn how they work.
- Inference. - The model begins testing out predictions on new data to previously unseen before.
So how do we get started with defining features and labels from our data? To do this in python (which is a very common base for practicing Machine learning because of the abundance of tools and libraries), we would use Pandas in reading and describing out data in tabular form. So let's have a brief look at this.
Getting data: A super brief intro to pandas.
Pandas is an open-source, BSD-licensed library providing high-performance, easy-to-use data structures and data analysis tools for the Python programming language.
Here's a sample call to obtain data using pandas.
    californiaHousingDf = pd.read_csv("https://download.mlcc.google.com/mledu-datasets/california_housing_train.csv", sep=",")
    californiaHousingDf.describe()
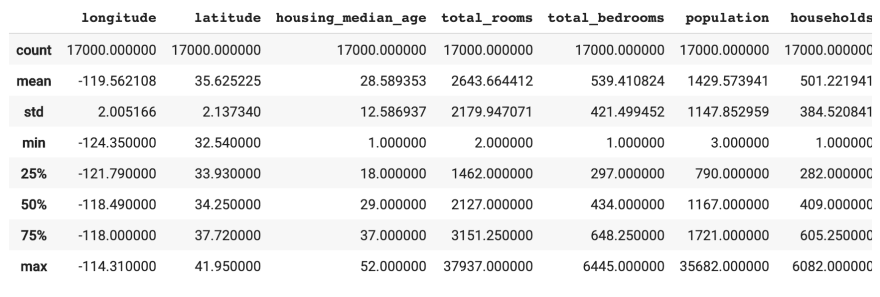
In this case, we collected data of the California real estate from the hyperlink using the pandas read_csv method, which would read the CSV data into a data-frame.
In pandas there are two primary data structures, these are.
- DataFrame, Which is like a relational data table, with rows and columns.
- Series, which is a single column.
Dataframes contain one or more series and a name for each series.
One way to create a Series is to construct a Series object. For example:
DataFrame objects can be created by passing a dict mapping string column names to their respective Series. If the Series don't match in length, missing values are filled with special NA/NaN values. Example:
But most of the time, you load an entire file into a DataFrame. The following example loads a file with California housing data. Run the following cell to load the data and create feature definitions:
Essentially data frames are two-dimensional descriptions of data. pretty lit stuff.
To define our feature, To start, we're going to use just one numeric input feature, total_rooms. The following code pulls the total_rooms data from our californiaHousingDf and defines the feature column using numeric_column, which specifies its data is numeric:
    # Define the input feature: total_rooms.
    my_feature = californiaHousingDf[["total_rooms"]]

    # Configure a numeric feature column for total_rooms.
    # here tf is tensorflow.
    feature_columns = [tf.feature_column.numeric_column("total_rooms")]
In this case, my_feature defines our features. To define our labels we could use, the median_house_value, to define this as a label we simply reference them from the data frame
    # Define the label.
    targets = californiaHousingDf["median_house_value"]
Thus we now have our features and labels in two different variables, for our models to train on.
Conclusion.
In this piece we've learned about how we go about framing data and separating the input and output into variables we can use in our models, We also took a brief look at models and how we can work with them. In our next article we are going to look at the Linear regression model, probably the simplest model in machine learning and how it works, to get a better insight into how other models would work to achieve the same goal.


Top comments (0)