
This week, our SQL ConstantCare® back end services started having some query timeout issues. Hey, we’re database people – we can do this, right? Granted, I work with Microsoft SQL Server most of the time, but we host our data in Amazon Aurora Postgres – is a query just a query and an index just an index regardless of platform? Follow along and let’s see how your SQL Server knowledge translates across platforms.
Finding AWS Aurora Postgres queries that need indexing help
I started the process by going into AWS Performance Insights, their free database performance monitoring tool for all RDS-hosted instances – including MySQL, Postgres, SQL Server, and Aurora. It comes with 7 days of performance history, which is plenty enough to help with most real time troubleshooting.
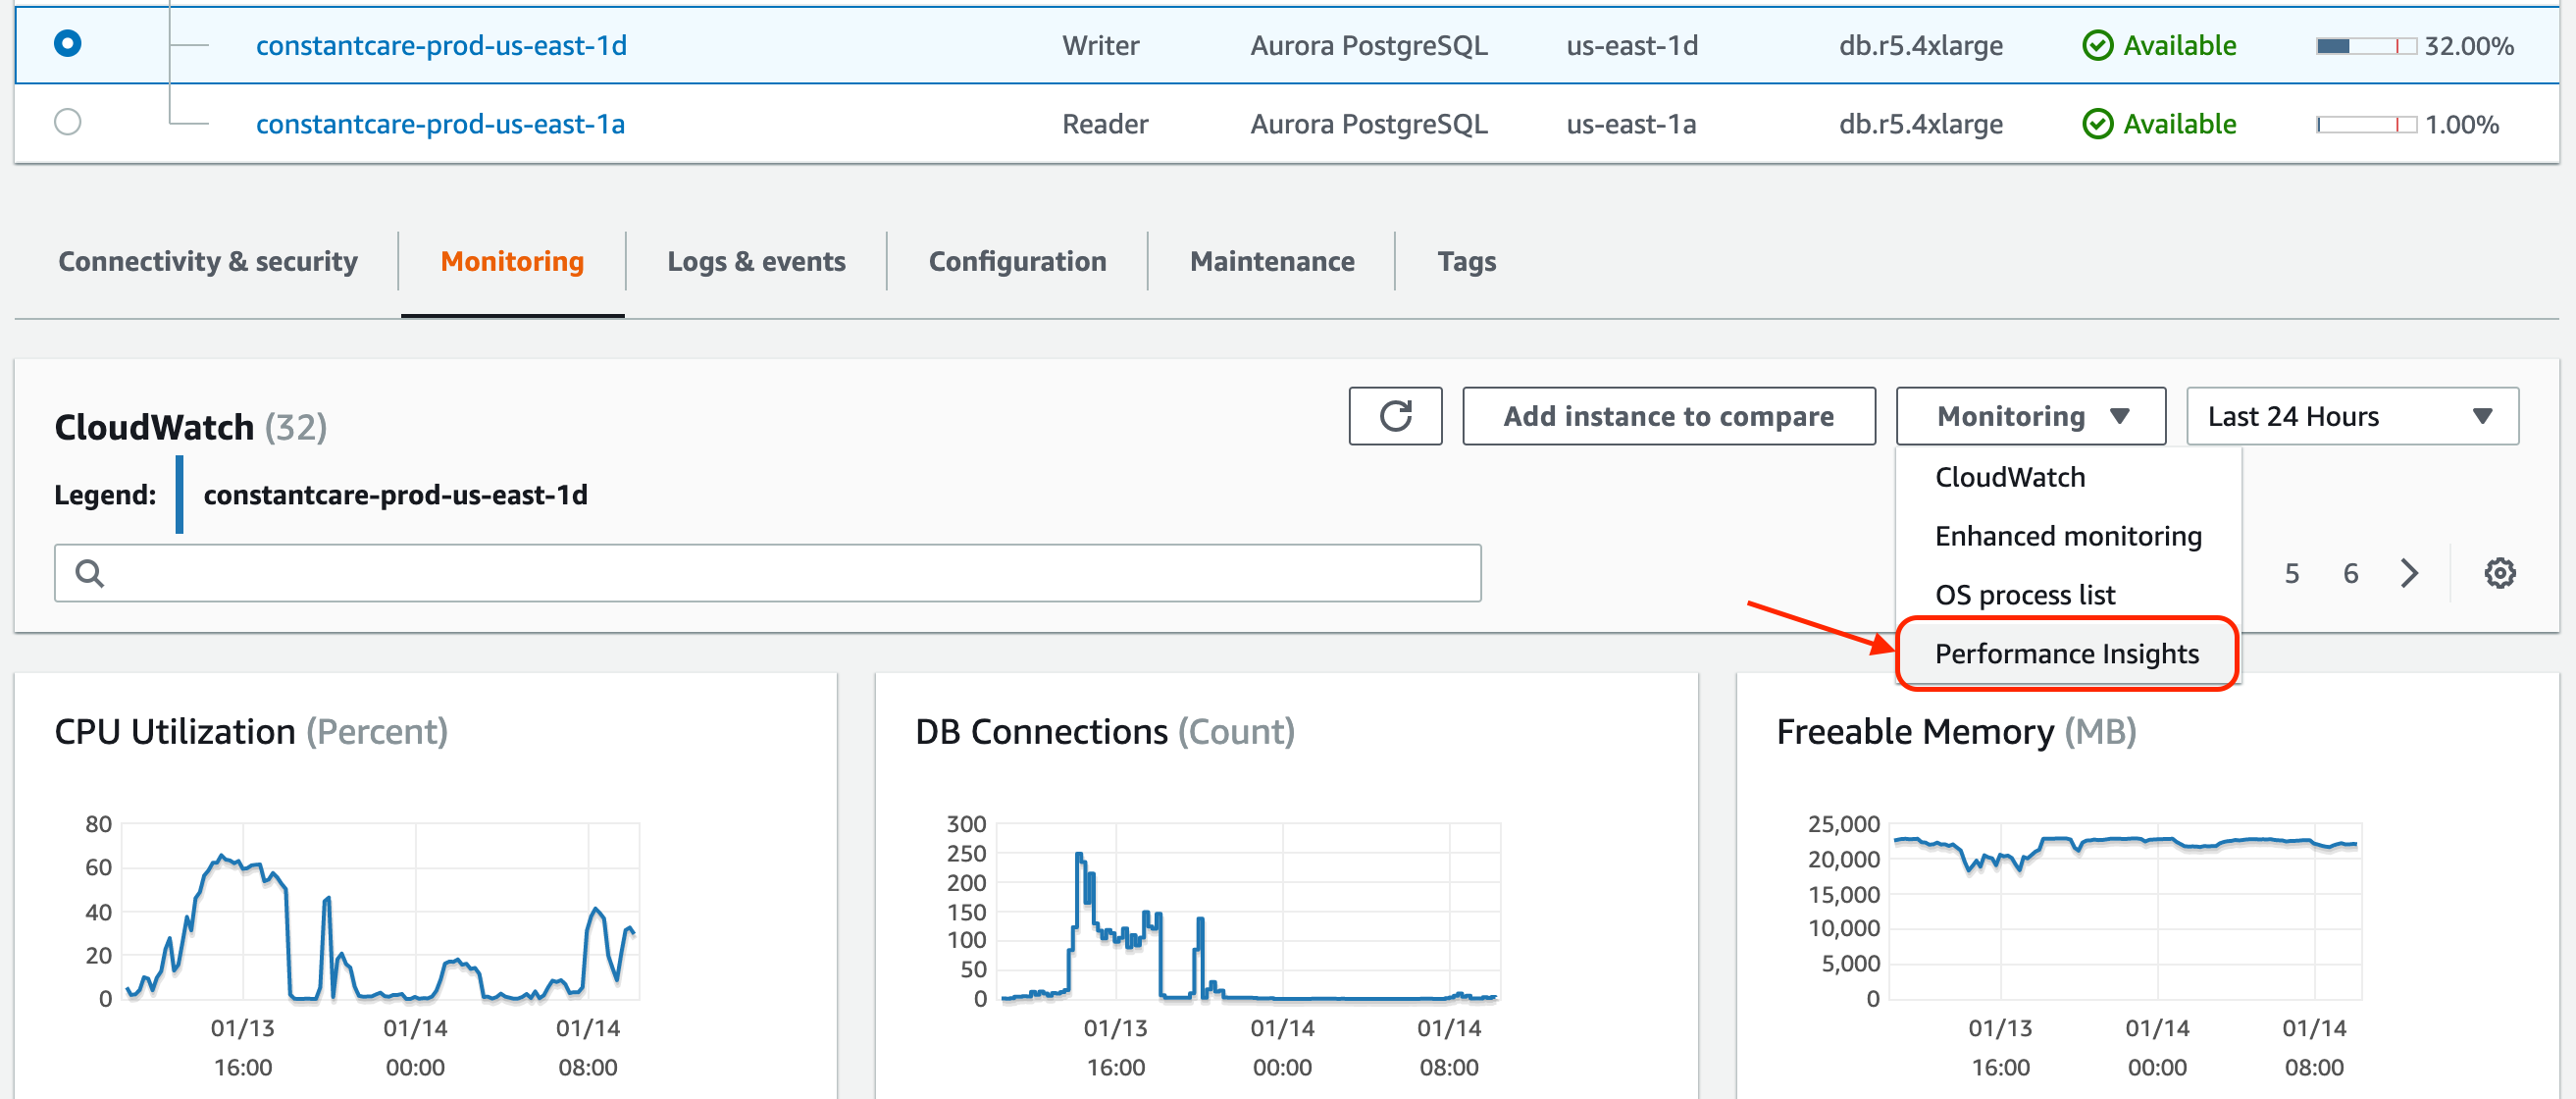
It’s not exactly intuitive to find: in the RDS console, when looking at the monitoring graphs for your instance, you have to hit the Monitoring dropdown, and choose Performance Insights:
I switched my time scale to 24 hours, saw an area of the chart I wanted to zoom into, and then selected that area of the graph with my mouse (trackpad, whatever):

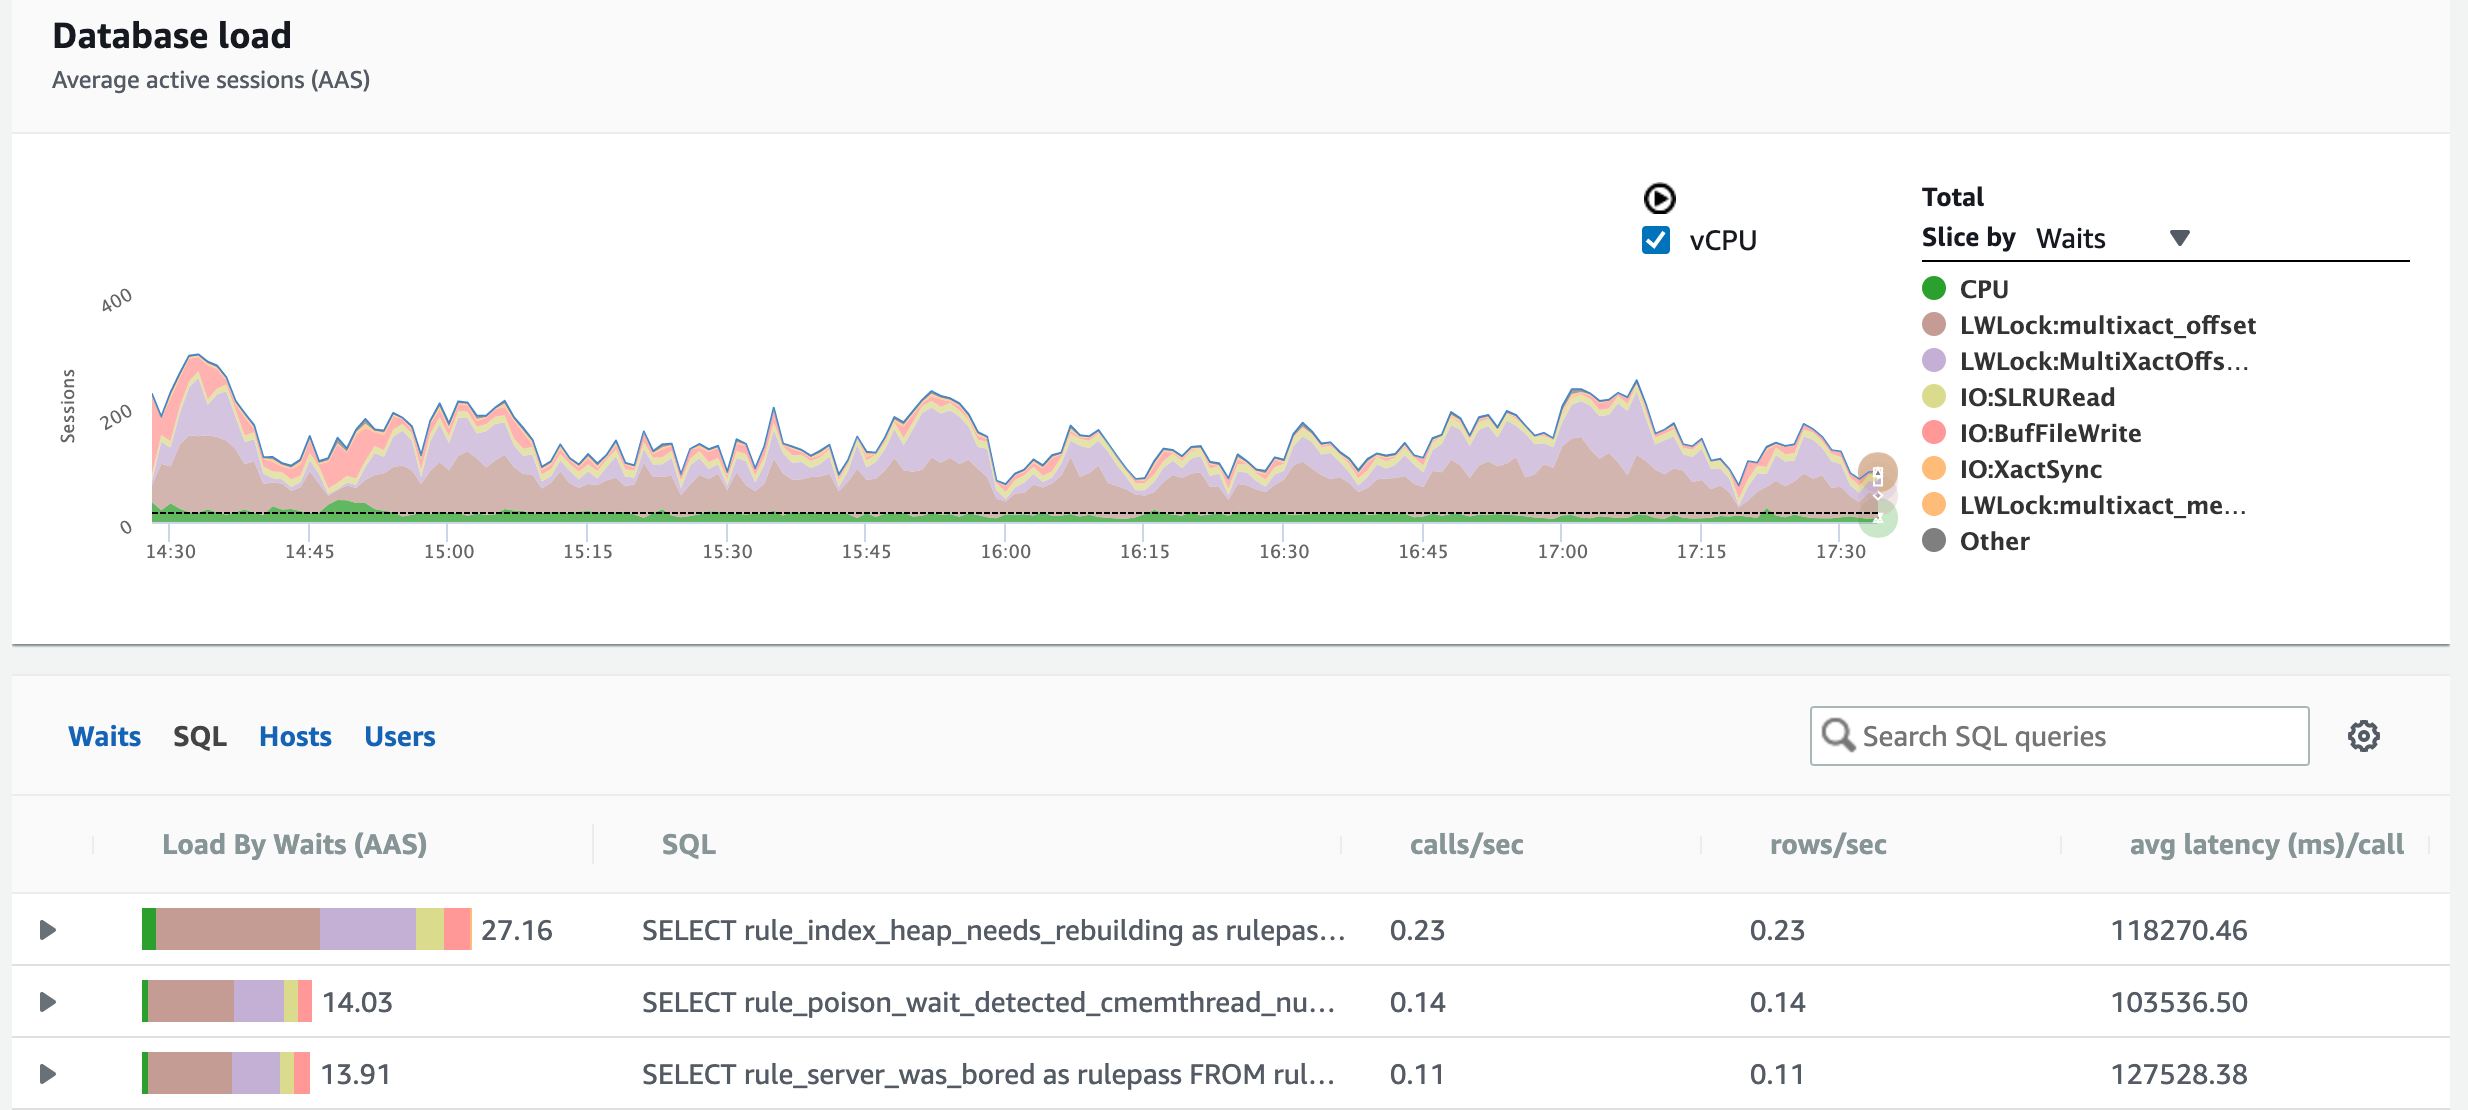
The graph switches to the wait stats for that specific time range, and on the right side, the default slicing is by waits, so I can investigate where the server’s bottleneck is:
Or if I want to figure out which queries used the most resources overall, I can change that slice to queries:
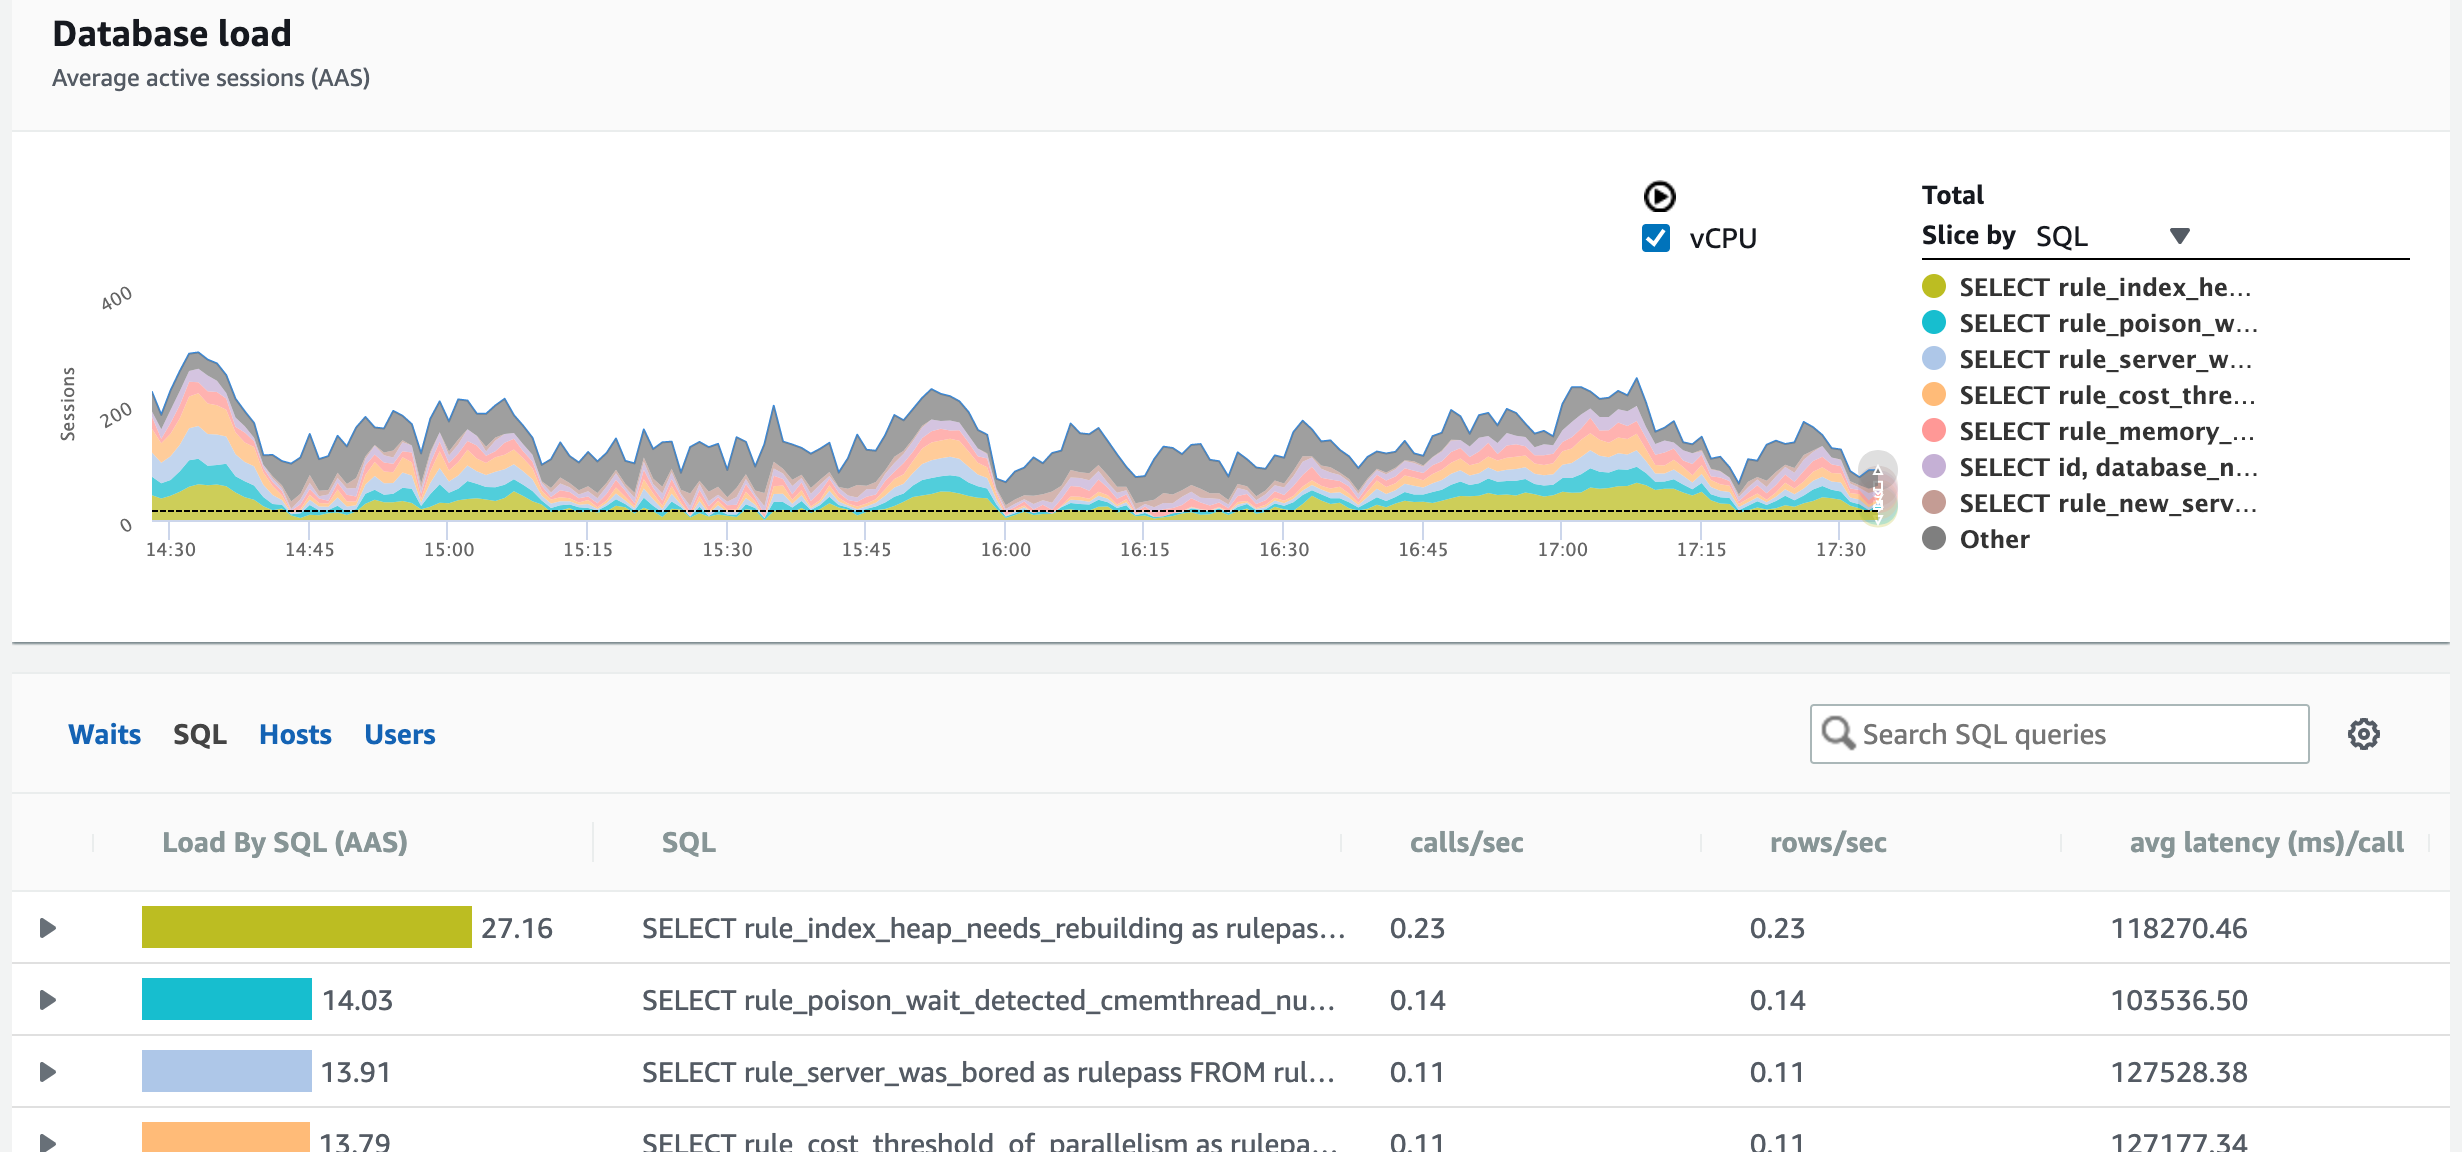
And I get a color-coded list of which queries used the most resources. That’s pretty doggone easy. Looks like I need to do some tuning for the query that checks to see whether your heaps need to be rebuilt – and now things start to get a little more complicated.
Designing an index based on the SQL query
Here’s the first part of the query that I need to tune – it’s a CTE that kicks off the rule query, and it looks for heaps that have had more than 100,000 forwarded fetches since the last time we analyzed ’em a week ago:
|
1 2 3 4 5 6 7 8 9 10 11 12 13 14 15 16 17 18 |
SELECT osNow.connection_id, osNow.database_id, osNow.object_id, osNow.index_id, SUM(osNow.forwarded_fetch_count - osPrior.forwarded_fetch_count) AS forwarded_fetch_count FROM sys_dm_db_index_operational_stats osNow INNER JOIN sys_dm_db_index_operational_stats osPrior ON osPrior.connection_id = 3053 AND osNow.database_id = osPrior.database_id AND osNow.object_id = osPrior.object_id AND osNow.index_id = osPrior.index_id AND osNow.partition_number = osPrior.partition_number AND osNow.forwarded_fetch_count > osPrior.forwarded_fetch_count WHERE osNow.connection_id = 3082 GROUP BY osNow.connection_id, osNow.database_id, osNow.object_id, osNow.index_id HAVING SUM(osNow.forwarded_fetch_count - osPrior.forwarded_fetch_count) > 100000; |
The 3082 and 3053 are numbers I’m using to replace variables – normally, this code is driven by variables for the specific collection of DMV data that we’re analyzing, and the collection done around one week prior.
That sys_dm_db_index_operational_stats table only has one nonclustered index:
|
1 2 3 |
CREATE INDEX IF NOT EXISTS ix_sys_dm_db_index_operational_stats__connection_id__user_id__object_id__index_id ON sys_dm_db_index_operational_stats (connection_id, user_id, object_id, index_id, leaf_insert_count); |
Isn’t that if not exists syntax nifty? Postgres has so many cool shortcuts. And isn’t that index name terrible? This is what happens when you let Richie name things.
Anyhoo, let’s look at what the index has, versus what the query needs:
- connection_id = this is helpful, because we’re seeking to just one connection_id, meaning one collection of DMV data for one server on one day
- user_id: uh oh, our query isn’t using this at all, but it’s the second column in our index, meaning from this point forward, the data is essentially unsorted
- object_id, index_id: the table & index we’re analyzing (useful)
- leaf_insert_count: we’re not using that at all here (but we might be for other queries)
- And these fields aren’t in the index, but the query needs them: database_id, partition_number, forwarded_fetch_count
So I have a few things I could do here:
- I could add user_id into the query – because I do know it at runtime, and I could just as easily pass it in to make sure that SQL Server understood the rest of the ordering key fields could still be used as-is, but the index still won’t work without putting database_id in the index.
- I could build a new additional nonclustered index based on connection_id, database_id, object_id, index_id, and partition_number, possibly including forwarded_fetch_count. You don’t usually think of adding indexes tailored to fit every query, but this table essentially exists to satisfy just a handful of queries, so it might be realistic. The production table has 350M rows though, so I don’t wanna go wild and crazy with indexes here.
- I could tweak both the query and the index by adding user_id into the query, and then adding database_id, partition_number, and forwarded_fetch_count to the index. The key ordering on there would be a little tricky, and in a perfect world, I’d need to see all of the other queries that touch this table. Because Richie is what’s known in our industry as a 10X Full Stacks Developer™, he’s got all of our queries in source control, so it’s easy for me to do a quick search in the repo to find all queries that touch a table.
I chose to add a new index to perfectly cover this query – and based on my quick search of the repo, I don’t think the other index will be helpful to any of the other existing queries. Here’s the new index:
|
1 2 3 4 |
CREATE INDEX IF NOT EXISTS ix_sys_dm_db_index_operational_stats__connection_id__database_id ON sys_dm_db_index_operational_stats (connection_id, database_id, object_id, index_id, partition_number, forwarded_fetch_count, leaf_insert_count); |
(I honored Richie’s naming convention, but Postgres is shortening the names of the indexes, so I just embraced that.) That index is fairly straightforward, but to learn more about how I design indexes without looking at the query plan first, check out my Fundamentals of Index Tuning course.
Next, I need to see whether the query plan will use my index or not.
Finding out if the query uses my index, and how much it helps
Our production Aurora database is around 2TB, and obviously I don’t wanna go creating indexes on the fly in there. I want to create indexes in development first, and make sure that the query actually picks those indexes up, and see what kind of a difference it makes in the plan.
Using Azure Data Studio, to get an estimated query plan in Postgres, you highlight the query and then click the Explain button, which gives you:

<sigh> I know. Text. You’re probably used to graphical plans in tools like SQL Server Management Studio, SentryOne Plan Explorer, or JetBrains DataGrip, but I’m living in the dark ages over here in ADS. You can also use the explain command to dump out results in JSON format, and then copy/paste it into online visual plan viewers like PEV or explain, but those say that ADS’s output isn’t valid JSON, so, uh, yeah. I just use text. (I’m not sure if the problem is Aurora or ADS.)
Anyhoo, some of the important things to notice from the text are:
- There are two index scans, one for each connection_id: these are what you and I would consider index seeks in SQL Server because SQL Server would seek to one particular connection_id and then start reading, but then it’s going to scan all of that connection_id’s data because the rows aren’t sorted in a useful way.
- Those two index scans each have a cost of 1,113 query bucks.
- The query’s total cost is 2,227-2,244 query bucks.
Next, I created the index, and then I asked Aurora to explain the plan to me again:

The takeaways:
- The index accesses are now called “Index Only Scan” (and they use my new index) – because now the index completely covers the query, so there are no key lookups
- Each index scan only costs 0.43-739.92 query bucks
- The query’s total cost is 0.85-1494.62 query bucks
Ta-dah! Now I feel confident adding that index in production. Well, not me, personally – I’m going to add an issue in Github explaining what I want to do and why, and then open a pull request with the new index. See, I don’t actually have write permissions in production. Only Richie does. I’m the pointy-headed boss around here, and the last thing I should be doing is changing stuff in production.
Your SQL Server knowledge helps you elsewhere.
At the end of the day, a relational database is a relational database. There are differences in the ways that you interact with them, like the tools you use and the format of the output, but it’s not rocket surgery. If you had to take on a new database platform, you could! There are interesting differences between SQL Server and Postgres – the vacuum process is an interesting one, for example – but overall, they’re surprisingly similar.

9 Comments. Leave new
My responsibilities include supporting Oracle and SQL Server, and over the years I have found that my expertise in one platform helps with the other. If you can fix the problem in one, 9/10 times you know how to fix it in the other.
If anyone only has deep expertise in one platform, getting your feet wet with something different is a lot of fun, albeit challenging at times. If you stuck with it, I promise you’ll walk away a better professional.
Actually I very much like the name of the index. Let’s you know exactly which columns are indexed without further examining the index 🙂
I have recently been dragged in for performance issues with a core (OLTP) system (iSeries DB2) – given minimal rights – and found the main table – 90 columns wide with 113 indexes on it – yep – you have guessed it – developer led – no DB2 DBA skills (and this has been for years).
I have had people saying to me that “it isn’t really a database” to justify themselves – I just reply with “erh – Yes it is”
I am still blowing into the wind though being the “new guy”
How has updating your resume been going?
Pretty well ?
Sorry – the smiley came out as a ?
🙂
“It’s not exactly intuitive to find” this basically sums up my entire experience with AWS. They are definitely not built for usability! Those dashboards do look pretty spiffy for fresh out of the box.
Do you know what monitoring settings you chose? And how much those settings are costing you in CloudWatch every month?
The review tool may be free, but the performance logs are stored at a cost. (I’m genuinely interested in the cost.)
M – great question, but it’s next to nothing – our entire S3 bill is something like $30/mo, and we store a ton of stuff in S3.