blog
PostgreSQL Database Monitoring: Tips for What to Monitor

Once you have your database infrastructure up-and-running, you’ll need to keep tabs on what’s happening. Monitoring is a must if you want to be sure everything is going fine or if you might need to change something.
For each database technology there are several things to monitor. Some of these are specific to the database engine or the vendor or even the specific version that you’re using.
In this blog, we’ll take a look at what you need to monitor in a PostgreSQL environment.
What to Monitor in PostgreSQL
When monitoring a database cluster or node, there are two main things to take into account: the operating system and the database itself. You will need to define which metrics you are going to monitor from both sides and how you are going to do it. You need to monitor the metric always in the context of your system, and you should look for alterations on the behavior pattern.
In most cases, you will need to use several tools (as it is nearly impossible to find one to cover all the desired metrics.)
Keep in mind that when one of your metrics is affected, it can also affect others, making troubleshooting of the issue more complex. Having a good monitoring and alerting system is important to making this task as simple as possible.
Operating System Monitoring
One important thing (which is common to all database engines and even to all systems) is to monitor the Operating System behavior. Here are some points to check here.
CPU Usage
Excessive percentage of CPU usage could be a problem if it’s not usual behavior. In this case, is important to identify the process/processes that are generating this issue. If the problem is the database process, you will need to check what is happening inside the database.
RAM Memory or SWAP Usage
If you’re seeing a high value for this metric and nothing had changed in your system, you probably need to check your database configuration. Parameters like shared_buffers and work_mem can affect this directly as they define the amount of memory to be able to use for the PostgreSQL database.
Disk Usage
An abnormal increase in the use of disk space or an excessive disk access consumption are important things to monitor as you could have a high number of errors logged in the PostgreSQL log file or a bad cache configuration that could generate an important disk access consumption instead of using memory to process the queries.
Load Average
It’s related to the three points mentioned above. A high load average could be generated by an excessive CPU, RAM or disk usage.
Network
A network issue can affect all the systems as the application can’t connect (or connect losing packages) to the database, so this is an important metric to monitor indeed. You can monitor latency or packet loss, and the main issue could be a network saturation, a hardware issue or just a bad network configuration.
PostgreSQL Database Monitoring
Monitoring your PostgreSQL database is not only important to see if you’re having an issue, but also to know if you need to change something to improve your database performance, that is probably one of the most important things to monitor in a database. Let’s see some metrics that are important for this.
Query Monitoring
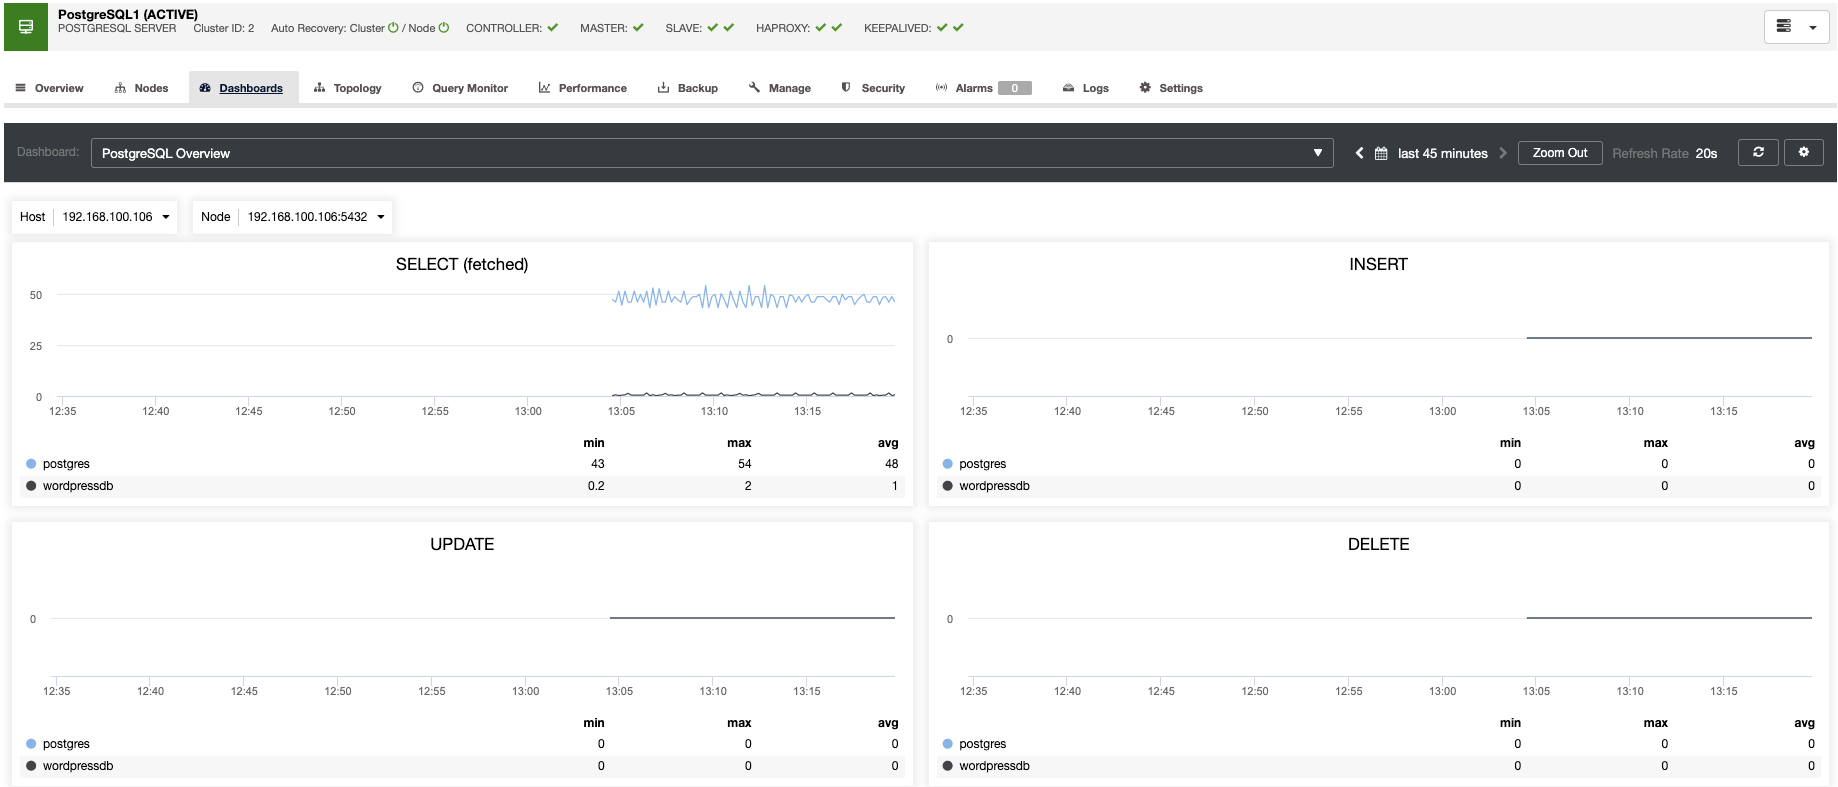
By default, PostgreSQL is configured with compatibility and stability in mind, so you need to know your queries and his pattern, and configure your databases depending on the traffic that you have. Here, you can use the EXPLAIN command to check the query plan for a specific query, and you can also monitor the amount of SELECT, INSERT, UPDATE or DELETEs on each node. If you have a long query or a high number of queries running at the same time, that could be a problem for all the systems.
Monitoring Active Sessions
You should also monitor the number of active sessions. If you are near the limit, you need to check if something is wrong or if you just need to increment the max_connections value. The difference in the number can be an increase or decrease of connections. Bad usage of connection pooling, locking or network issue are the most common problems related to the number of connections.
Database Locks
If you have a query waiting for another query, you need to check if that another query is a normal process or something new. In some cases, if somebody is making an update on a big table, for example, this action can be affecting the normal behavior of your database, generating a high number of locks.
Monitoring Replication
The key metrics to monitor for replication are the lag and the replication state. The most common issues are networking issues, hardware resource issues, or under dimensioning issues. If you are facing a replication issue you will need to know this asap as you will need to fix it to ensure the high availability environment.
Monitoring Backups
Avoiding data loss is one of the basic DBA tasks, so you don’t only need to take the backup, you should know if the backup was completed, and if it’s usable. Usually, this last point is not taken into account, but it’s probably the most important check in a backup process.
Monitoring Database Logs
You should monitor your database log for errors like FATAL or deadlock, or even for common errors like authentication issues or long-running queries. Most of the errors are written in the log file with detailed useful information to fix it.
Impact of Monitoring on PostgreSQL Database Performance
While monitoring is a must, it’s not typically free. There is always a cost on the database performance, depending on how much you are monitoring, so you should avoid monitoring things that you won’t use.
In general, there are two ways to monitor your databases, from the logs or from the database side by querying.
In the case of logs, to be able to use them, you need to have a high logging level, which generates high disk access and it can affect the performance of your database.
For the querying mode, each connection to the database uses resources, so depending on the activity of your database and the assigned resources, it may affect the performance too.
PostgreSQL Monitoring Tools
There are several tool options for monitoring your database. It can be a built-in PostgreSQL tool, like extensions, or some external tool. Let’s see some examples of these tools.
Extensions
- Pg_stat_statements: This extension will help you know the query profile of your database. It tracks all the queries that are executed and stores a lot of useful information in a table called pg_stat_statements. By querying this table you can get what queries are run in the system, how many times they have run, and how much time they have consumed, among other information.
- Pgbadger: It’s a software that performs an analysis of PostgreSQL logs and displays them in an HTML file. It helps you to understand the behavior of your database and identify which queries need to be optimized.
- Pgstattuple: It can generate statistics for tables and indexes, showing how much space used by each table and index, is consumed by live tuples, deleted tuples or how much-unused space is available in each relation.
- Pg_buffercache: With this, you can check what’s happening in the shared buffer cache in real-time, showing how many pages are currently held in the cache.
External Monitoring Tools
- ClusterControl: It’s a management and monitoring system that helps to deploy, manage, monitor and scale your databases from a friendly interface. ClusterControl has support for the top open-source database technologies and you can automate many of the database tasks you have to perform regularly like adding and scaling new nodes, running backups and restores, and more.
- Nagios: It’s an Open Source system and network monitoring application. It monitors hosts or services, and manage alerts for different states. With this tool, you can monitor network services, host resources, and more. For monitoring PostgreSQL, you can use some plugin or you can create your own script to check your database.
- Zabbix: It’s a software that can monitor both networks and servers. It uses a flexible notification mechanism that allows users to configure alerts by email. It also offers reports and data visualization based on the stored data. All Zabbix reports and statistics, as well as configuration parameters, are accessed through a web interface.
Dashboards
Visibility is useful for fast issue detection. It’s definitely a more time-consuming task to read a command output than just watch a graph. So, the usage of a dashboard could be the difference between detecting a problem now or in the next 15 minutes, most sure that time could be really important for the company. For this task, tools like PMM or Vividcortex, among others, could be the key to add visibility to your database monitoring system.
Percona Monitoring and Management (PMM): It’s an open-source platform for managing and monitoring your database performance. It provides thorough time-based analysis for MySQL, MariaDB, MongoDB, and PostgreSQL servers to ensure that your data works as efficiently as possible.
VividCortex: It’s a cloud-hosted platform that provides deep database performance monitoring. It offers complete visibility into leading open source databases including MySQL, PostgreSQL, AWS Aurora, MongoDB, and Redis.
Alerting
Just monitoring a system doesn’t make sense if you don’t receive a notification about each issue. Without an alerting system, you should go to the monitoring tool to see if everything is fine, and it could be possible that you’re having a big issue since many hours ago. This alerting job could be done by using email alerts, text alerts or other tool integrations like slack.
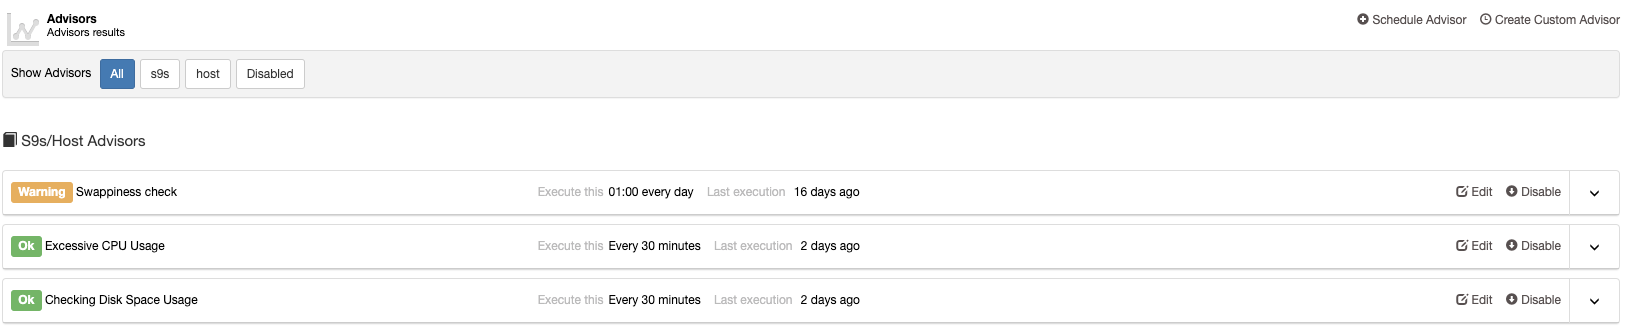
It’s really difficult to find some tools to monitor all the necessary metrics for PostgreSQL, in general, you will need to use more than one and even some scripting will need to be made. One way to centralize the monitoring and alerting task is by using ClusterControl, which provides you with features like backup management, monitoring and alerting, deployment and scaling, automatic recovery and more important features to help you manage your databases. All these features on the same system.
Monitoring Your PostgreSQL Database with ClusterControl
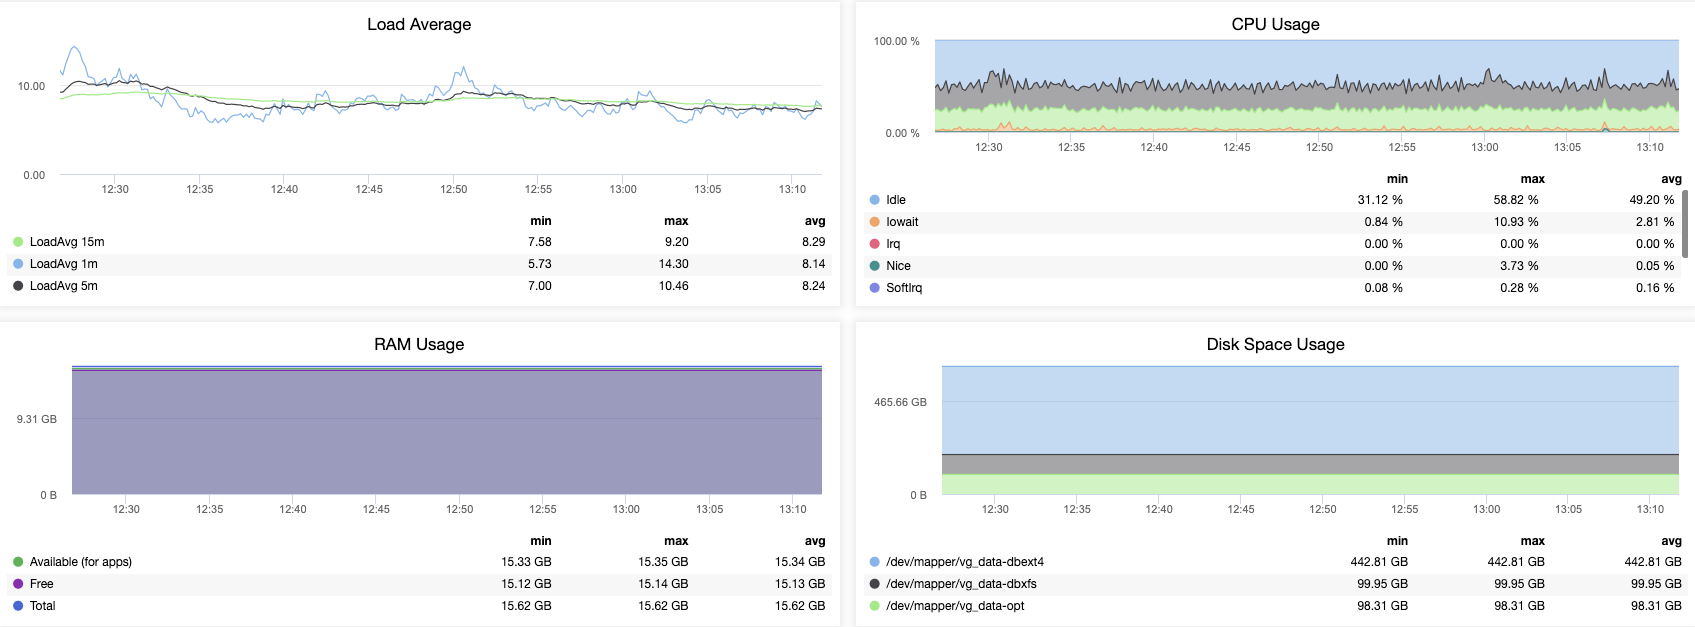
ClusterControl allows you to monitor your servers in real-time. It has a predefined set of dashboards for you, to analyze some of the most common metrics.
It allows you to customize the graphs available in the cluster, and you can enable the agent-based monitoring to generate more detailed dashboards.
You can also create alerts, which inform you of events in your cluster, or integrate with different services such as PagerDuty or Slack.
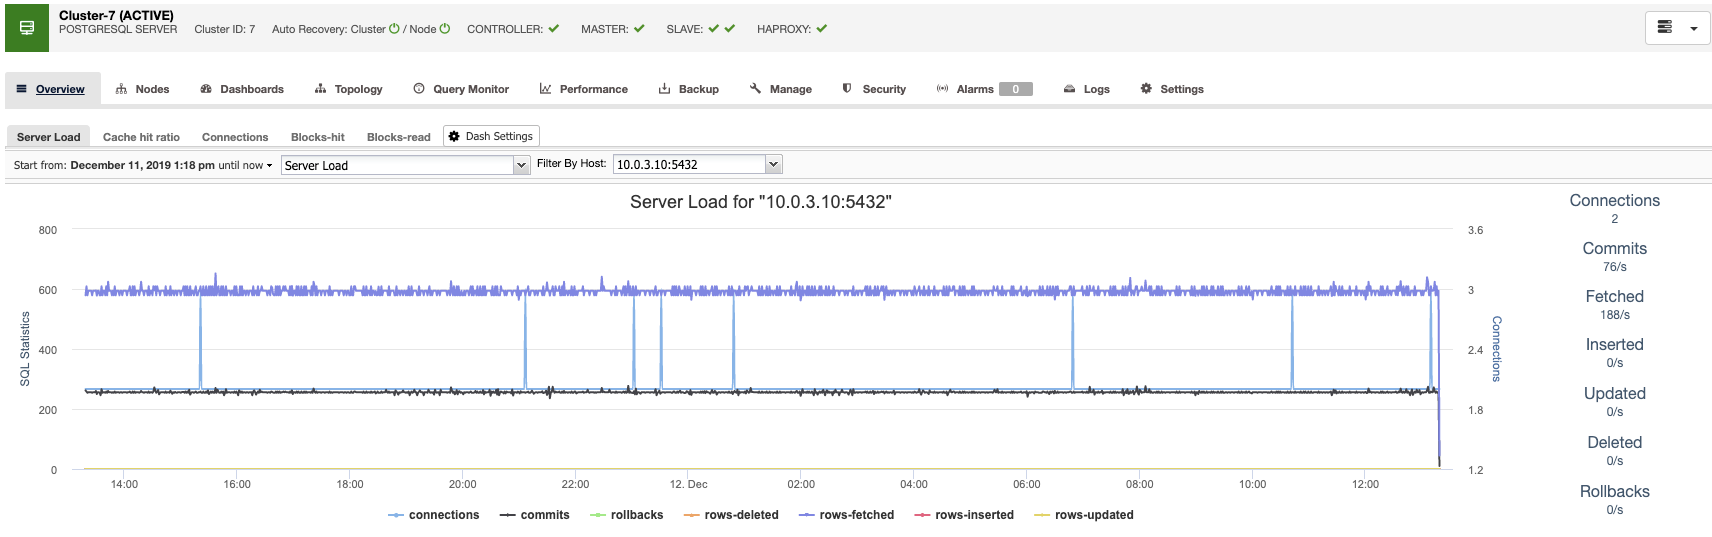
Also, you can check the query monitor section, where you can find the top queries, the running queries, queries outliers, and the queries statistics.
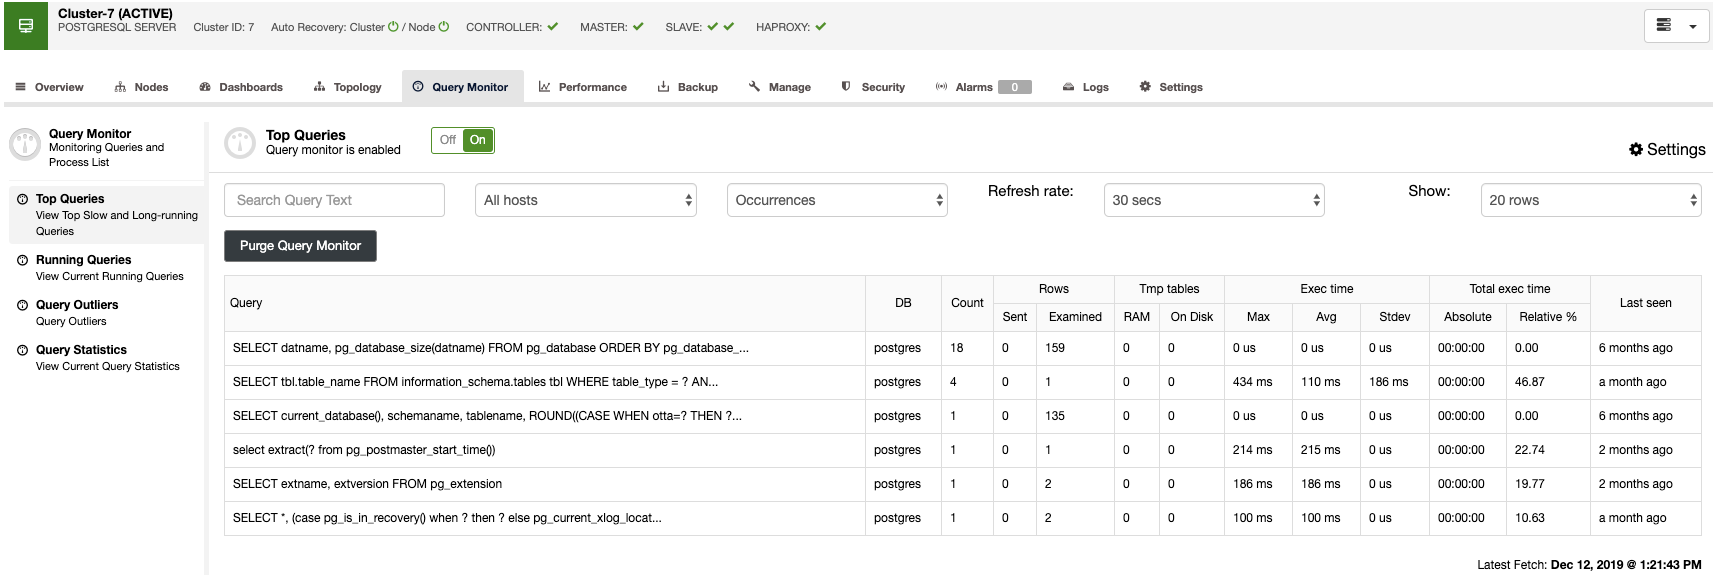
With these features, you can see how your PostgreSQL database is going.
For backup management, ClusterControl centralizes it to protect, secure and recover your data, and with the verification backup feature, you can confirm if the backup is good to go.
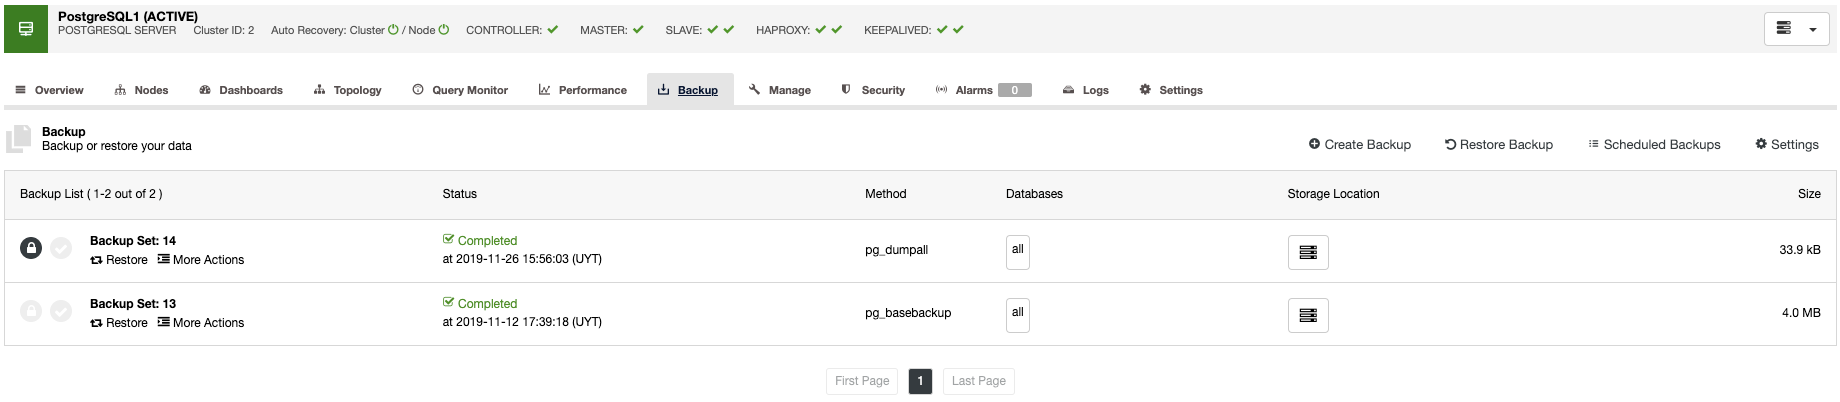
This verification backup job will restore the backup in a separate standalone host, so you can make sure that the backup is working.
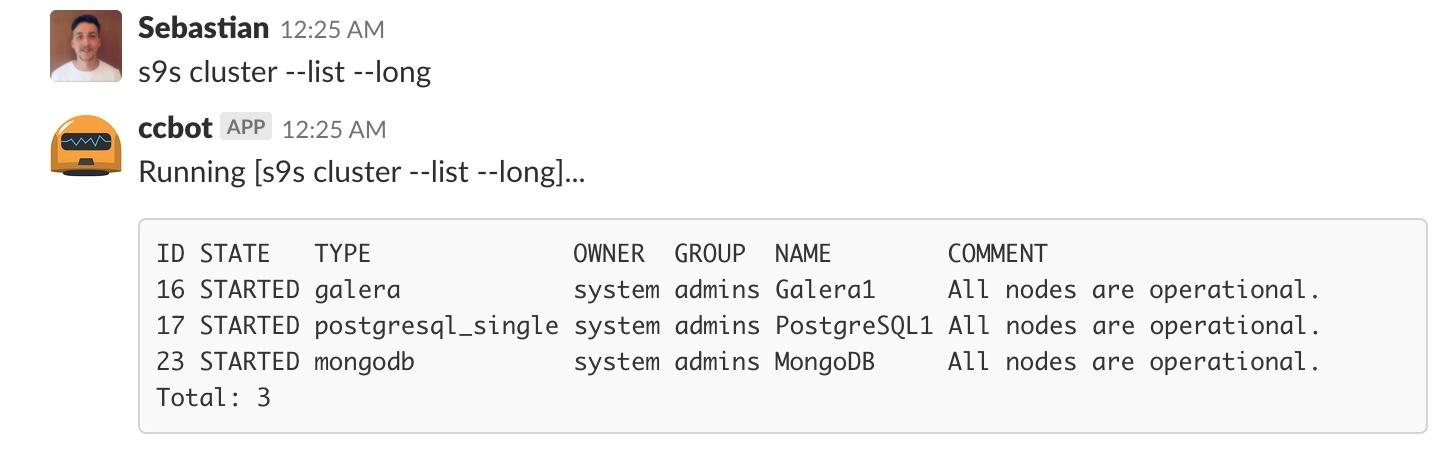
Monitoring with the ClusterControl Command Line
For scripting and automating tasks, or even if you just prefer the command line, ClusterControl has the s9s tool. It’s a command-line tool for managing your database cluster.
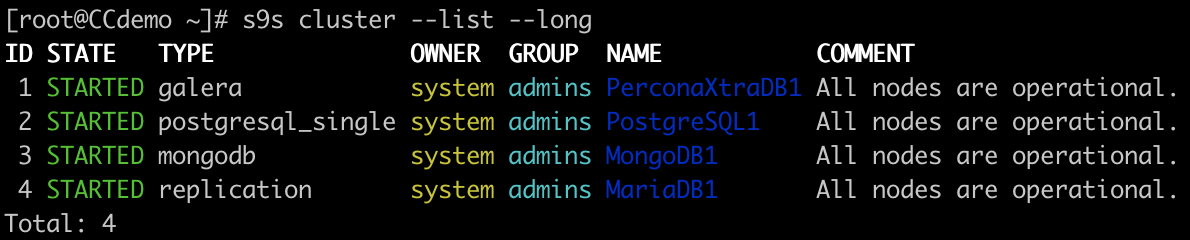
Cluster List
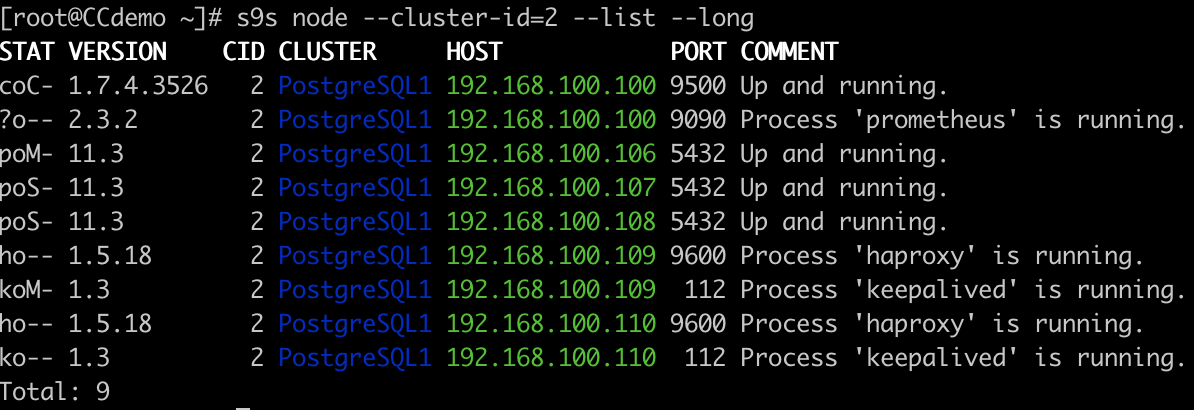
Node List
You can perform all the tasks (and even more) from the ClusterControl UI, and you can integrate this feature with some external tools like slack, to manage it from there.
Conclusion
In this blog, we mentioned some important metrics to monitor in your PostgreSQL environment, and some tools to make your life easier by having your systems under control. You could also see how to use ClusterControl for this task.
As you can see, monitoring is absolutely necessary, and the best way on how to do it depends on the infrastructure and the system itself. You should reach a balance between what do you need to monitor and how it affects your database performance.