Inevitably, when you are developing a game, you will need to debug your Unity project, and you’ll do this multiple times throughout development. Sometimes you may run into an issue that isn’t easily found by replaying the game numerous times. There are times where you’ll need tools to uncover a project’s issues faster. Fortunately, Unity has provided some helpful debugging tools to make squashing bugs a little easier. In addition, Visual Studio tools can be used alongside Unity for access to more debugging options.
A project showcasing many of the debugging options available to you is soon to follow. Many of the tools are some variation of displaying a message in the debug console. These messages can be plain text, warnings, or errors. There are also commands that draw debug lines in Unity’s Scene window as well as code that distinguishes if an exe of your game is a development build or not. All this will be utilized in a scene consisting of two capsules and some text.
Project Creation
Upon opening Unity Hub, create a new project, as shown in Figure 1.
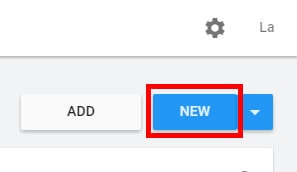
Figure 1: Creating a new project
A new window opens that displays all the project templates available. All the debugging tools shown here will work in any project, but the example to follow will be in 3D. Give your project a name and location and click the Create button shown in Figure 2.
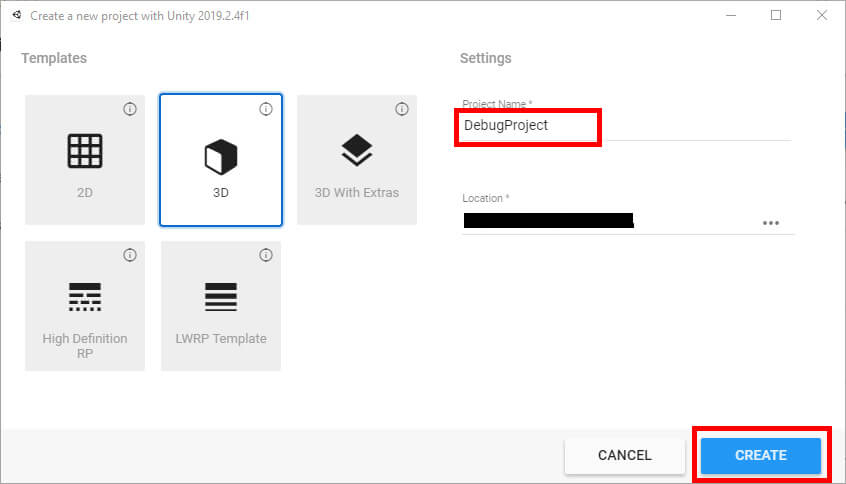
Figure 2: Project creation
Once the project has been created, you’ll need to create two capsule objects. This can be done in the Hierarchy menu by clicking Create 3D Object Capsule, as shown in Figure 3.
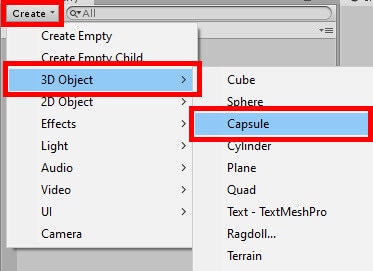
Figure 3: Creating capsule objects
Set the position of the two capsules to whatever you’d like, so long as the positions are noticeably different. The figure below put both capsules’ Z position at -5.6 and Y position at 0. The first capsule’s X position is at -2.9, and the second capsule’s X position is at 3.1. Figure 4 shows how the scene will look.
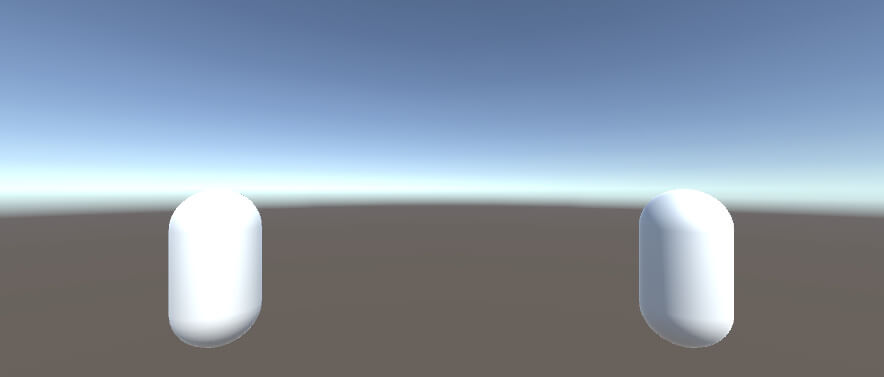
Figure 4: The current scene
Some text will be displayed whenever the game runs from a development build. If it is not a development build, then the text will be hidden. To create this text, use the same create menu as before and navigate to 3D Object-3D Text. Position the text wherever you wish and set the message by going to the Text Mesh component under the Inspector window and editing Text. Figure 5 shows some example text.

Figure 5: Entering text
Once everything is in place, create a new script by going into the Assets window, right-clicking, and selecting Create C# Script as shown in Figure 6.
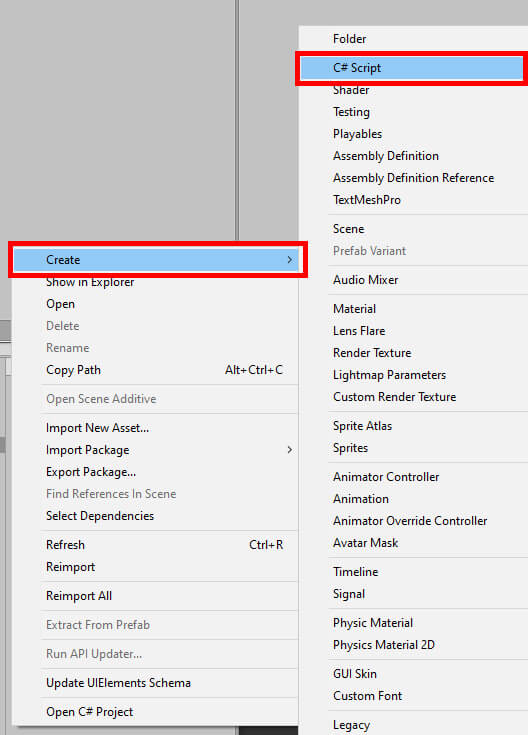
Figure 6: Creating a C# script
Give the script a name, then double click it to open Visual Studio.
Debug Messages and More
One of the most common ways to debug a game is to print messages to the debug console. The messages can contain any info you wish such as a string, integer value, boolean, or a combination of variable types. The most basic of these messages is Debug.Log, which prints a message of your choice. In the example below, Debug.Log should be placed within the Start method, and it will print “Let the games begin” to Unity’s debug console.
|
1 |
Debug.Log("Let the games begin"); |
The next two functions are similar to Debug.Log. In fact, they all begin with “Debug.Log.” These two commands are Debug.LogError and Debug.LogWarning. You may be able to tell what these commands do. LogError will log a custom error message to Unity’s console, while LogWarning prints a warning message to the console. Once again, these two functions will be put to use in the Start method. An error message will print “I am error” to the console and a warning message saying “I’m warning you.”
Debug.LogError(“I am error”);
Debug.LogWarning(“I’m warning you!”);
Debugging means more than printing messages; you can tell Unity to pause the game by using Debug.Break. This is useful whenever you need to pause the game at specific points but can’t manually pause it yourself. For example, if you want to make sure a projectile fired from an object is moving at the correct trajectory, you may wish to use Debug.Break to pause the game so you can analyze that trajectory and make any necessary corrections in code. Add the code under the Debug.Log statements.
|
1 |
Debug.Break(); |
Going back to message printing, you have Debug.Assert. Like Debug.LogError, it also prints an error message. But there is one key difference – it only prints if an assigned boolean is false. In this example, a boolean has been declared and is used in Debug.Assert. The boolean was given the attribute SerializeField to make it visible in the Unity editor. This was done so you can set the boolean to true or false and see how Debug.Assert works more clearly.
|
1 2 |
Debug.Assert(assertionBool, "I print to the screen if asssertionBool is false."); |
Finally, there’s Debug.LogException, which prints out whatever exception message is given to Unity’s console. There aren’t any real surprises here, as it behaves like printing an exception message would in any other C# project. In scenario taking place in the Start function, the program tried to convert a string into an integer, which of course won’t work if the string has anything but numbers. The exception is caught and displayed in the Unity console. Note: you’ll need to add using System; above the class for this code to work correctly.
|
1 2 3 4 5 6 7 8 9 10 11 |
try { // something that will throw an exception string someString = "This is some string"; Debug.Log("Breakpoint activate"); int someNum = Convert.ToInt32(someString); } catch (Exception ex) { Debug.LogException(ex); } |
Once finished, the Start method should appear like the one in Figure 7.
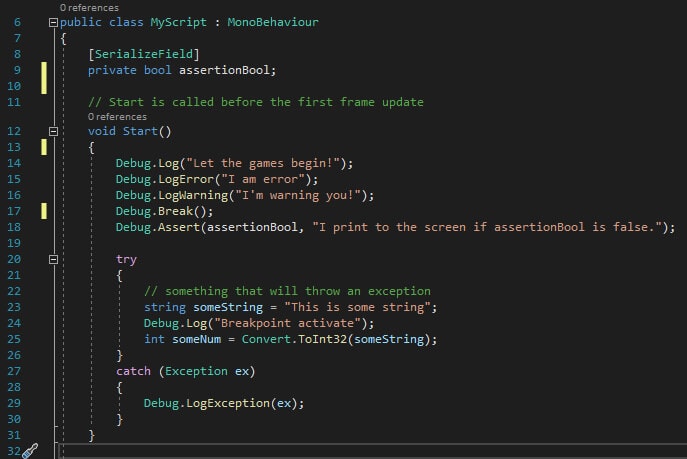
Figure 7: The complete Start method.
Other functions print messages to the console, including LogFormat and LogWarningFormat, but they’re very similar to the functions already shown. These are the functions you’ll want to know when it comes to printing information to the Unity console. If you want to see how all these work now, save the code and return to the Unity editor. Attach the script to any object you wish. The example in Figure 8 attaches the script to the Main Camera object.
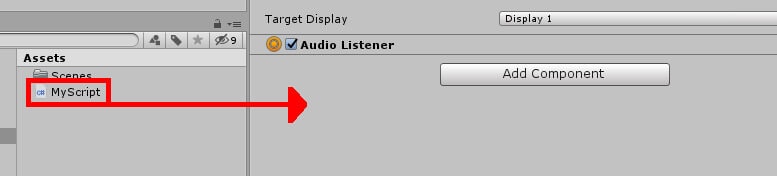
Figure 8: Attaching MyScript to an object
Set the Assertion Bool value to whatever you wish, then run the project. Nothing will happen in-game of course, but you can view the debug messages either by clicking on the console text in the lower right of the editor or by navigating to Window General Console shown in Figure 9. You may also notice that the project is currently paused, signified by the state of the pause button near the top of the editor. This is thanks to Debug.Break doing its work.
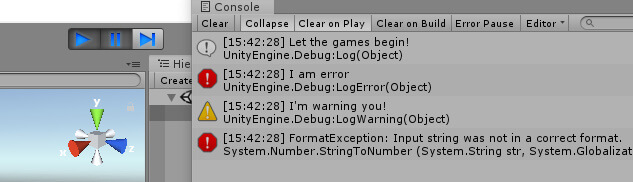
Figure 9: Unity debug console
Drawing Lines
The next two debug functions, Debug.DrawLine and Debug.DrawRay, draw lines in Unity’s Scene window while the game is running. What’s the difference? DrawLine, as the name implies, draws a line from point A to point B. In this project, the line will be drawn starting at one capsule object and ending at the other. DrawRay, on the other hand, draws out a ray using a starting point and extending out a certain direction. You would typically use DrawRay to better visualize where a raycast (an invisible line) is going. For instance, in many shooters, it’s not a physical bullet that comes out of the gun but instead, a raycast being fired. Developers will use little tricks, such as the appearance of a muzzle flash. This will look like an actual bullet leaves the gun, but there’s usually no object being shot out. From there, the game determines if you hit something based on if that raycast collided with an object.
Before you can try out anything, you’ll first need a couple of new variables. Below the declaration for assertionBool, enter the following:
|
1 2 3 4 |
[SerializeField] private Transform firstTransform; [SerializeField] private Transform secondTransform; |
These variables will hold the Transform data of the two capsule objects. Transforms include the position data of an object, which is what you’ll need for DrawLine. In the Update function you’ll write:
|
1 2 |
Debug.DrawLine(firstTransform.position, secondTransform.position, Color.red); |
As you can see, the line begins at firstTransform‘s, or the first capsule’s, position and goes to the second capsule’s position. The color of the line has also been set to red, though it can be whatever color you’d like. In addition, you can add a fourth parameter specifying how long you wish the line to be drawn in seconds. In this case, the code is in the Update method and doesn’t require a time since it will be drawn every frame. The same thing can be done in Debug.DrawRay.
As mentioned before, Unity will need a direction for drawing the ray. This will be done by creating a new variable of type Vector3 and defining the direction and, while you’re at it, how long the line will be. Once done, you can input that into DrawRay along with the starting position and a color. The example sets the starting position to the second capsule. It can be whatever object you wish including the camera object itself if you give it this as input for its first parameter.
|
1 2 3 |
Vector3 forward = transform.TransformDirection(Vector3.forward) * 10; Debug.DrawRay(secondTransform.position, forward, Color.blue); |
Figure 10 shows how the script looks with the new code (the Start method is collapsed in the below figure):
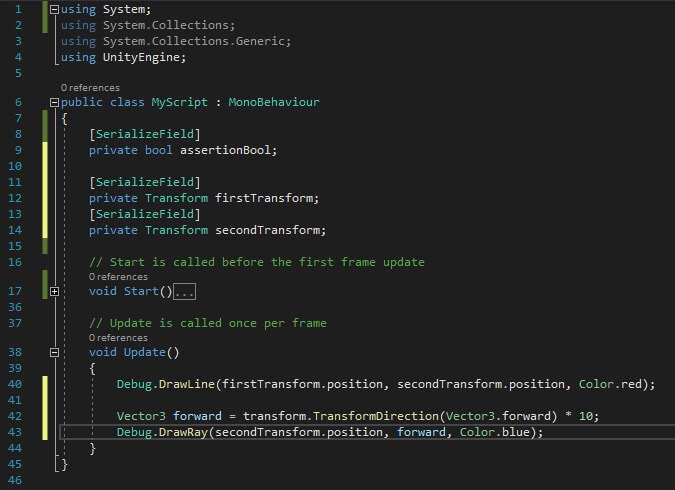
Figure 10: Debug.DrawLine and Debug.DrawRay
You can see how this looks in the editor by saving your code. Then back in Unity, make sure to fill in the First Transform and Second Transform fields in the MyScript component you attached to your object. In this example shown in Figure 11, the script was attached to Main Camera.
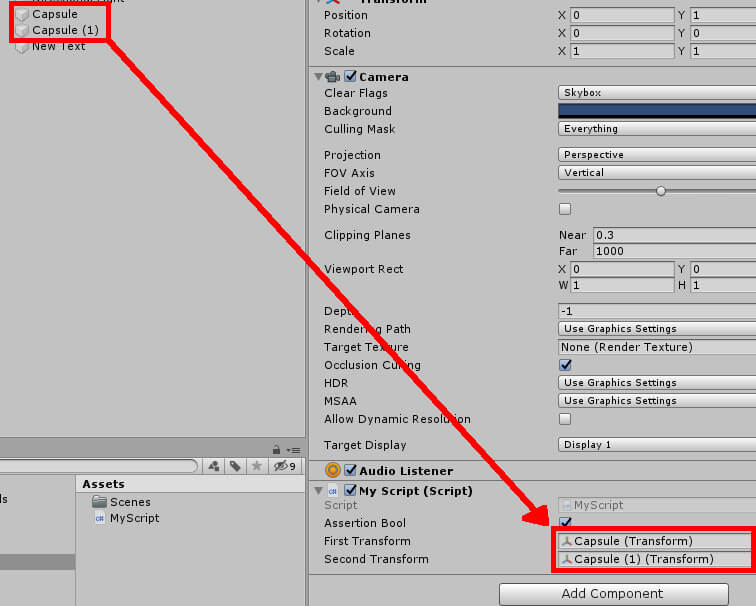
Figure 11: Setting First Transform and Second Transform
Run the project and have a look at the Scene window. You should see two lines: one red line between the two capsule objects, and a blue line coming from your object of choice, as shown in Figure 12.
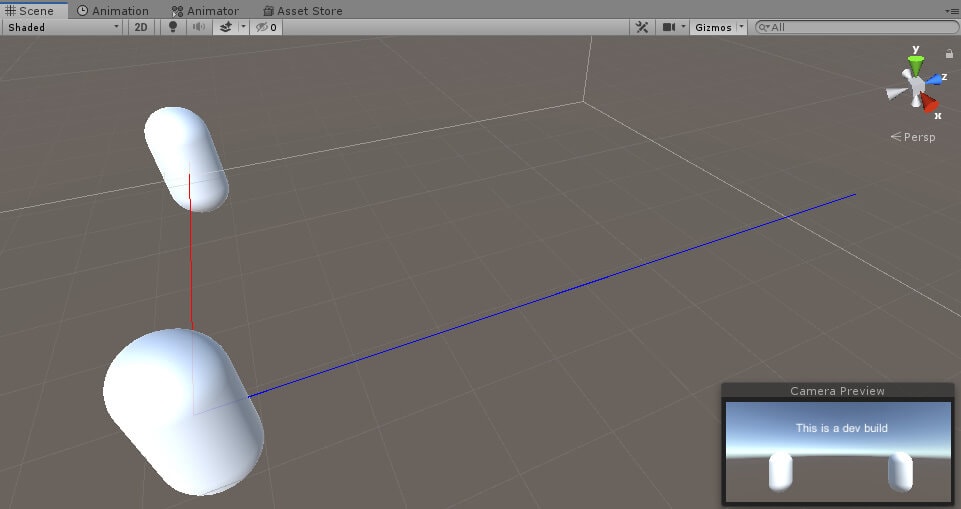
Figure 12: The debug line and ray as seen in the Scene window
Development Builds
There’s not much to be said about development builds as it relates to code, but there is one useful debug boolean that should be highlighted. Remember that text object created during the project creation phase? The text can appear or disappear based on if the build is a development build.
First, add a new variable declaration. This variable will be connected to the text object in Unity once the code is modified.
|
1 2 |
[SerializeField] private GameObject devBuildText; |
To get this to work, Debug.isDebugBuild will be put to use. Go back to the Start method and add the following code at the beginning:
if (Debug.isDebugBuild)
devBuildText.SetActive(true);
else
devBuildText.SetActive(false);
To properly test this will require running the game as an exe file. But there’s an issue. Once you run the project, there’s no way to close out of the game except via Alt-Tab or Task Manager. In the Update method, a simple if statement will be added. This will check if the escape key has been pressed at any point during the game’s runtime. If it has, then it will close the application. The code can be placed anywhere in the Update method and looks like this:
|
1 2 |
if (Input.GetKeyDown(KeyCode.Escape)) Application.Quit(); |
This is all that’s needed to disable an object based on if the exe is a development build or not. To see this in practice will require saving the code and returning to the Unity editor once more. In the MyScript component, you’ll need to fill the Dev Build Text field by dragging your text object from the Hierarchy window into it, as shown in Figure 13.
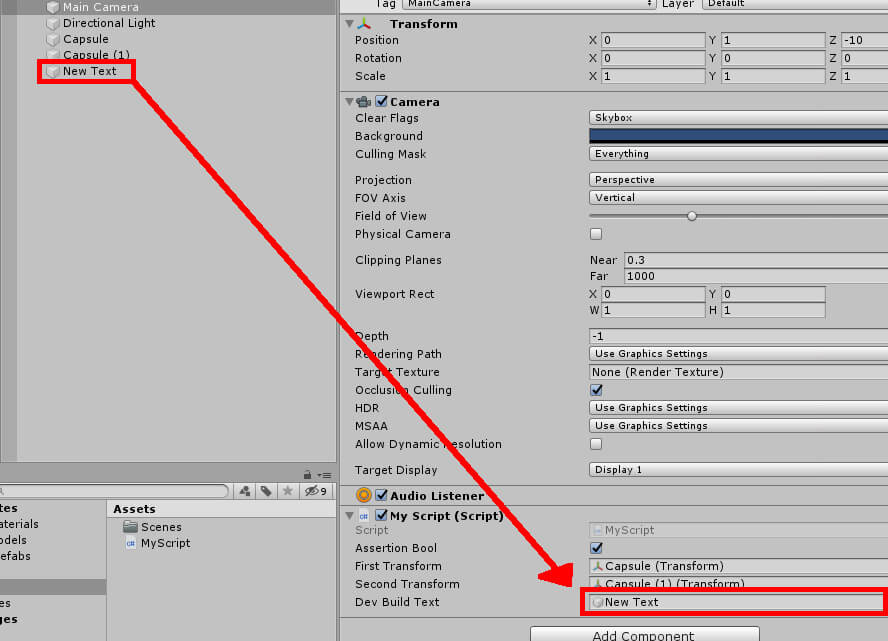
Figure 13: Setting Dev Build Text
Running the project from the editor will cause the text to remain visible. To better see the effect in action, go to the project’s build settings by navigating to File Build Settings. The following window appears, as shown in Figure 14.
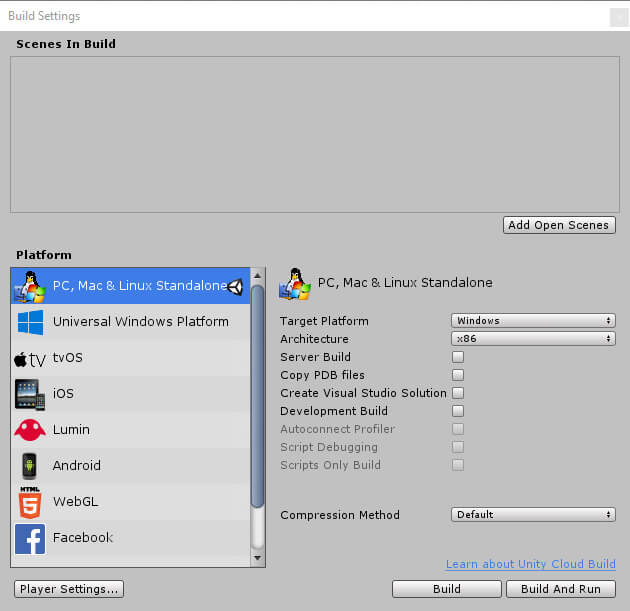
Figure 14: Build settings
You should see a checkbox for Development Build. Leave that unchecked if you want the text object to vanish in the exe. All you need to do is click the Build and Run button, choose a location, then let Unity build an exe. Once it’s finished, the exe should run automatically, and you’ll notice the text is nowhere to be seen.
Ticking the box to mark this as a development build will, of course, reveal the text, but there are also a few helpful items you get as a result. For starters, you ordinarily can only use Unity’s Profiler, a tool that tracks performance statistics in your game such as frame rate and CPU usage, in the editor. By marking this exe as a development build, you’ll be able to use the Profiler on your exe. There’s even an option in the build settings shown in Figure 15 that automatically connects the Profiler for you upon build completion. Of course, the Unity editor will still need to be open to do any of this.
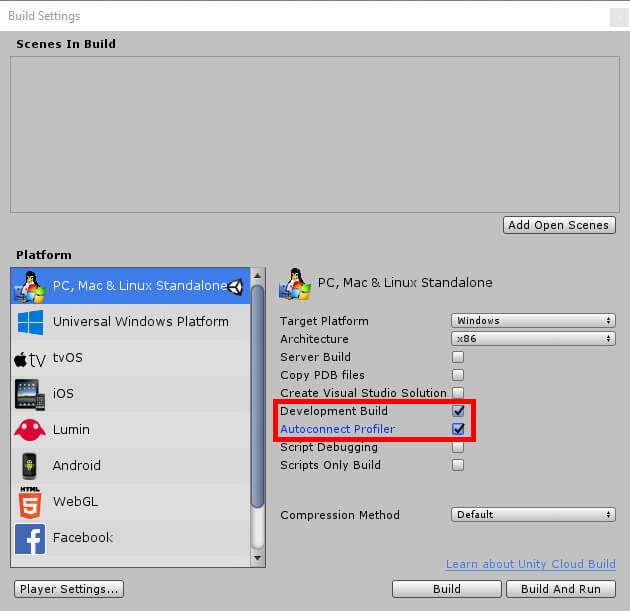
Figure 15: Activating Development Build and Autoconnect Profiler
But wait, there’s still more! You may have noticed after running your development build exe that some error messages showed up in the exe. They’re the same ones you created yourself earlier. Development builds also have a console that can print out messages, but unfortunately, the functionality appears to be limited to just error messages. Still, this can be useful as you playtest your game. If you click the error message, more information appears including the exact script and line of code the error occurred in.
Debugging Using Breakpoints in Visual Studio
You also have the option to use breakpoints in Visual Studio for Unity project debugging. This would be similar to the Debug.Break function introduced earlier, but you get the perks of using Visual Studio’s breakpoints such as seeing current variable values. To add a breakpoint, select a line of code and press F9. In Figure 16, the Debug.Break function in the Start method has been commented out to test out Visual Studio breakpoints. Debug.Log was added to the try method, and the breakpoint was set on the line with Debug.Log.
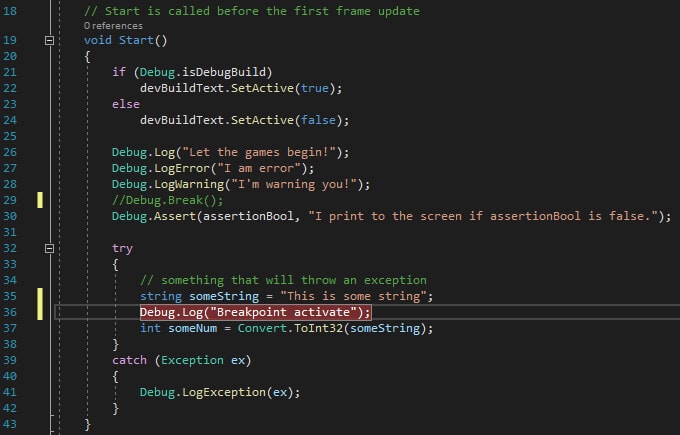
Figure 16: Setting a breakpoint
To see this in action, save the code, then select Attach to Unity in the top menu, as shown in Figure 17.
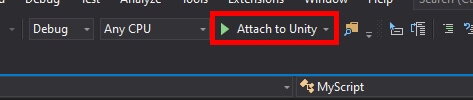
Figure 17: Attaching Visual Studio to Unity
Once Visual Studio is ready, run the project in the Unity editor. If done correctly, Unity will immediately pause the game at the point the breakpoint is reached. This would be the time to have a look at Visual Studio and gather whatever information you’re looking for in the Autos window shown in Figure 18. When you’re done looking, hit the Continue button in Visual Studio to resume the game in Unity.
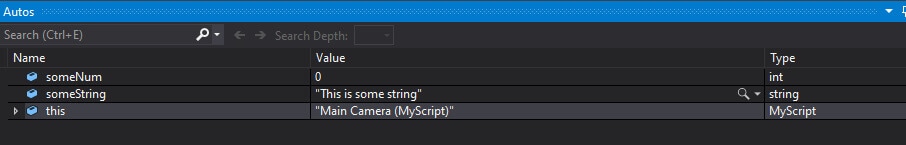
Figure 18: Checking out the values of variables in the Visual Studio debugger
Breakpoints can also be used with development builds, though there are a few extra steps to do so. First, you must make sure that you have Script Debugging selected. Doing so will cause a new option to appear. This option is Wait for Managed Debugger, and you’ll want that selected too, as shown in Figure 19.
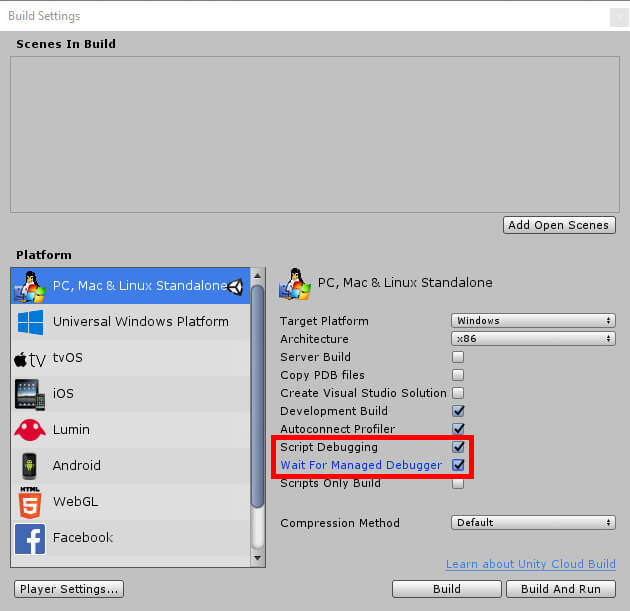
Figure 19: Activating Script Debugging and Wait For Managed Debugger
Build and run the project like before. Before launching the game, Unity should allow you a moment to attach whatever debugger you wish. Once it gives you the prompt, head over to Visual Studio, then navigate to Debug Attach Unity Debugger, as shown in Figure 20.
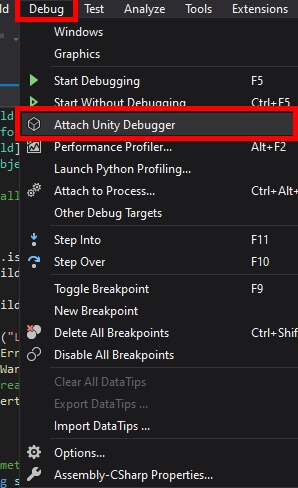
Figure 20: Navigating to Attach Unity Debugger
A window appears asking you to select the Unity instance. You should see two options in this window shown in Figure 21. Select the option of type Player and click the OK button. This is you telling Visual Studio you wish to attach the debugger to the exe.
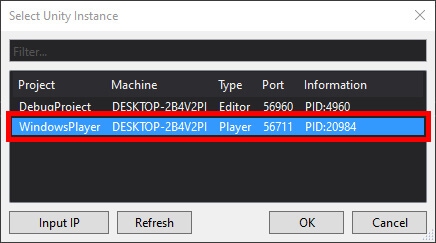
Figure 21: Selecting the Unity instance
Once again, wait for Visual Studio to be ready. When ready, you can select OK in Unity’s pop up box to start the game. Like last time, the game pauses at the breakpoint allowing you to see information like variable values. Since the breakpoint occurs in the Start method, you may be presented with a blank screen in the exe because Unity was not quite finished rendering everything out. Press the Continue button in Visual Studio to resume the project as usual.
Conclusion
As nice as it would be for all code to work flawlessly the first time, the fact is that dream rarely becomes a reality. Debugging is an inevitability in the life of a programmer. For the Unity developer, there are a handful of tools provided to make bug-squashing easier, ranging from simple custom messages to visualizing raycasts. Utilizing development builds can also make development easier, even coming with its own console so you can see any errors that pop up. You can also get crafty with development builds by creating custom tools that appear in development builds. These allow you to do whatever tasks you wish, such as skipping levels or tinkering with variables in real-time.

Load comments