Debugging Rust ARM CortexM Programs with Visual Studio Code
I've been toying with embedded Rust off and on for some time now.
I picked up one of the STM Discovery boards and it's been an interesting novelty for me to be able to remotely debug code running on the microcontroller. I've never been willing to spring for the external hardware debugger required to do so, but the Discovery has a STLink built into the board. The Rust Embedded and Discovery books have great instructions for remote debugging Rust programs, but rely soley on command line tools for doing so. I like the terminal as much as, if not more, than the next person, but it's also really nice to be able to set breakpoints and step through code right inside of the editor.
I tend to use VS Code as my main editor these days, so that's what we'll set up today. We'll take a look at the hardware and setting up the toolchain first, before moving on to setting up our editor. The prior is essentially a condensed version of the information in the Discovery book, so if you've already worked your way through that, feel free to skip to setting up VS Code.
The Hardware
This is the STM32F3DISCOVERY board by ST.

It has a 32 bit ARM CortexM4 processor and, as I mentioned earlier, a super convenient built in debugger. It's a really nice little board. The mcu itself has 256kb flash memory and 48kb RAM while the eval board also has an accelerometer, magnetometer, gryroscope, and lots of built in leds, IO, and peripherals to play with. To top it all off, its $16 price point brings it in as less expensive than the official Arduino Uno with its 32kb flash memory, 2kb RAM, and lack of any additional trinkets. To be fair the STM32F303VCT6 microcontroller costs 3 times the Uno's ATMega328p and is quite a bit more complex, but I really like this board.
Installing the toolchain
Below is a summary of the instructions in the Discovery book for setting up your environment for ARM development.
First, install the necessary build targets and extra cargo tools.
# itmdump
cargo install itm

# bin-utils
rustup component add llvm-tools-preview
rustup target add thumbv7em-none-eabihf
cargo install cargo-binutils
Then install the actual ARM toolchain itself.
If you're using Mac, be sure to use the instructions from the Rust Embedded Book. There have been multiple pull requests open to fix this in the Discovery book for a little while now.
brew tap ArmMbed/homebrew-formulae
brew install arm-none-eabi-gcc
Install openocd, we'll be using it to flash and debug our Discovery board.
brew install openocd
Connect the board to your laptop via the STLink USB port and verify you can connect via openocd.
$ openocd -f interface/stlink-v2-1.cfg -f target/stm32f3x.cfg
Open On-Chip Debugger 0.10.0
Licensed under GNU GPL v2
For bug reports, read
    http://openocd.org/doc/doxygen/bugs.html
Info : auto-selecting first available session transport "hla_swd". To override use 'transport select <transport>'.
adapter speed: 1000 kHz
adapter_nsrst_delay: 100
Info : The selected transport took over low-level target control. The results might differ compared to plain JTAG/SWD
none separate
Info : Unable to match requested speed 1000 kHz, using 950 kHz
Info : Unable to match requested speed 1000 kHz, using 950 kHz
Info : clock speed 950 kHz
Info : STLINK v2 JTAG v27 API v2 SWIM v15 VID 0x0483 PID 0x374B
Info : using stlink api v2
Info : Target voltage: 2.900414
Info : stm32f3x.cpu: hardware has 6 breakpoints, 4 watchpoints
Clone the Discovery repository and build the led-roulette example (it's not actually a led-roulette at this point, but it's a good example for using the gdb debugger).
git clone https://github.com/rust-embedded/discovery.git
cd discovery/src/05-led-roulette/
cargo build --target thumbv7em-none-eabihf
Making sure openocd is still running in another terminal, connect to the device with gdb.
Note: If you're running Linux or Windows, or installed the ARM toolchain without homebrew, the gdb command may be slightly different. See the "Flash It" section of the Discovery book.
$ arm-none-eabi-gdb -q target/thumbv7em-none-eabihf/debug/led-roulette
Reading symbols from target/thumbv7em-none-eabihf/debug/led-roulette
This will drop you into a gdb shell where you can execute the following commands to connect to the target, load the executable, set a breakpoint, and generally debug the code, with gdb commands like next and step.
(gdb) target remote :3333
Remote debugging using :3333
0x00000000 in ?? ()
(gdb) load
Loading section .vector_table, size 0x188 lma 0x8000000
Loading section .text, size 0x4102 lma 0x8000188
Loading section .rodata, size 0xf20 lma 0x8004290
Start address 0x8003df0, load size 20906
Transfer rate: 19 KB/sec, 5226 bytes/write.
(gdb) break main
Breakpoint 1 at 0x800018c: file src/05-led-roulette/src/main.rs, line 9.
(gdb) continue
(gdb) layout src
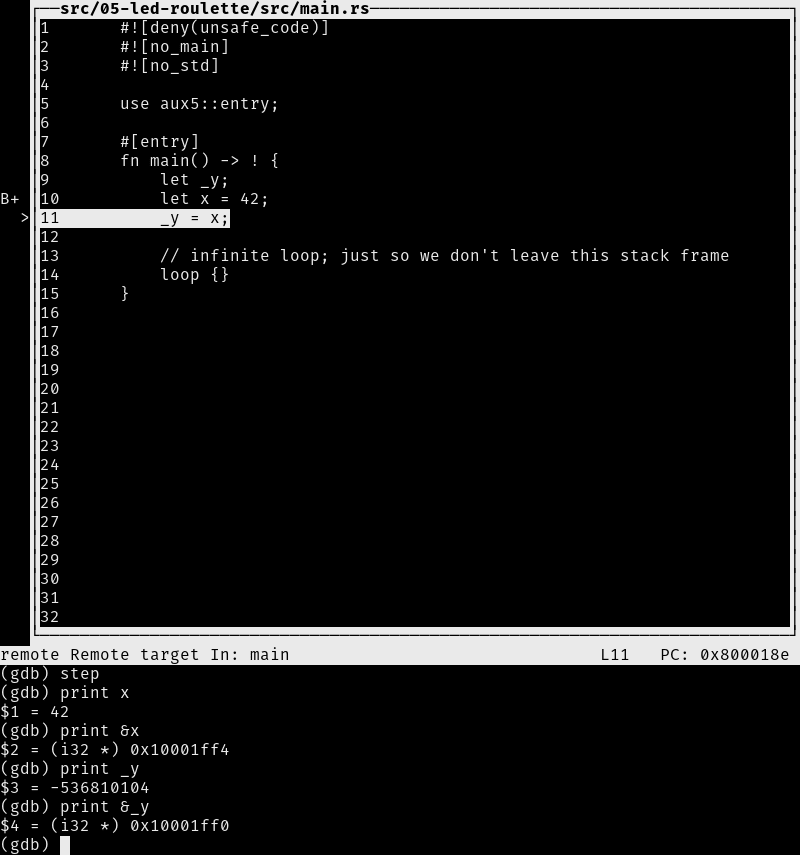
Improving the Terminal Experience
Eventually we'll want to use the built in debugging capabilities of VS Code, but first let's make a few adjustments to our cargo configuration to make our lives a bit easier.
First, we'll script our gdb session to automatically load the latest code and advance us to main instead of pre-init.
openocd.gdb
target remote :3333
load
break main
continue
Then, we can update our .cargo\config to use this script as part of the runner, as well as set the default build target.
[target.thumbv7em-none-eabihf]
runner = "arm-none-eabi-gdb -q -x openocd.gdb"
rustflags = [
  "-C", "link-arg=-Tlink.x",
]

[build]
target = "thumbv7em-none-eabihf"
Now, if we run cargo run, we'll automatically build for the correct target and run our gdb script.
$ cargo run
   Compiling led-roulette v0.1.0 (/Users/rubberduck/src/discovery/src/05-led-roulette)
    Finished dev [unoptimized + debuginfo] target(s) in 0.18s
     Running `arm-none-eabi-gdb -q -x openocd.gdb /Users/rubberduck/src/discovery/target/thumbv7em-none-eabihf/debug/led-roulette`
Reading symbols from /Users/rubberduck/src/discovery/target/thumbv7em-none-eabihf/debug/led-roulette...
main () at src/05-led-roulette/src/main.rs:10
10          let x = 42;
Loading section .vector_table, size 0x188 lma 0x8000000
Loading section .text, size 0x66a lma 0x8000188
Loading section .rodata, size 0x2c4 lma 0x8000800
Start address 0x8000196, load size 2742
Transfer rate: 8 KB/sec, 914 bytes/write.
Breakpoint 1 at 0x800018c: file src/05-led-roulette/src/main.rs, line 10.
Note: automatically using hardware breakpoints for read-only addresses.

Breakpoint 1, main () at src/05-led-roulette/src/main.rs:10
10          let x = 42;
(gdb)
Setting up Visual Studio Code
We'll need a couple of extensions from the marketplace.
Go ahead and install the Rust Language Server and Cortex-Debug extensions from the marketplace.
Next, we'll add a new launch configuration.
.vscode/launch.json
{
    "version": "0.2.0",
    "configurations": [
        {
            "type": "cortex-debug",
            "request": "launch",
            "servertype": "openocd",
            "cwd": "${workspaceRoot}",
            "executable": "./target/thumbv7em-none-eabihf/debug/led-roulette",
            "name": "Debug (OpenOCD)",
            "device": "STM32F303VCT6",
            "configFiles": [
                "interface/stlink-v2-1.cfg",
                "target/stm32f3x.cfg"
            ],
            "runToMain": true
        }
    ]
}
Notice that the configFiles property contains the same list of files that we passed to openocd earlier. Ensure you've stopped openocd in the other terminal, run the default build task (CMD + Shift + B), and then start the debug session. The code will break just inside of the main method. You're currently debugging the code running on the Discovery board from VS Code! You can step over and into the code, as well as see the current values of the individual registers under "CORTEX REGISTERS".
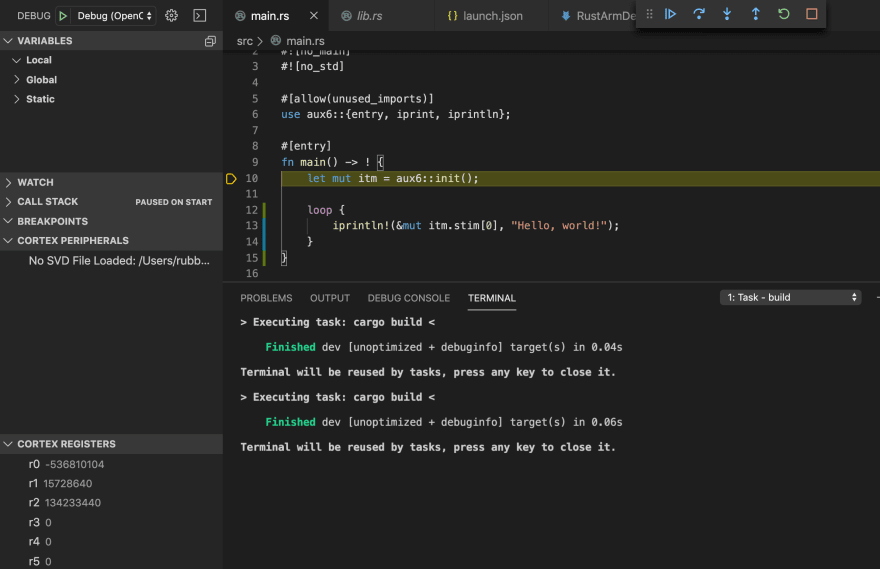
You may notice that there is also a "CORTEX PERIPHERALS" section in the debug sidebar, but it says "No SVD File Loaded: undefined". Let's fix that now. Download the SVD files and extract them. Copy STM32F303.svd into the src/05-led-roulette directory and add the following line to the launch.json file.
{
    "type": "cortex-debug",
    "request": "launch",
    "servertype": "openocd",
    //...
    "svdFile": "${workspaceRoot}/STM32F303.svd"
}
The next time you start the debugger, you'll now see all of the STM32F303's peripherals loaded. You can even directly write hex values to them!

Logging
The ARM Cortex M3 series has an Instrumentation Trace Macrocell (ITM) for sending log statements via the debugger. The Rust itm and panic-itm crates use this to send println and panic messages back to your development machine. Doing this from the terminal is described in Chapter 6: Hello World of the Discovery book. It's worth while running through that excercise before the next section. Note that you either need to jump pins SWO and PB3 or close solder bridge SB10 on the underside of the board. I opted for the latter as it's a pretty simple job to solder the bridge closed. If you're uncomfortable with, or don't have a solder iron, don't worry, the jumper wire works just fine too.
You're back? Awesome! Let's integrate itm into our editor too!
Copy .vscode/launch.json and .cargo/config from the 05-led-roulette directory into the 06-hello-world directory. Then modify the executable path and add the following swoConfig to your launch.json file.
launch.json
"executable": "./target/thumbv7em-none-eabihf/debug/hello-world",
//...
"swoConfig": {
    "enabled": true,
    "cpuFrequency": 8000000,
    "swoFrequency": 2000000,
    "source": "probe",
    "decoders": [
        { "type": "console", "label": "ITM", "port": 0 }
    ]
},
This is essentially equivalent to the gdb commands we ran from the Discovery book.
(gdb) # globally enable the ITM and redirect all output to itm.txt
(gdb) monitor tpiu config internal itm.txt uart off 8000000

(gdb) # enable the ITM port 0
(gdb) monitor itm port 0 on
We enable the monitor, tell the debugger that the CPU is running at 8MHz (the default clock speed for the STM32F303x controllers) and connect to ITM port 0 at 2MHz. Instead of writing the output to a specific file, the Cortex-Debug extension will create a new temporary file for us.
Build the program and begin debugging.
Navigate to the OUTPUT and select the SWO: ITM[port:0, type: console] output.
Step over the iprintln and you'll see the message written to the log.
![[2019-11-29T17:55:24.140Z] Hello, world!](https://res.cloudinary.com/practicaldev/image/fetch/s--KVjWJHi8--/c_limit%2Cf_auto%2Cfl_progressive%2Cq_auto%2Cw_880/https://thepracticaldev.s3.amazonaws.com/i/7eozetff2wdpkojk6yjh.png)
If you run the panic example, you'll see the panic message printed to the log.
[2019-11-29T18:04:58.320Z] panicked at 'Hello, world!', src/06-hello-world/src/main.rs:19:5
Automatically Build Before Uploading/Debugging
Up until this point, we've had to manually run cargo build prior to debugging any time we've changed the code. I've frustrated myself more than once by forgetting to do this, so I added a preLaunchTask to automatically build before upload. The build task is just the default cargo build task, but we need to add a label to it to be able to reference it from launch.json.
.vscode/tasks.json
{
    "label": "build",
    "type": "cargo",
    "subcommand": "build",
    "problemMatcher": [
        "$rustc"
    ],
    "group": {
        "kind": "build",
        "isDefault": true
    }
},
.vscode/launch.json
"preLaunchTask": "build",
Now when we press the "play" button to debug, we ensure we've compiled the latest version of our code first.
Full Config Files
That's about it. We have a fully functioning development environment in VS Code. Complete config files are below. Enjoy!
.vscode/tasks.json
{
    "version": "2.0.0",
    "tasks": [
        {
            "label": "build",
            "type": "cargo",
            "subcommand": "build",
            "problemMatcher": [
                "$rustc"
            ],
            "group": {
                "kind": "build",
                "isDefault": true
            }
        }
    ]
}
.vscode/launch.json
{
    "version": "0.2.0",
    "configurations": [
        {
            "type": "cortex-debug",
            "request": "launch",
            "name": "Debug (OpenOCD)",
            "servertype": "openocd",
            "cwd": "${workspaceRoot}",
            "executable": "./target/thumbv7em-none-eabihf/debug/compass",
            "preLaunchTask": "build",
            "device": "STM32F303VCT6",
            "configFiles": [
                "interface/stlink-v2-1.cfg",
                "target/stm32f3x.cfg"
            ],
            "svdFile": "${workspaceRoot}/STM32F303.svd",
            "runToMain": true,
            "swoConfig": {
                "enabled": true,
                "cpuFrequency": 8000000,
                "swoFrequency": 2000000,
                "source": "probe",
                "decoders": [
                    { "type": "console", "label": "ITM", "port": 0 }
                ]
            }
        }
    ]
}
.cargo/config
[target.thumbv7em-none-eabihf]
# Not used by the VS Code Debugger, only `cargo run`
runner = "arm-none-eabi-gdb -q -x openocd.gdb"
rustflags = [
  "-C", "link-arg=-Tlink.x",
]

[build]
target = "thumbv7em-none-eabihf"
openocd.gdb
# Not used by the VS Code Debugger, only `cargo run`
target remote :3333
set print asm-demangle on
set print pretty on
load
monitor tpiu config internal itm.txt uart off 8000000
monitor itm port 0 on
break main
continue


Top comments (3)
on Windows 11 it seems it is missing
This gives me a much nicer UI than the GDB tui, thank you.
The CortexM QuickStart template has some basic vscode configs now. I was able to talk the maintainers into accepting a PR, so if you use it to generate a new project this basically works out of the box.