
G-Scout Enterprise and Cloud Security at Etsy

As companies are moving to the cloud, they are finding a need for security tooling to audit and analyze their cloud environments. Over the last few years, various tools have been developed for this purpose. We'll look at some of them and consider the uses for them. Specifically, we'll take a close look at G-Scout, a tool I developed while working at NCC Group to look for security misconfigurations in Google Cloud Platform (GCP); and G-Scout Enterprise, a new tool with the same purpose, but tailored to the needs of security engineers at Etsy. We’ll also consider G-Scout Enterprise’s role within an ecosystem of other cloud logging and monitoring tools used at Etsy.
Cloud environments have a convenient feature which you won’t get from on premise servers: they have APIs. It’s similar for all the major cloud providers. They have a REST API which provides information on what services are being used, what resources exist, and how they are configured. An authorized user can call these APIs through a command line tool, or programmatically through a client library.
Those APIs provide information which is useful for security purposes. A classic example is a storage bucket (S3, GCS, etc.) which has been made public. It could be publicly readable, or publicly writable. Since we can use the API to see the permissions on any bucket we own, we can look for misconfigured permissions. So we go through all the API data we have for all our storage buckets, and look for permissions assigned to allUsers, or allAuthenticatedUsers.
Here are some other common examples:
- Firewall rules are too permissive.
- Unencrypted database connections.
- Users have excessive permissions.
Configuration Scanning Tools
Rather than making API calls and processing the data ad hoc, you can create a framework. A tool that will allow you, with a single command, to run various API calls to gather data on diverse resources, and then programmatically look for misconfigurations in that data. And in the end, you can have the tool place the results into a human-readable HTML report which you can browse according to your whims.
Scout 2 does all of the above for Amazon Web Services (AWS). G-Scout was created with a similar solution in mind as Scout 2, but for GCP. After Scout 2 there have followed plenty of other examples. Some, like G-Scout, have been open source, and others are available for purchase.
These tools continue to evolve. It is becoming increasingly common for companies to use more than one cloud provider. With this trend we’ve seen the creation of multi-cloud tools. Scout Suite has replaced Scout 2. Inspec supports AWS, Azure, and GCP.
And some of them have added features. Forseti Inventory stores the data collected in a SQL database (I’ve moved G-Scout in a similar direction, as we’ll see later). Forseti Enforcer will actually make changes to match policies.
These features are useful, but not so much to a consultant, since a consultant shouldn’t want any permissions aside from viewer permissions. Scout 2 was designed for consulting. The user can get viewer permissions, run the tool, and leave no trace. Forseti, on the other hand, requires Organization Admin permissions, and creates a database and other resources within the organization that is being audited.
Difficulties With G-Scout
But the same basic functionality remains at the core of each of these tools. When it came to G-Scout, that core functionality worked well for smaller companies, or those less committed to GCP. But when there are hundreds of projects, thousands of instances, and many other resources, it becomes difficult to go through the results.
Adding to this difficulty is the presence of false positives. Any automated tool is going to turn up false positives. Context may make something that seems like a finding at first glance, instead turn out to be acceptable. To return to our public storage bucket example, there are some cases where the content in the bucket is intended to be public. You can even serve a simple HTML website from a storage bucket. So it tends to fall to a human to go through and figure out which are false positives. Since it takes time to fix real findings, and the false positives don’t go away, running the tool frequently to see what’s new becomes untenable.
Finally, at Etsy, many of the findings G-Scout would turn up had already been found by other means, which we will explore a bit below.
We have a tool called Reactor. There is a stackdriver log sink for the organization, and those logs (with filters applied) go to a PubSub topic. There’s a cloud function that subscribes to that topic, and when it finds logs that match any of a further set of filters (the alerting rules) then it triggers an alert.
So for example, if someone makes a storage bucket public, an alert will trigger as soon as the corresponding stackdriver log is generated, rather than waiting for someone to run G-Scout at some point.
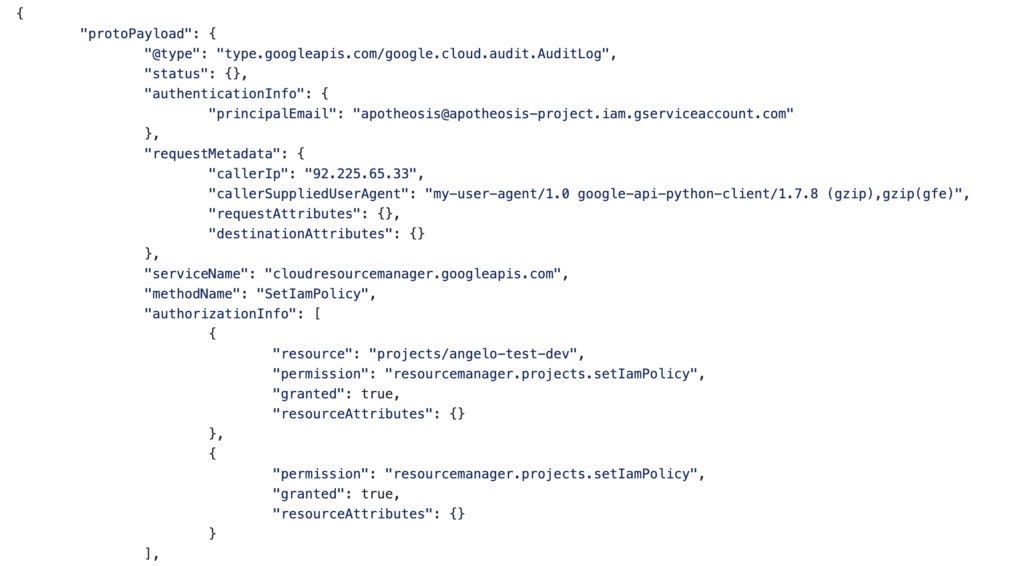
Here’s a partial example of a stackdriver log. As an API call to check IAM permissions would, it has all the information we need to trigger an alert. We see the user that granted the permission (in this case a service account). And below the fold we would see which role was assigned and which user it was assigned to.
Another point where we are alerting on misconfigurations is resource creation. We use Terraform for infrastructure as code. Before a Terraform apply is run, we have a series of unit tests that will be run by the pipeline. The unit tester runs tests for many of the same events which we alert on with the stackdriver logs. This includes the common example of a bucket being made public.
This is another process that is not so useful for a security consultant. But it’s better to catch misconfigurations in this way, than in the way Scout 2 or G-Scout would catch them, since this will prevent them from ever being implemented!
So we have what I’ll call a three-pronged approach to catching misconfigurations in GCP. These are the three prongs:
- Terraform unit testing that is meant to catch misconfigurations before they go into effect.
- Stackdriver alerting that occurs when the resource is created or changed (whether those changes are made through Terraform or not).
- And in case anything gets through the first two, we have the point in time audit of all GCP resources provided by G-Scout Enterprise.
In summary, G-Scout’s traditional purpose was proving minimally useful. It was difficult to make good use of the G-Scout reports. And as we’ve seen, the first two prongs will usually catch misconfigurations first. So I moved away from G-Scout, and toward a new creation: G-Scout Enterprise.
G-Scout Enterprise
The fundamental change is to replace the HTML report with a BigQuery data collection. In fact, at its core, G-Scout Enterprise is very simple. It’s mostly just something that takes API data and puts it into BigQuery. Then other systems can do with that data as they please. The rules that will trigger alerts can be written in our alerting system like any other alerts we have (though they can also easily be written in Python within G-Scout Enterprise). We are now putting all of our other data into BigQuery as well, so it’s all connected.
Users can query any of the tables, each of which corresponds to one GCP API endpoint. G-Scout Enterprise tables can be joined - and they can be joined to our other data sources as well. And we can be very specific: like looking for all roles where amellos@etsy.com is a member, without enshrining it in our ruleset, because we can run queries through the BigQuery console. Or we can run queries in the command line, with helper functions that allow us to query with Python rather than SQL.
We can make comparisons and track changes over time. It can also provide context to other alerts. For example, if we have an IP address from an SSH alert, we can get information about the instance which owns that IP address, such as what service account it has, or what Chef role it has.
Or for instance, the following, more complicated scenario:
We run Nessus. Nessus is an automated vulnerability scanner. It has a library of vulnerabilities it looks for by making network requests. You give it a list of IPs and it goes through them all. We now have it running daily. With a network of any size the volume of findings will quickly become overwhelming. Many of them are informational or safely ignored. But the rest need to be triaged, and addressed in a systematic way.
Not all Nessus findings are created equal. The same vulnerability on two different instances may be much more concerning on one than the other: if one is exposed to the internet and the other is not; if one is working with PII and the other is not; if one is in development and the other in production, and so on. Most of the information which determines how concerned we are with a vulnerability can be found among the collection of data contained in G-Scout Enterprise. This has simplified our scanning workflow. Since we can do network analysis with the data in G-Scout Enterprise, we can identify which instances are accessible from where. That means we don’t have to scan from different perspectives. And it has improved the precision of our vulnerability triaging, since there is so much contextual data available.
So we go through the following process:
- Enumerate all instances in our GCP account.
- Discard duplicate instances (instances from the same template, e.g. our many identical web server instances).
- Run the Nessus scan and place the results into BigQuery.
- Create a joined table of firewall rules and instances which they apply to (matching tags).
- Take various network ranges (0.0.0.0/0, our corporate range, etc.), and for each firewall rule see if it allows traffic from that source.
- For instances with firewall rules that allow ingress from 0.0.0.0/0, see if the instance has a NatIP or is behind an external load balancer.
- Check whether the project the instance lives in is one of the projects classified as sensitive.
- Compute and assign scores according to the previous steps
And then we save the results into BigQuery. That gives us historical data. We can see if we are getting better or worse. We can see if we have certain troublemaker projects. We can empower our patch management strategy with a wealth of data.
Conclusion
That leaves us with a few main lessons gained from adapting G-Scout to Etsy:
- It’s useful to store cloud environment info in a database. That makes it easier to work with, and easier to integrate with other data sources.
- The needs of a consultant are different from the needs of a security engineer. Although there is crossover, different tools may better fit the needs of one or the other.
- The three pronged alerting approach described above provides a comprehensive solution for catching security misconfigurations in the Cloud.
One last note is that we have plans to open source G-Scout Enterprise in the coming months.