Looking at something that moving made our eyes more focus in watching an object compare to look at something that static or idle. Therefore in a presentation, frequently a presenter shows an animation to make audience keep paying attention to the presented topic and also made the presentation more interesting.
Similarly for a map, a dynamic map with animation is more interesting and can help people to understand information which want to be presented in a map. For example seeing a car moving along a road, made user can observe exactly how it moves at different speed. Another example animation is road network change within several years, could give a better information how the road network is changed time to time. I am sure there are many more cases which are interesting to be visualized with map animation.
In another post, I had discussed about
how to create a hurricane path time lapse animation using Time Manager plugin as seen in figure 1. In this tutorial, I will show you how to create an animation map in QGIS 3.X using a plugin called
MMQGIS by Michael Minn, GIMP and also FFMPEG open source software. After finishing this tutorial you will know how to create location animation, lines animation, sequence animation and create zoom or pan map animation.
 |
| Figure 1. Hurricane path time lapse animation |
Installing MMQGIS Plugin
Let's start this tutorial by installing the plugin. To install a plugin in QGIS, in the menu toolbar click Plugins then select Manage and Install Plugins. The plugins installation window will appear as in figure 2. In the search option type mmqgis, the plugin will appear in the plugin list box. Check it and push Install Plugin button. (I already installed the plugin in, so the Install Plugin button is changed with Reinstall Plugin button). After finishing the installation, the plugin can be find in the top menu toolbar.
 |
| Figure 2. Installing mmqgis Plugin |
Create Line Animation
Now, let's create a map animation. Firstly we will make line animation to animate lava flow of a volcano as in figure 3. The lava flow was created manually by digitized the lines from the top of volcano. The direction of digitizing is very important in line animation, because the line will grow the same with digitizing direction. So if you have a vector line from other sources, could be the direction not in a way as you wish, so it need to be adjusted.
 |
| Figure 3. Lava flow animation |
The line animation as shown in figure 3 can be created with the following steps:
1. Add a basemap like a Bing Virtual Earth, Google Map, Open Street, etc. You can add a basemap using
Tile+ plugin.
2. Add the flow vector layer. The dataset for this tutorial can be downloaded
here. Change the line style as you want. Then zoom to the flow layer, so you will see the QGIS map canvas as in figure 4.
 |
| Figure 4. Basemap and line data |
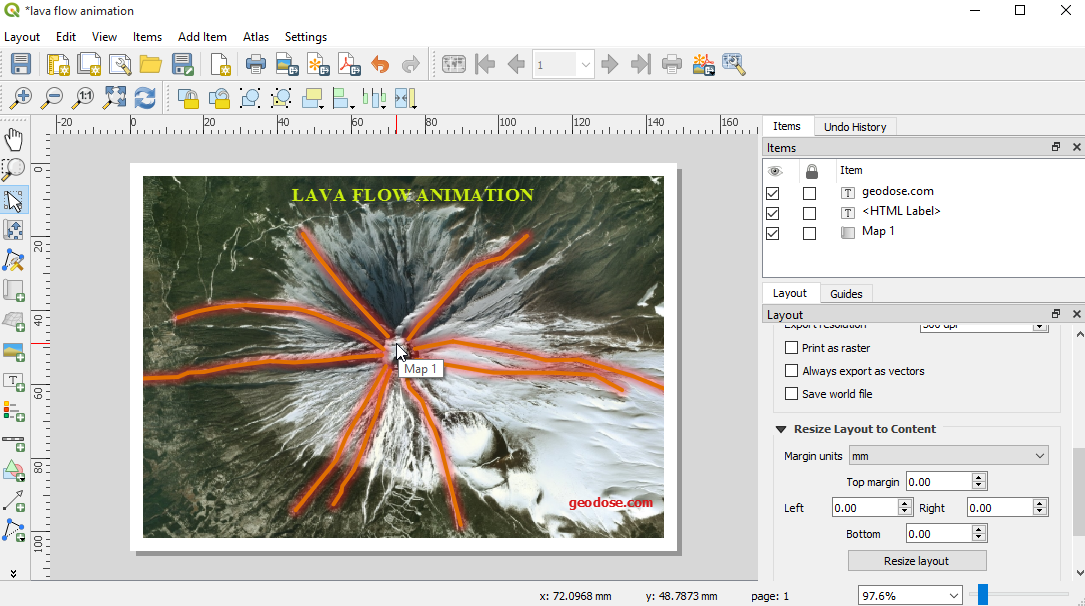
3. That's all the data we need to make the animation. Before creating the animation, we have to create a layout. To create a layout click Project then New Print Layout as in figure 5. Give a name for a layout, soon an empty layout will appear as in figure 6.
 |
| Figure 5. Create new print layout |
|
 |
| Figure 6. Empty layout |
4. Click
Adds a new Map to layout icon in the right toolbar panel. Draw a box on the empty layout. Now the data on the map canvas is added to the layout. Add text, image or anything else to the layout. For example I added the map title. Now the layout look like as in figure 7.
 |
| Figure 7 . Lava flow animation layout |
5. After finishing the layout part. Return to QGIS main window. Now we are ready to create the animation. From MMQGIS menu click Animate and then select Animate Lines as shown in figure 8. The window of animate line will appear as in figure 9. From the window select the name of the layout and the line layer. Under the Timing option you will find two options. The first one is Different Line Speeds Animated Over Full Duration and the second one is One Line Speed Determined by Longest Line. The difference between the two options are: The first one will finish an animation in the same time, so the speed of each line will be different. Vice versa, in the second option the speed of each line will be the same, it means the animation will finish till it reaches the end of a longest line.
Under the Timing, you will find the Frame Count option. It will determine the number of frame will be created. The default number is 20. With more number of frames the speed of animation can be set slower and the animation will run smoothly. On the other hand for a lower number of frames, we have to run animation fast or even faster to get a smooth transition.
 |
| Figure 8. Create line animation |
 |
| Figure 9. Animate Lines window |
6. After finishing the processing, a number of frames will be created as shown in figure 10. To get a continuous animation we have to combine the frames into a single animation layer such as in a GIF format.
 |
| Figure10. Frames for animation |
Combining Frames with GIMP
To combine all the frames into a single GIF file, can be done using
GIMP. GIMP is an open source graphic editor that can be used for free. Before combining all the frames, firstly I will resize all the images. It's not an obligatory step, but resizing the frames size will reduce the file size, so it will be more convenient to upload or viewed on a web page, just like I did for lava flow animation. To resize multiple images in GIMP, we can use
Batch Image Manipulation tool. It is a plugin for GIMP, so you need to install it fist. After the installation, it can be found from
File menu as in figure 11.
 |
| Figure 11. Batch Image Manipulation |
The batch image manipulation plugin window as in figure 12. In the window, click
Add button and select
Resize. Then the resize window will be opened as in figure 13. We can determine the new size dimension or scale both in percent or pixel.
 |
| Figure 12. Batch Image Manipulation Plugin Window |
 |
| Figure 13. Resize Window |
After determining the resize scale, then add all the frames as shown in figure 14. Don't forget to save it into a new folder, so it won't mix with the original frames.
 |
| Figure 14. All frames to be resized |
|
|
|
|
|
|
|
|
|
|
|
|
|
After finishing resizing. Open all the resize frames with
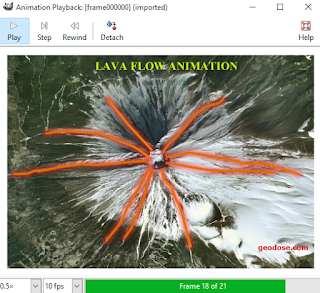
Open as Layers menu. See figure 15. All the frames will be added as layers. Now we are ready to see the animation. From
Filters menu select
Animation and then
Playback as seen in figure 16.
 |
| Figure 15. Open frames as layers |
 |
| Figure 16. Playback tool |
The animation playback window will be shown as in figure 17. Click the
Play button, the frame will be rendered in sequence according to filename order. Here you can set the number of frame per second (fps) and the speed.
 |
| Figure 17. Playback window |
Final step export to GIF file. From
File menu choose
Export As option, then give a name with GIF extension as in figure 18. After pushing
Export button, the Export image as GIF window will appear as shown in figure 19. In this part don't forget to check
As animation. To change the speed of animation, it can be done in
Delay between frames option. Lastly if you are satisfied with the setting, click the
Export button.
 |
| Figure 18. Export to GIF |
 |
| Figure 19. Export to GIF setting |
Combining Frames with FFMPEG
Another option to combine frames is using
FFMPEG. FFMPEG is a set of open source libraries to process and manipulate image, video and audio. Unlike GIMP, FFMPEG works in Command Line Interface (CLI), so a command/syntax must be typed in a console with its options to do a processing task.
The syntax below is the basic command to combine the image frames into a gif file.
ffmpeg -framerate 20 -i frame%06d.png output.gif
- -framerate: output framerate (fps)
- -i: input images
To resize the image can used visual filter (vf) option with scale attribute as follow:
ffmpeg -framerate 10 -i frame%06d.png -vf scale=iw*0.5:-1 output.gif
- -vf: visual filter option
- scale: scale image
- iw=input width (image original width)
The output from the command above produce a low resolution gif animation. For better quality, apply the complex filter (filter_complex). Complex filter is like visual filter with multiple inputs, outputs, options and operations. In the command below can be seen that the complex filter has framerate option, split operation, palette generator (palettegen) and floyd_steinberg palette filter.
ffmpeg -i frame%06d.png
-filter_complex "[0:v] fps=100,split [a][b];[a] palettegen=stats_mode=full [p];
[b][p] paletteuse=floyd_steinberg" output.gif
FFMPEG is quite powerful with a steep learning curve. But once you master it, you can create many video and image processing for free. Check out the
ffmpeg wiki to learn more. It's worth it!
Creating Location Animation
Location animation is an animation of object that moving from an origin location to a target location. This type of animation can be applied for points, lines or polygon geometry as long as it has origin and destination location. In this post, I made a location animation of airlines flight route as in figure 20.
 |
| Figure 20. Flight route animation |
To make a location animation can be done by Animate Location tool. Figure 21 shows the interface window of animate location tool. As previous step, select a print layout, then the important part in this section is to select the right source layer with source key field and also destination layer and destination key field. Those are two different layers. The source layer contains starting or origin location and destination layer stores location where the origin location will move. The source and destination layer are tied with the key field. So basically it is one to one relationship, which means a key will move to same key in the destination layer.
 |
| Figure 21. Animate location window |
Creating Sequence Animation
Sequence animation is transition of features in sequence order, such as a GPS tracking data. To create a sequence map animation the Animate Sequence tool is used. The interface window of the tool can be seen in figure 22. From the interface we have to select a layer or some layers to be animated and there is an optional Cumulative option. Checking this option will show all previous features, so at the end of animation all sequence features are displayed on the map. On the other hand unchecked it will only display the current feature in sequence.
 |
| Figure 22. Sequence animation window |
In figure 23 can be seen the result of sequence animation from a GPS tracking data. Figure 23(a) is GPS track animation without cumulative option enabled and figure 23(b) is sequence animation using cumulative option
 |
| Figure 23 (a). Sequence animation without cumulative option enabled |
|
 |
| Figure 23 (b). Sequence animation with cumulative option enabled |
|
Zoom/Pan Animation Map
The last part of this tutorial we will discuss how to create a zoom/pan map animation. This type of animation is very useful to visualize the change of map scale in order to focus on an specific area. Might be you have ever seen this kind of animation in a movie scene where viewing the earth from space and then closer and closer enough to an area like figure 24.
 |
| Figure 24. Zoom in animation |
A zoom or pan map animation can be created using Animate Zoom tool. The important options of this animation tool are starting map center, which defined by Start Latitude and Start Longitude. End location defined by End latitude and End Longitude. Start zoom level and End zoom level. Figure 25 shows the animate zoom window for pan animation. In the window can be seen that the start and end coordinates are different with the same zoom level 10. The result of this setting can be seen in figure 26. To create a zoom in animation, the start and end coordinates are the same with different start and end zoom level.
 |
| Figure 25. Animate zoom window |
 |
| Figure 26. Pan map animation |
That's all the tutorial how to create an animation map in QGIS and GIMP open source software. Through this tutorial we had created some map animations such as line animation, location animation, sequence and zoom/pan map animation. I hope this tutorial is useful for you and please free to share it to anyone if you think it will give benefit to others.
Animation
QGIS
Tutorial