
Written by Peter Ekene Eze✏️
Debugging is one of the most useful skills a developer can possess. It allows you to properly navigate and spot errors in your code quickly and efficiently. In the modern web, this is made possible by leveraging various tools and techniques.
React is one of the fastest-growing front-end frameworks. It makes creating complex and interactive UIs painless. Like other frameworks, it has a debugging toolset called React development tools.
React development tools (React DevTools) is a browser extension available for Chrome, Firefox, and as a standalone app that allows you to inspect the React component hierarchy in the Chrome developer tools. It provides an extra set of React-specific inspection widgets to assist you with development. Since its inception, there have been many releases from the core team. In this tutorial, I’ll highlight the notable additions to the latest React DevTools release, Version 4 and demonstrate a few ways you can leverage its features to better debug your React apps with it.

Installing the new React DevTools
React DevTools is available as an extension for Chrome and Firefox. If you have already installed the extension, it should update automatically. If you use the standalone shell (e.g. in React Native or Safari), you can install the new version from NPM:
npm install -g react-devtools@^4
Setting up our test application
I created a starter project for easy setup and to reduce overhead, ensuring the article focuses on debugging. The skeleton of the application has already been set up, it includes a few components, styling and project structure. Run the following command to clone the repository if you want to experiment with me:
git clone https://github.com/Kennypee/react-contacts
Open the folder and install the project’s dependencies by running the following command:
cd react-contacts && npm install
To start the React app server, run the npm start command in the root folder of your project. Open your browser to localhost:3000 and you will see the project live!
Performance improvements
The DevTools new version offers significant performance gains and improved navigation experience. Certain aspects have been modified to make it usable for larger applications.
Component filters
In previous versions of DevTools, navigating through large component trees has been a little bit tedious. In the new version, DevTools now provides a way to filter components so that you can hide ones you’re not interested in.
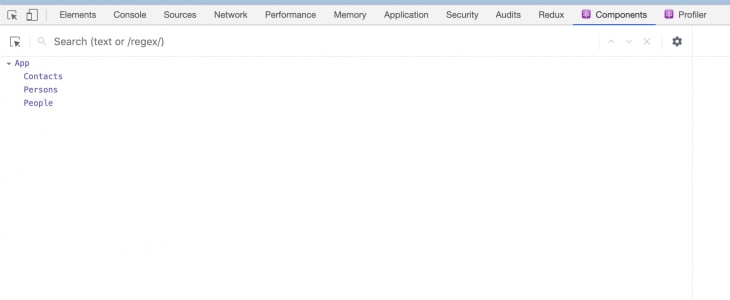
To access this feature, let’s filter through the three components in our sample application. Open your DevTools and you will see our three components listed.
To filter out a component and focus on the one we are interested in, click on the setting icon below the components tab. You’ll be presented with a popup. Click on the components tab and choose your preferred sorting option.
After we filter out components, they become hidden by default but will become visible after disabling the filter. This feature will come in handy when you work on a project with many components and fast sorting becomes a real need. What’s even more interesting about this feature is that filter preferences are remembered between sessions.
Inline props are now a thing of the past
To make larger component trees easier to browse and to make DevTools faster, components in the tree no longer show inline props.
To see this feature in action, all you need to do is select a component and all the components’ props, state, and Hooks will be displayed on the right-hand side of the console.
In our sample application, we only pass props to our contacts component. Clicking on it will reveal the value of the props passed to it and clicking on the other components will reveal that no props were passed to them.

Although this feature may not be so useful for smaller React projects, it will come in handy when working with large React projects.
Easily debug unexpected prop values & component elements
Consider the following React class:
import ABC from 'abc';
import XYZ from 'xyz';

class Main extends Component {
  constructor(props) {
    super(props);

    this.state = { name : "John" }
 }
 render() {
    const { name } = this.state;
      return (
        <ABC>
          <XYZ name={name} />
        </ABC>
      )
  }
}
ABC is the parent of XYZ but Main is the owner of the component and only owners can send down props.
In the new React Dev tools, you can quickly debug an unexpected prop value by skipping over the parents. DevTools v4 adds a new rendered by list in the right-hand pane that allows you to quickly step through the list of owners to speed up your debugging process.
By clicking on any of the components in our application, we can see the components that rendered them. This is very useful when trying to trace back the origin of a particular prop.
It also comes with an inverse function called owners tree. It is the list of things rendered by a particular component — the things it “owns”. This view is kind of like looking at the source of the component’s render method and can be a helpful way to explore large, unfamiliar React applications.
To use this feature to debug our application, double click a component to view the owners’ tree and click the “x” button to return to the full component tree. You can also move around in the tree to see all the children of the component.

Visual improvements
Indented component view
In the previous versions, deeply nested components require both vertical and horizontal scrolling to see, which makes tracking large component trees difficult. DevTools now dynamically adjust nesting indentation to eliminate horizontal scrolling.
To use this feature in our app, click on the components tab, then click on any component and all its children will automatically appear below it with an automatic indentation from the next component.
Improved searching
In previous versions, when searching in DevTools the result is often a filtered components tree showing matching nodes as roots i.e other components are hidden and the search match now display as root elements. This made the overall structure of the application harder to reason about because it displayed ancestors as siblings.
Now, you can easily search through your components with results shown inline similar to the browser’s find-in-page search.

Functional improvements
Improved Hooks support
Hook-based React projects can now be debugged faster and better because Hooks in version 4 now have the same level of support as props and state. Values can be edited, arrays and objects can be drilled into, etc.
Restoring selection between reloads
While debugging, if you hit reload, DevTools now attempts to restore the last selected element.
Let’s assume we were sorting through the Persons component in our sample application before a page refresh occurs, DevTools will resume with the Persons component automatically selected.
Suspense toggle
React’s Suspense API lets components “wait” or do “something” before rendering. <Suspense> components can be used to specify loading states when components deeper in the tree are waiting to render.
DevTools lets you test these loading states with a new toggle:
Profiler changes
Reload and profile
The profiler is a powerful tool for performance tuning React components. Legacy DevTools supported profiling but only after it detected a profiling-capable version of React. Because of this, there was no way to profile the initial mount (one of the most performance-sensitive parts) of an application.
This feature is now supported with a “reload and profile” action:
Component renders list
The profiler now displays a list of each time the selected component rendered during a profiling session, along with the duration of each render. This list can be used to quickly jump between commits when analyzing the performance of specific components.
For our sample application, we can see that some components render twice during the section, we now have a direction towards debugging that may potentially improve performance.
Support
Only the following versions of React are supported:
react-dom
0-14.x: Not supported
15.x: Supported (except for the new component filters feature)
16.x: Supported
react-native
0-0.61: Not supported
0.62: Will be supported (when 0.62 is released)
So if certain features don’t work on a particular project, be sure to check the version of React you are using.
Conclusion
In this tutorial, we have talked about debugging React applications with the new DevTools. We looked at some additions and improvements that came with it. We also looked at how they make debugging your code easier. If you have any questions, comments, or additions be sure to drop a comment. Happy coding!
Editor's note: Seeing something wrong with this post? You can find the correct version here.
Plug: LogRocket, a DVR for web apps

LogRocket is a frontend logging tool that lets you replay problems as if they happened in your own browser. Instead of guessing why errors happen, or asking users for screenshots and log dumps, LogRocket lets you replay the session to quickly understand what went wrong. It works perfectly with any app, regardless of framework, and has plugins to log additional context from Redux, Vuex, and @ngrx/store.
In addition to logging Redux actions and state, LogRocket records console logs, JavaScript errors, stacktraces, network requests/responses with headers + bodies, browser metadata, and custom logs. It also instruments the DOM to record the HTML and CSS on the page, recreating pixel-perfect videos of even the most complex single-page apps.
Try it for free.
The post Debug React applications with the new React DevTools appeared first on LogRocket Blog.


Top comments (0)