How We Analyze and Visualize Kubernetes Events in Real Time at Rockset
October 1, 2019
Kubernetes at Rockset
At Rockset, we use Kubernetes (k8s) for cluster orchestration. It runs all our production microservices — from our ingest workers to our query-serving tier. In addition to hosting all the production infrastructure, each engineer has their own Kubernetes namespace and dedicated resources that we use to locally deploy and test new versions of code and configuration. This sandboxed environment for development allows us to make software releases confidently multiple times every week. In this blog post, we will explore a tool we built internally that gives us visibility into Kubernetes events, an excellent source of information about the state of the system, which we find useful in troubleshooting the system and understanding its long-term health.
Why We Care About Kubernetes Events
Kubernetes emits events whenever some change occurs in any of the resources that it is managing. These events often contain important metadata about the entity that triggered it, the type of event (Normal, Warning, Error, etc.) and the cause. This data is typically stored in etcd and made available when you run certain kubectl commands.
$ kubectl describe pods jobworker-c5dc75db8-7m5ln
...
...
...
Events:
  Type     Reason     Age                From                                                    Message
  ----     ------     ----               ----                                                    -------
  Normal   Scheduled  7m                 default-scheduler                                       Successfully assigned master/jobworker-c5dc75db8-7m5ln to ip-10-202-41-139.us-west-2.compute.internal
  Normal   Pulling    6m                 kubelet, ip-XXX-XXX-XXX-XXX.us-west-2.compute.internal  pulling image "..."
  Normal   Pulled     6m                 kubelet, ip-XXX-XXX-XXX-XXX.us-west-2.compute.internal  Successfully pulled image "..."
  Normal   Created    6m                 kubelet, ip-XXX-XXX-XXX-XXX.us-west-2.compute.internal  Created container
  Normal   Started    6m                 kubelet, ip-XXX-XXX-XXX-XXX.us-west-2.compute.internal  Started container
  Warning  Unhealthy  2m (x2 over 2m)    kubelet, ip-XXX-XXX-XXX-XXX.us-west-2.compute.internal  Readiness probe failed: Get http://XXX.XXX.XXX.XXX:YYY/healthz: dial tcp connect: connection refused
These events help understand what happened behind the scenes when a particular entity entered a specific state. Another place to see an aggregated list of all events is by accessing all events via kubectl get events.
$ kubectl get events
LAST SEEN   TYPE      REASON                 KIND                      MESSAGE
5m          Normal    Scheduled              Pod                       Successfully assigned master/jobworker-c5dc75db8-7m5ln to ip-XXX-XXX-XXX-XXX.us-west-2.compute.internal
5m          Normal    Pulling                Pod                       pulling image "..."
4m          Normal    Pulled                 Pod                       Successfully pulled image "..."
...
...
...
As can be seen above, this gives us details - the entity that emitted the event, the type/severity of the event, as well as what triggered it. This information is very useful when looking to understand changes that are occurring in the system. One additional use of these events is to understand long-term system performance and reliability. For example, certain node and networking errors that cause pods to restart may not cause service disruptions in a highly available setup but often can be hiding underlying conditions that place the system at increased risk.
In a default Kubernetes setup, the events are persisted into etcd, a key-value store. etcd is optimized for quick strongly consistent lookups, but falls short on its ability to provide analytical abilities over the data. As size grows, etcd also has trouble keeping up and therefore, events get compacted and cleaned up periodically. By default, only the past hour of events is preserved by etcd.
The historical context can be used to understand long-term cluster health, incidents that occurred in the past and the actions taken to mitigate them within Kubernetes, and build accurate post mortems. Though we looked at other monitoring tools for events, we realized that we had an opportunity to use our own product to analyze these events in a way that no other monitoring product could, and use it to construct a visualization of the states of all of our Kubernetes resources.
Overview
To ingest the Kubernetes events, we use an open source tool by Heptio called eventrouter. It reads events from the Kubernetes API server and forwards them to a specified sink. The sink can be anything from Amazon S3 to an arbitrary HTTP endpoint. In order to connect to a Rockset collection, we decided to build a Rockset connector for eventrouter to control the format of the data uploaded to our collection. We contributed this Rockset sink into the upstream eventrouter project. This connector is really simple — it takes all received events and emits them into Rockset. The really cool part is that for ingesting these events, which are JSON payloads that vary across different types of entities, we do not need to build any schema or do structural transformations. We can emit the JSON event as-is into a Rockset collection and query it as though it were a full SQL table. Rockset automatically converts JSON events into SQL tables by first indexing all the json fields using Converged Indexing and then automatically schematizing them via Smart Schemas.
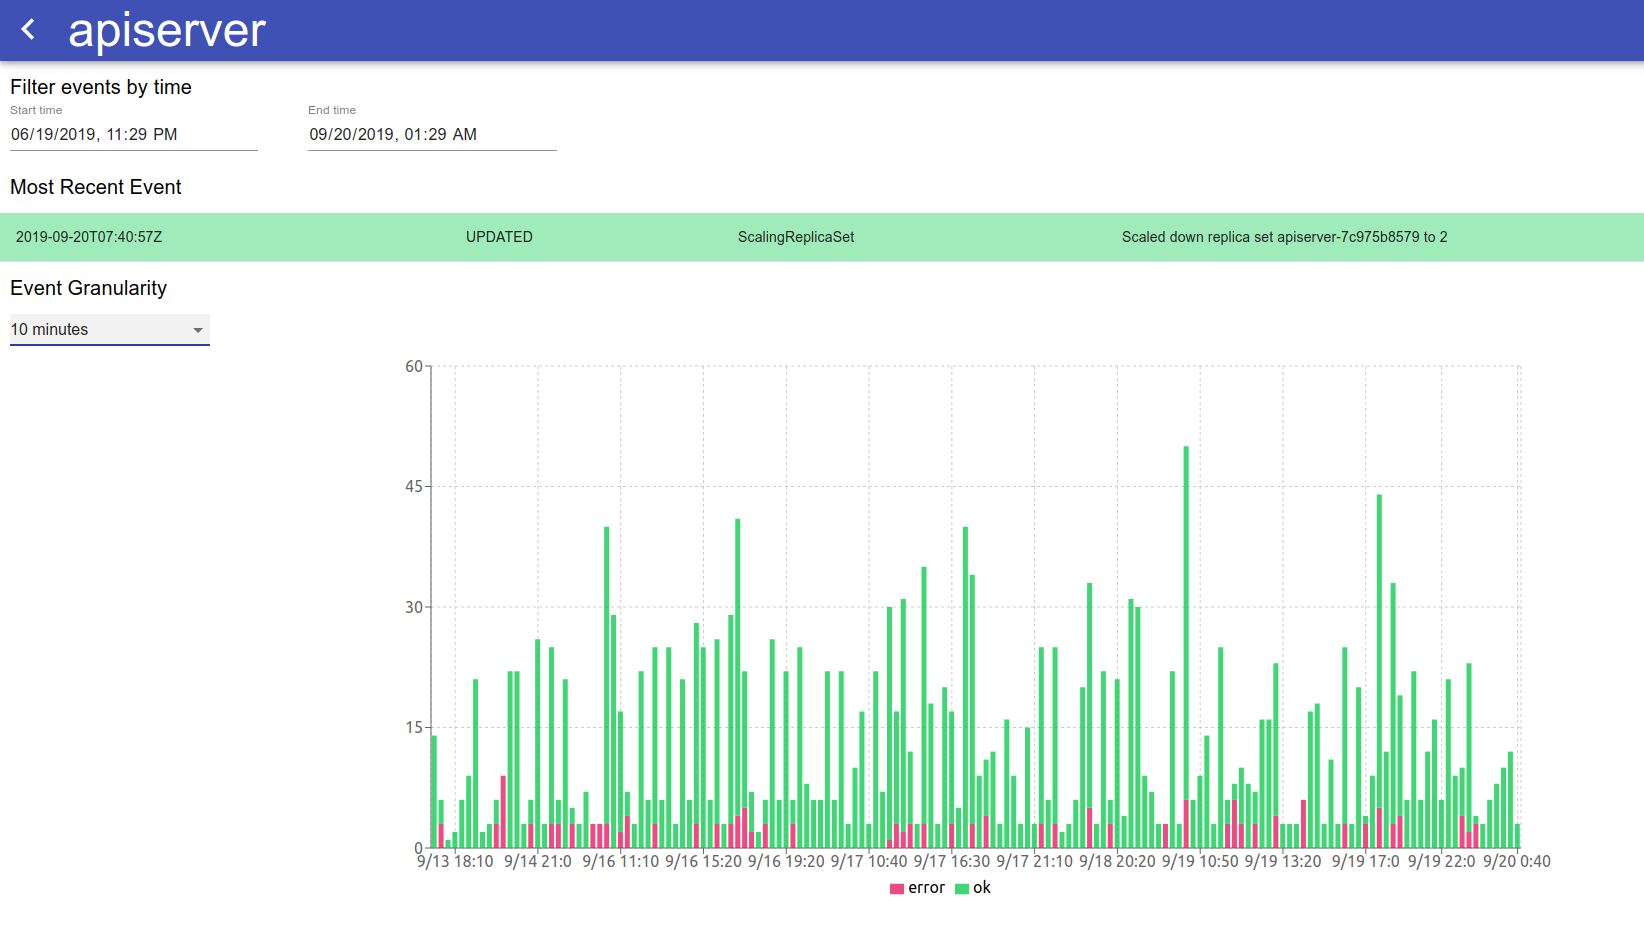
The front-end application is a thin layer over the SQL layer that allows filtering events by namespace and entity type (Pod, Deployment, etc.), and then within those entity types, cluster events by normal/errors. The goal is to have a histogram of these events to visually inspect and understand the state of the cluster over an extended period of time. Of course, what we demonstrate is simply a subset of what could be built - one can imagine much more complex analyses - like analyzing network stability, deployment processes, canarying software releases and even using the event store as a key diagnostic tool to discover correlations between cluster-level alerts and Kubernetes-level changes.
Setup
Before we can begin receiving events from eventrouter into Rockset, we must create a collection in Rockset. This is the collection that all eventrouter events are stored in. You can do this with a free account from https://console.rockset.com/create.
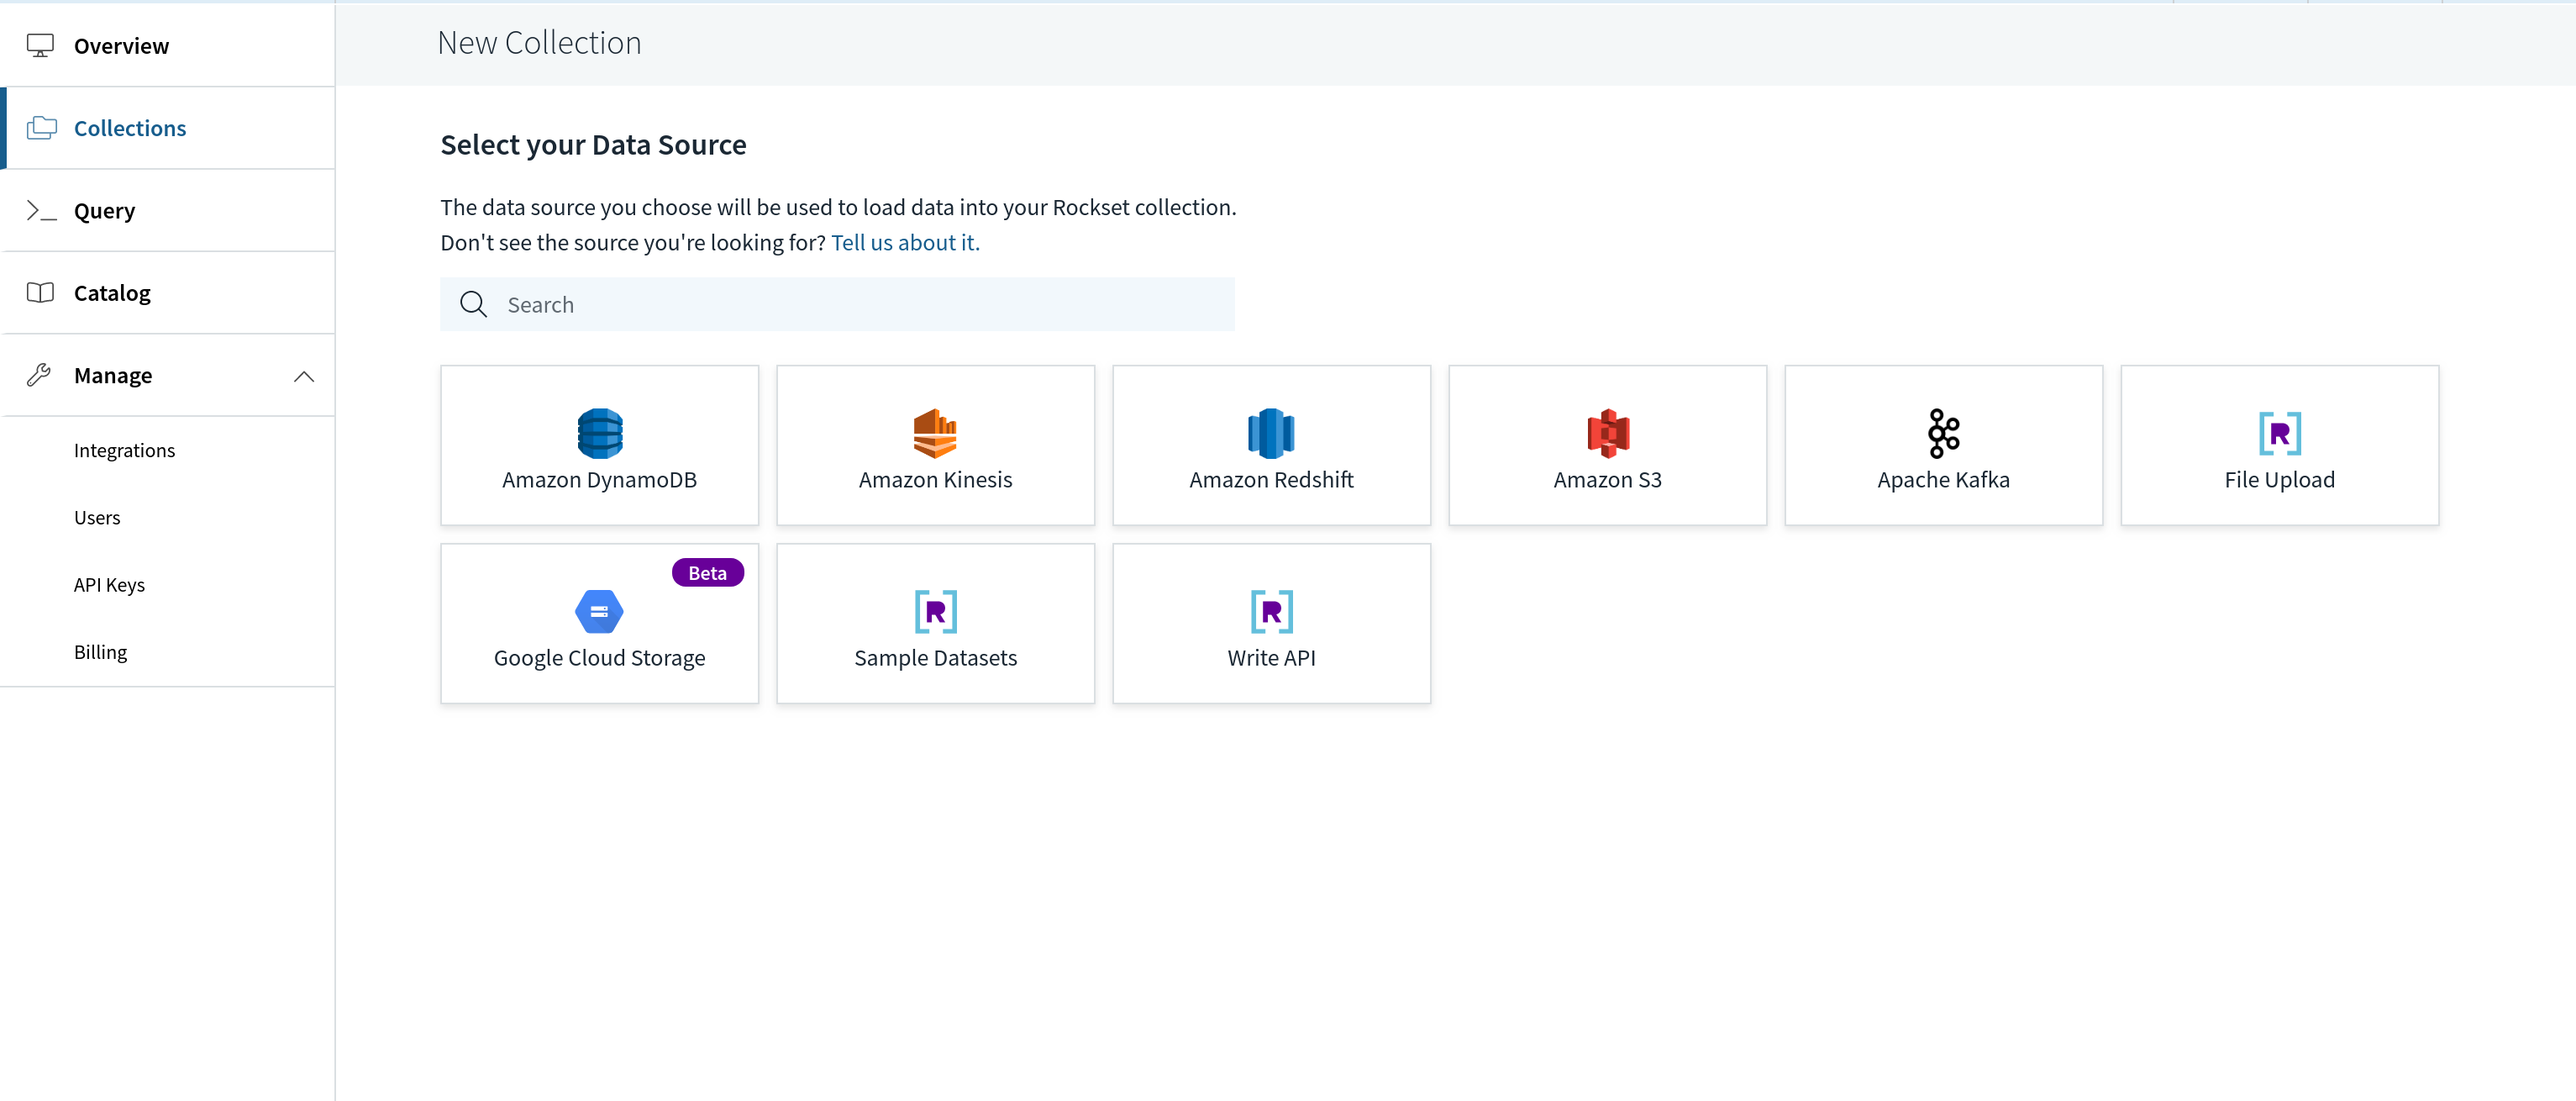
A collection in Rockset can ingest data from a specified source, or can be sent events via the REST API. We’ll use the latter, so, we create a collection that is backed by this Write API. In the Rockset console, we can create such a collection by picking “Write API” as the data source.
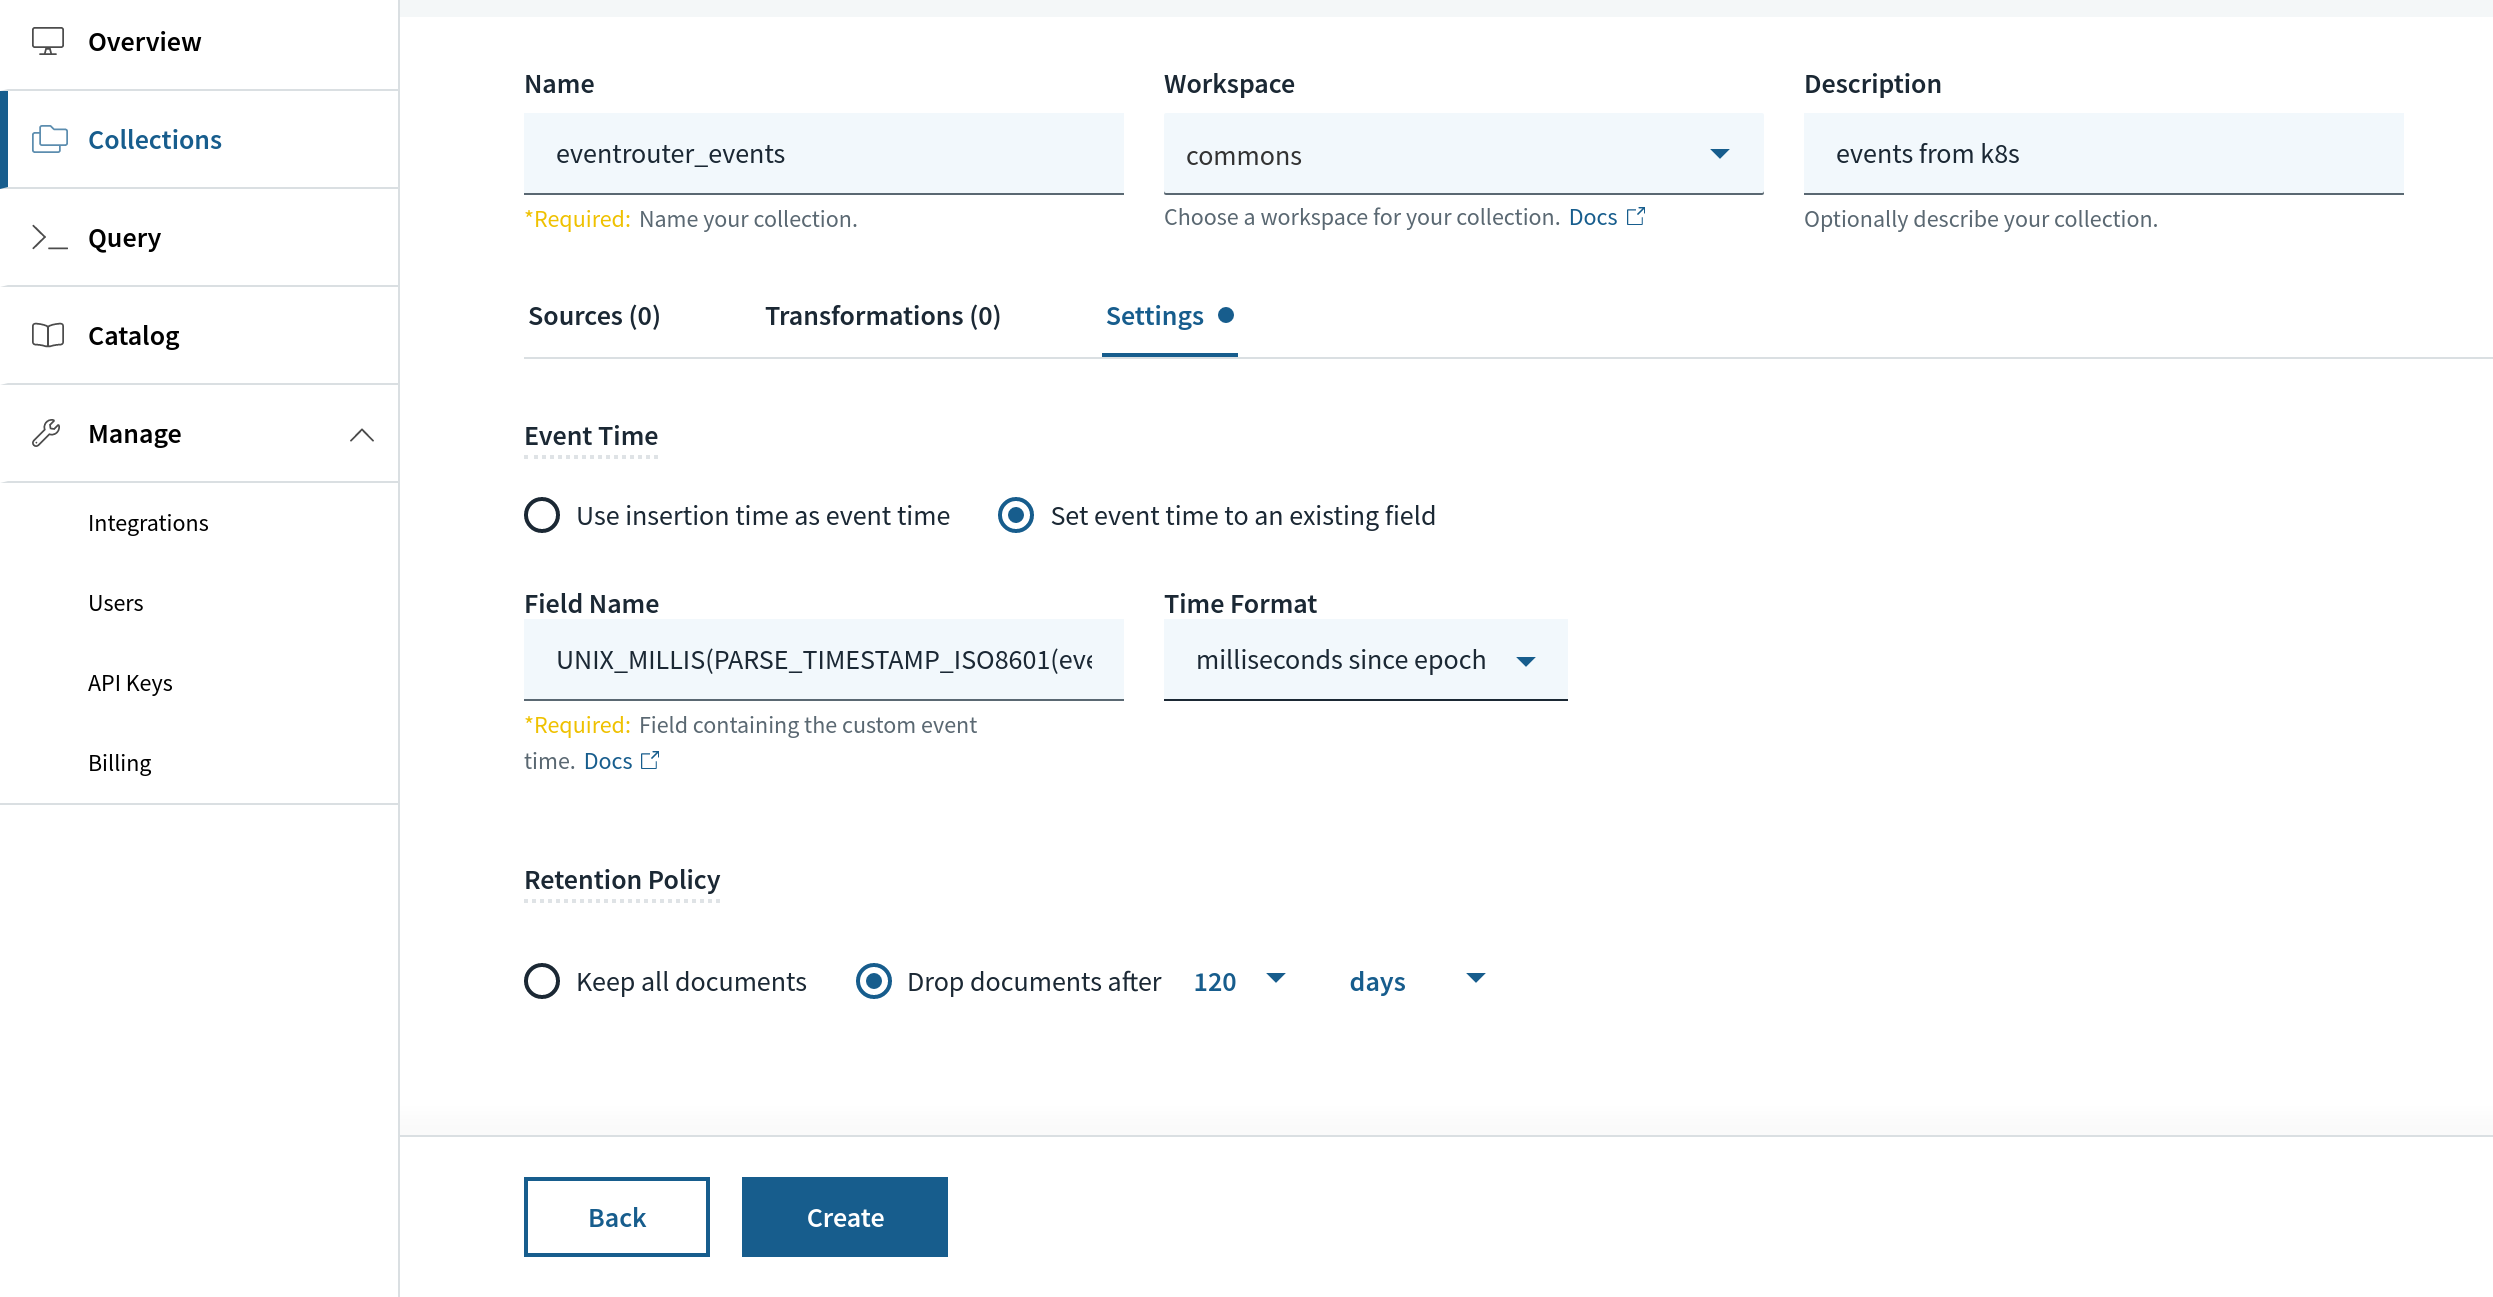
When creating the collection, we can pick a retention, say, 120 days or any reasonable amount of time to give us some sense of cluster health. This retention is applied based on a special field in Rockset, _event_time. We will map this field to a specific field within the JSON event payload we will receive from eventrouter called event.lastTimestamp. The transformation function looks like the following:
UNIX_MILLIS(PARSE_TIMESTAMP_ISO8601(event.lastTimestamp))
After creating the collection, we can now set up and use eventrouter to begin receiving Kubernetes events.
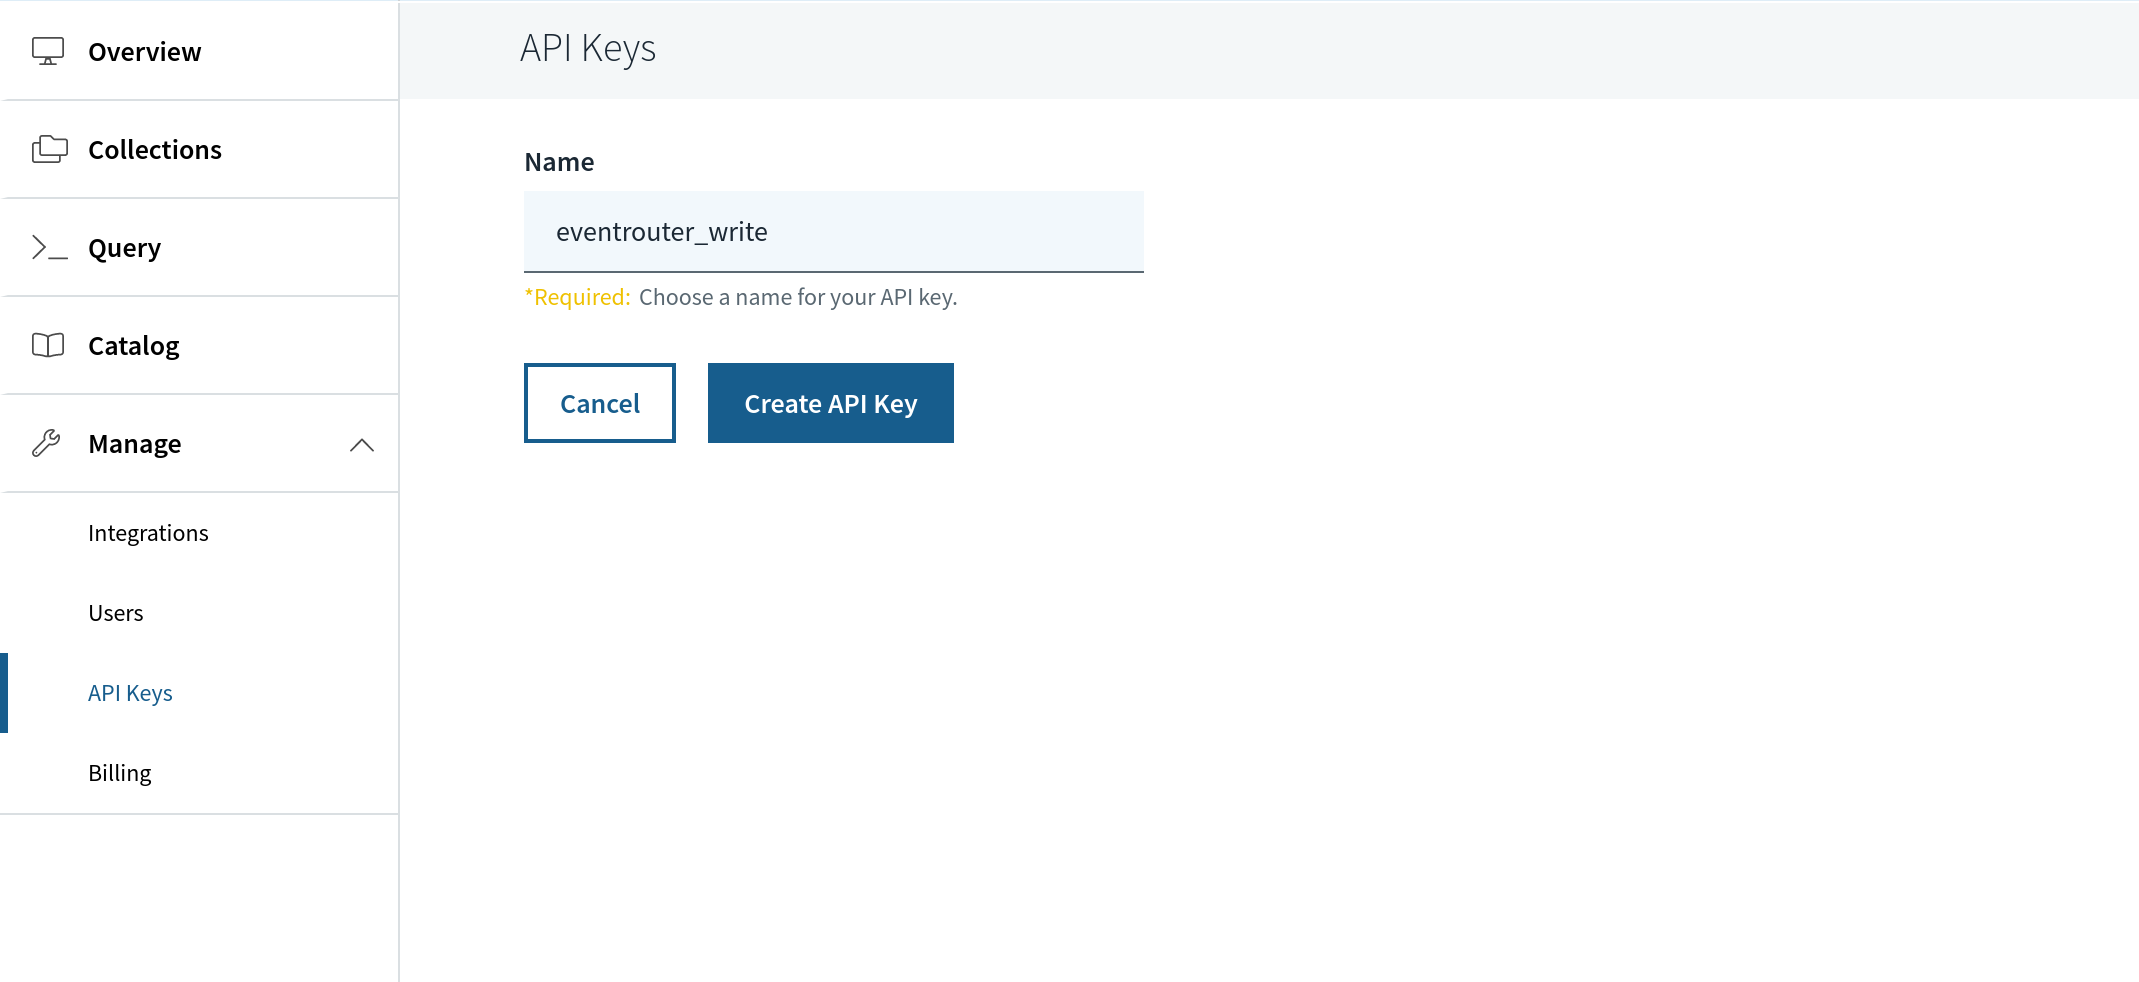
Now, receiving events from eventrouter requires one more thing - a Rockset API key. We can use API keys in Rockset to write JSON to a collection, and to make queries. In this case, we create an API key called eventrouter_write from Manage > API keys.
Copy the API key as we will require it in our next step setting up eventrouter to send events into the Rockset collection we just set up. You can set up eventrouter by cloning the eventrouter repository and edit the YAML file yaml/deployment.yaml to look like the following:
# eventrouter/yaml/deployment.yaml
config.json: |-
{
"sink": "rockset"
"rocksetServer": "https://api.rs2.usw2.rockset.com",
"rocksetAPIKey": "<API_KEY>",
"rocksetCollectionName": "eventrouter_events",
"rocksetWorkspaceName": "commons",
}
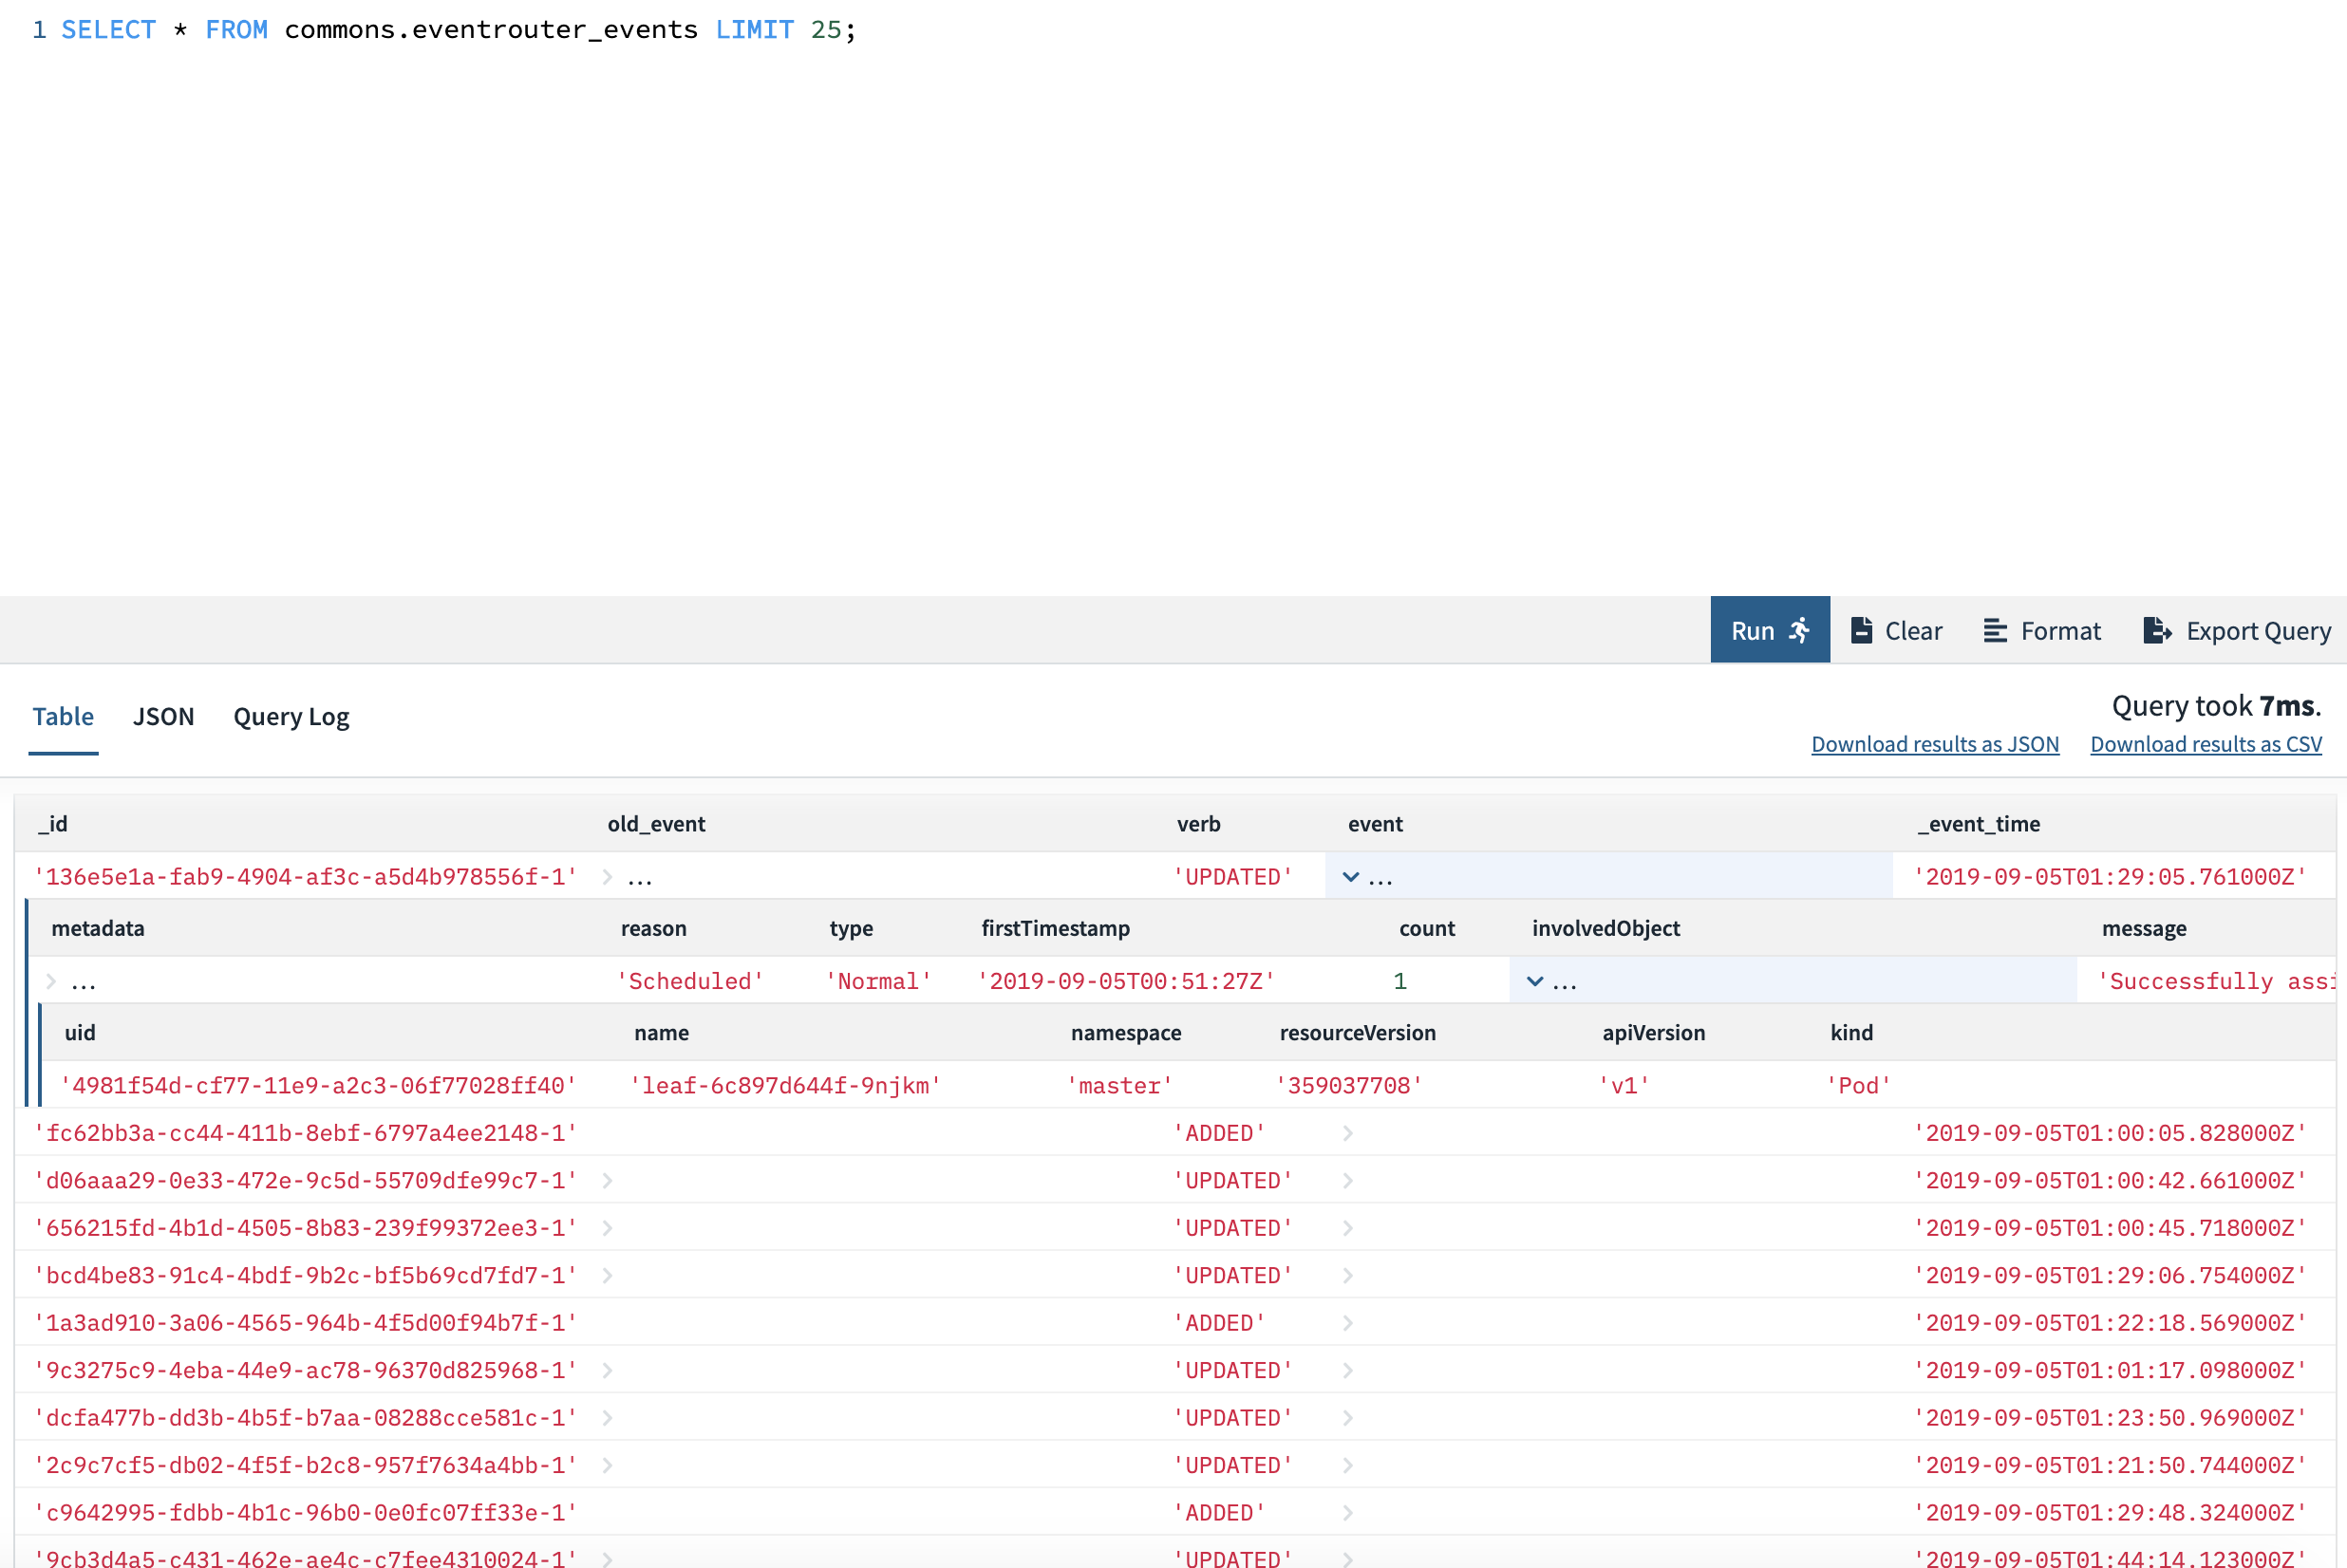
You can substitute the <API_KEY> with the Rockset API key we just created in the previous step. Now, we’re ready! Run kubectl apply -f yaml/deployment.yaml, and eventrouter can start watching and forwarding events right away. Looking at the collection within Rockset, you should start seeing events flowing in and being made available as a SQL table. We can query it as shown below from the Rockset console and get a sense of some of the events flowing in. We can run full SQL over it - including all types of filters, joins, etc.
Querying Data
We can now start asking some interesting questions from our cluster and get an understanding of cluster health. One question that we wanted to ask was - how often are we deploying new images into production. We operated on a strict release schedule, but there are times when we rollout and rollback images.
With replicasets as (
        select
            e.event.reason as reason,
            e.event.lastTimestamp as ts,
            e.event.metadata.name as name,
              REGEXP_EXTRACT(e.event.message, 'Created pod: (.*)', 1) as pod
        from
            commons.eventrouter_events e
        where
            e.event.involvedObject.kind = 'ReplicaSet'
            and e.event.metadata.namespace = 'production'
              and e.event.reason = 'SuccessfulCreate'
    ),
    pods as (
        select
            e.event.reason as reason,
            e.event.message as message,
            e.event.lastTimestamp as ts,
            e.event.involvedObject.name as name,
            REGEXP_EXTRACT(
                e.event.message,
                'pulling image "imagerepo/folder/(.*?)"',
                1
            ) as image
        from
            commons.eventrouter_events e
        where
            e.event.involvedObject.kind = 'Pod'
            and e.event.metadata.namespace = 'production'
            and e.event.message like '%pulling image%'
              and e.event.involvedObject.name like 'aggregator%'
    )

SELECT * from (
select
    MAX(p.ts) as ts, MAX(r.pod) as pod, MAX(p.image) as image, r.name
from
    pods p
    JOIN replicasets r on p.name = r.pod
GROUP BY r.name) sq
ORDER BY ts DESC
limit 100;
The above query deals with our deployments, which in turn create replicasets and finds the last date on which we deployed a particular image.
+------------------------------------------+----------------------------------------+-----------------------------+----------------+
| image                              | name                                   | pod                         | ts                   |
|------------------------------------------+----------------------------------------+-----------------------------+----------------|
| leafagg:0.6.14.20190928-58cdee6dd4 | aggregator-c478b597.15c8811219b0c944   | aggregator-c478b597-z8fln   | 2019-09-28T04:53:05Z |
| leafagg:0.6.14.20190928-58cdee6dd4 | aggregator-c478b597.15c881077898d3e0   | aggregator-c478b597-wvbdb   | 2019-09-28T04:52:20Z |
| leafagg:0.6.14.20190928-58cdee6dd4 | aggregator-c478b597.15c880742e034671   | aggregator-c478b597-j7jjt   | 2019-09-28T04:41:47Z |
| leafagg:0.6.14.20190926-a553e0af68 | aggregator-587f77c45c.15c8162d63e918ec | aggregator-587f77c45c-qjkm7 | 2019-09-26T20:14:15Z |
| leafagg:0.6.14.20190926-a553e0af68 | aggregator-587f77c45c.15c8160fefed6631 | aggregator-587f77c45c-9c47j | 2019-09-26T20:12:08Z |
| leafagg:0.6.14.20190926-a553e0af68 | aggregator-587f77c45c.15c815f341a24725 | aggregator-587f77c45c-2pg6l | 2019-09-26T20:10:05Z |
| leafagg:0.6.14.20190924-b2e6a85445 | aggregator-58d76b8459.15c77b4c1c32c387 | aggregator-58d76b8459-4gkml | 2019-09-24T20:56:02Z |
| leafagg:0.6.14.20190924-b2e6a85445 | aggregator-58d76b8459.15c77b2ee78d6d43 | aggregator-58d76b8459-jb257 | 2019-09-24T20:53:57Z |
| leafagg:0.6.14.20190924-b2e6a85445 | aggregator-58d76b8459.15c77b131e353ed6 | aggregator-58d76b8459-rgcln | 2019-09-24T20:51:58Z |
+------------------------------------------+----------------------------------------+-----------------------------+----------------+
This excerpt of images and pods, with timestamp, tells us a lot about the last few deploys and when they occurred. Plotting this on a chart would tell us about how consistent we have been with our deploys and how healthy our deployment practices are.
Now, moving on to performance of the cluster itself, running our own hand-rolled Kubernetes cluster means we get a lot of control over upgrades and the system setup but it is worth seeing when nodes may have been lost/network partitioned causing them to be marked as unready. The clustering of such events can tell us a lot about the stability of the infrastructure.
With nodes as (
    select
          e.event.reason,
          e.event.message,
          e.event.lastTimestamp as ts,
          e.event.metadata.name
    from
        commons.eventrouter_events e
    where
        e.event.involvedObject.kind = 'Node'
          AND e.event.type = 'Normal'
          AND e.event.reason = 'NodeNotReady'
    ORDER by ts DESC
)
select
    *
from
    nodes
Limit 100;
This query gives us the times the node status went NotReady and we can try and cluster this data using SQL time functions to understand how often issues are occurring over specific buckets of time.
+------------------------------------------------------------------------------+--------------------------------------------------------------+--------------+----------------------+
| message                                                                      | name                                                         | reason       | ts                   |
|------------------------------------------------------------------------------+--------------------------------------------------------------+--------------+----------------------|
| Node ip-xx-xxx-xx-xxx.us-xxxxxx.compute.internal status is now: NodeNotReady | ip-xx-xxx-xx-xxx.us-xxxxxx.compute.internal.yyyyyyyyyyyyyyyy | NodeNotReady | 2019-09-30T02:13:19Z |
| Node ip-xx-xxx-xx-xxx.us-xxxxxx.compute.internal status is now: NodeNotReady | ip-xx-xxx-xx-xxx.us-xxxxxx.compute.internal.yyyyyyyyyyyyyyyy | NodeNotReady | 2019-09-30T02:13:19Z |
| Node ip-xx-xxx-xx-xxx.us-xxxxxx.compute.internal status is now: NodeNotReady | ip-xx-xxx-xx-xxx.us-xxxxxx.compute.internal.yyyyyyyyyyyyyyyy | NodeNotReady | 2019-09-30T02:14:20Z |
| Node ip-xx-xxx-xx-xxx.us-xxxxxx.compute.internal status is now: NodeNotReady | ip-xx-xxx-xx-xxx.us-xxxxxx.compute.internal.yyyyyyyyyyyyyyyy | NodeNotReady | 2019-09-30T02:13:19Z |
| Node ip-xx-xxx-xx-xx.us-xxxxxx.compute.internal status is now: NodeNotReady  | ip-xx-xxx-xx-xx.us-xxxxxx.compute.internal.yyyyyyyyyyyyyyyy  | NodeNotReady | 2019-09-30T00:10:11Z |
+------------------------------------------------------------------------------+--------------------------------------------------------------+--------------+----------------------+
We can additionally look for pod and container level events like when they get OOMKilled and correlate that with other events happening in the system. Compared to a time series database like prometheus, the power of SQL lets us write and JOIN different types of events to try and piece together different things that occurred around a particular time interval, which may be causal.
For visualizing events, we built a simple tool that uses React that we use internally to look through and do some basic clustering of Kubernetes events and errors occurring in them. We’re releasing this dashboard into open source and would love to see what the community might use this for. There are two main aspects to the visualization of Kubernetes events. First is a high-level overview of the cluster at a per-resource granularity. This allows us to see a realtime event stream from our deployments and pods, and to see at what state every single resource in our Kubernetes system is. There is also an option to filter by namespace - because certain sets of services run in their own namespace, this allows us to drill down into a specific namespace to look at events.
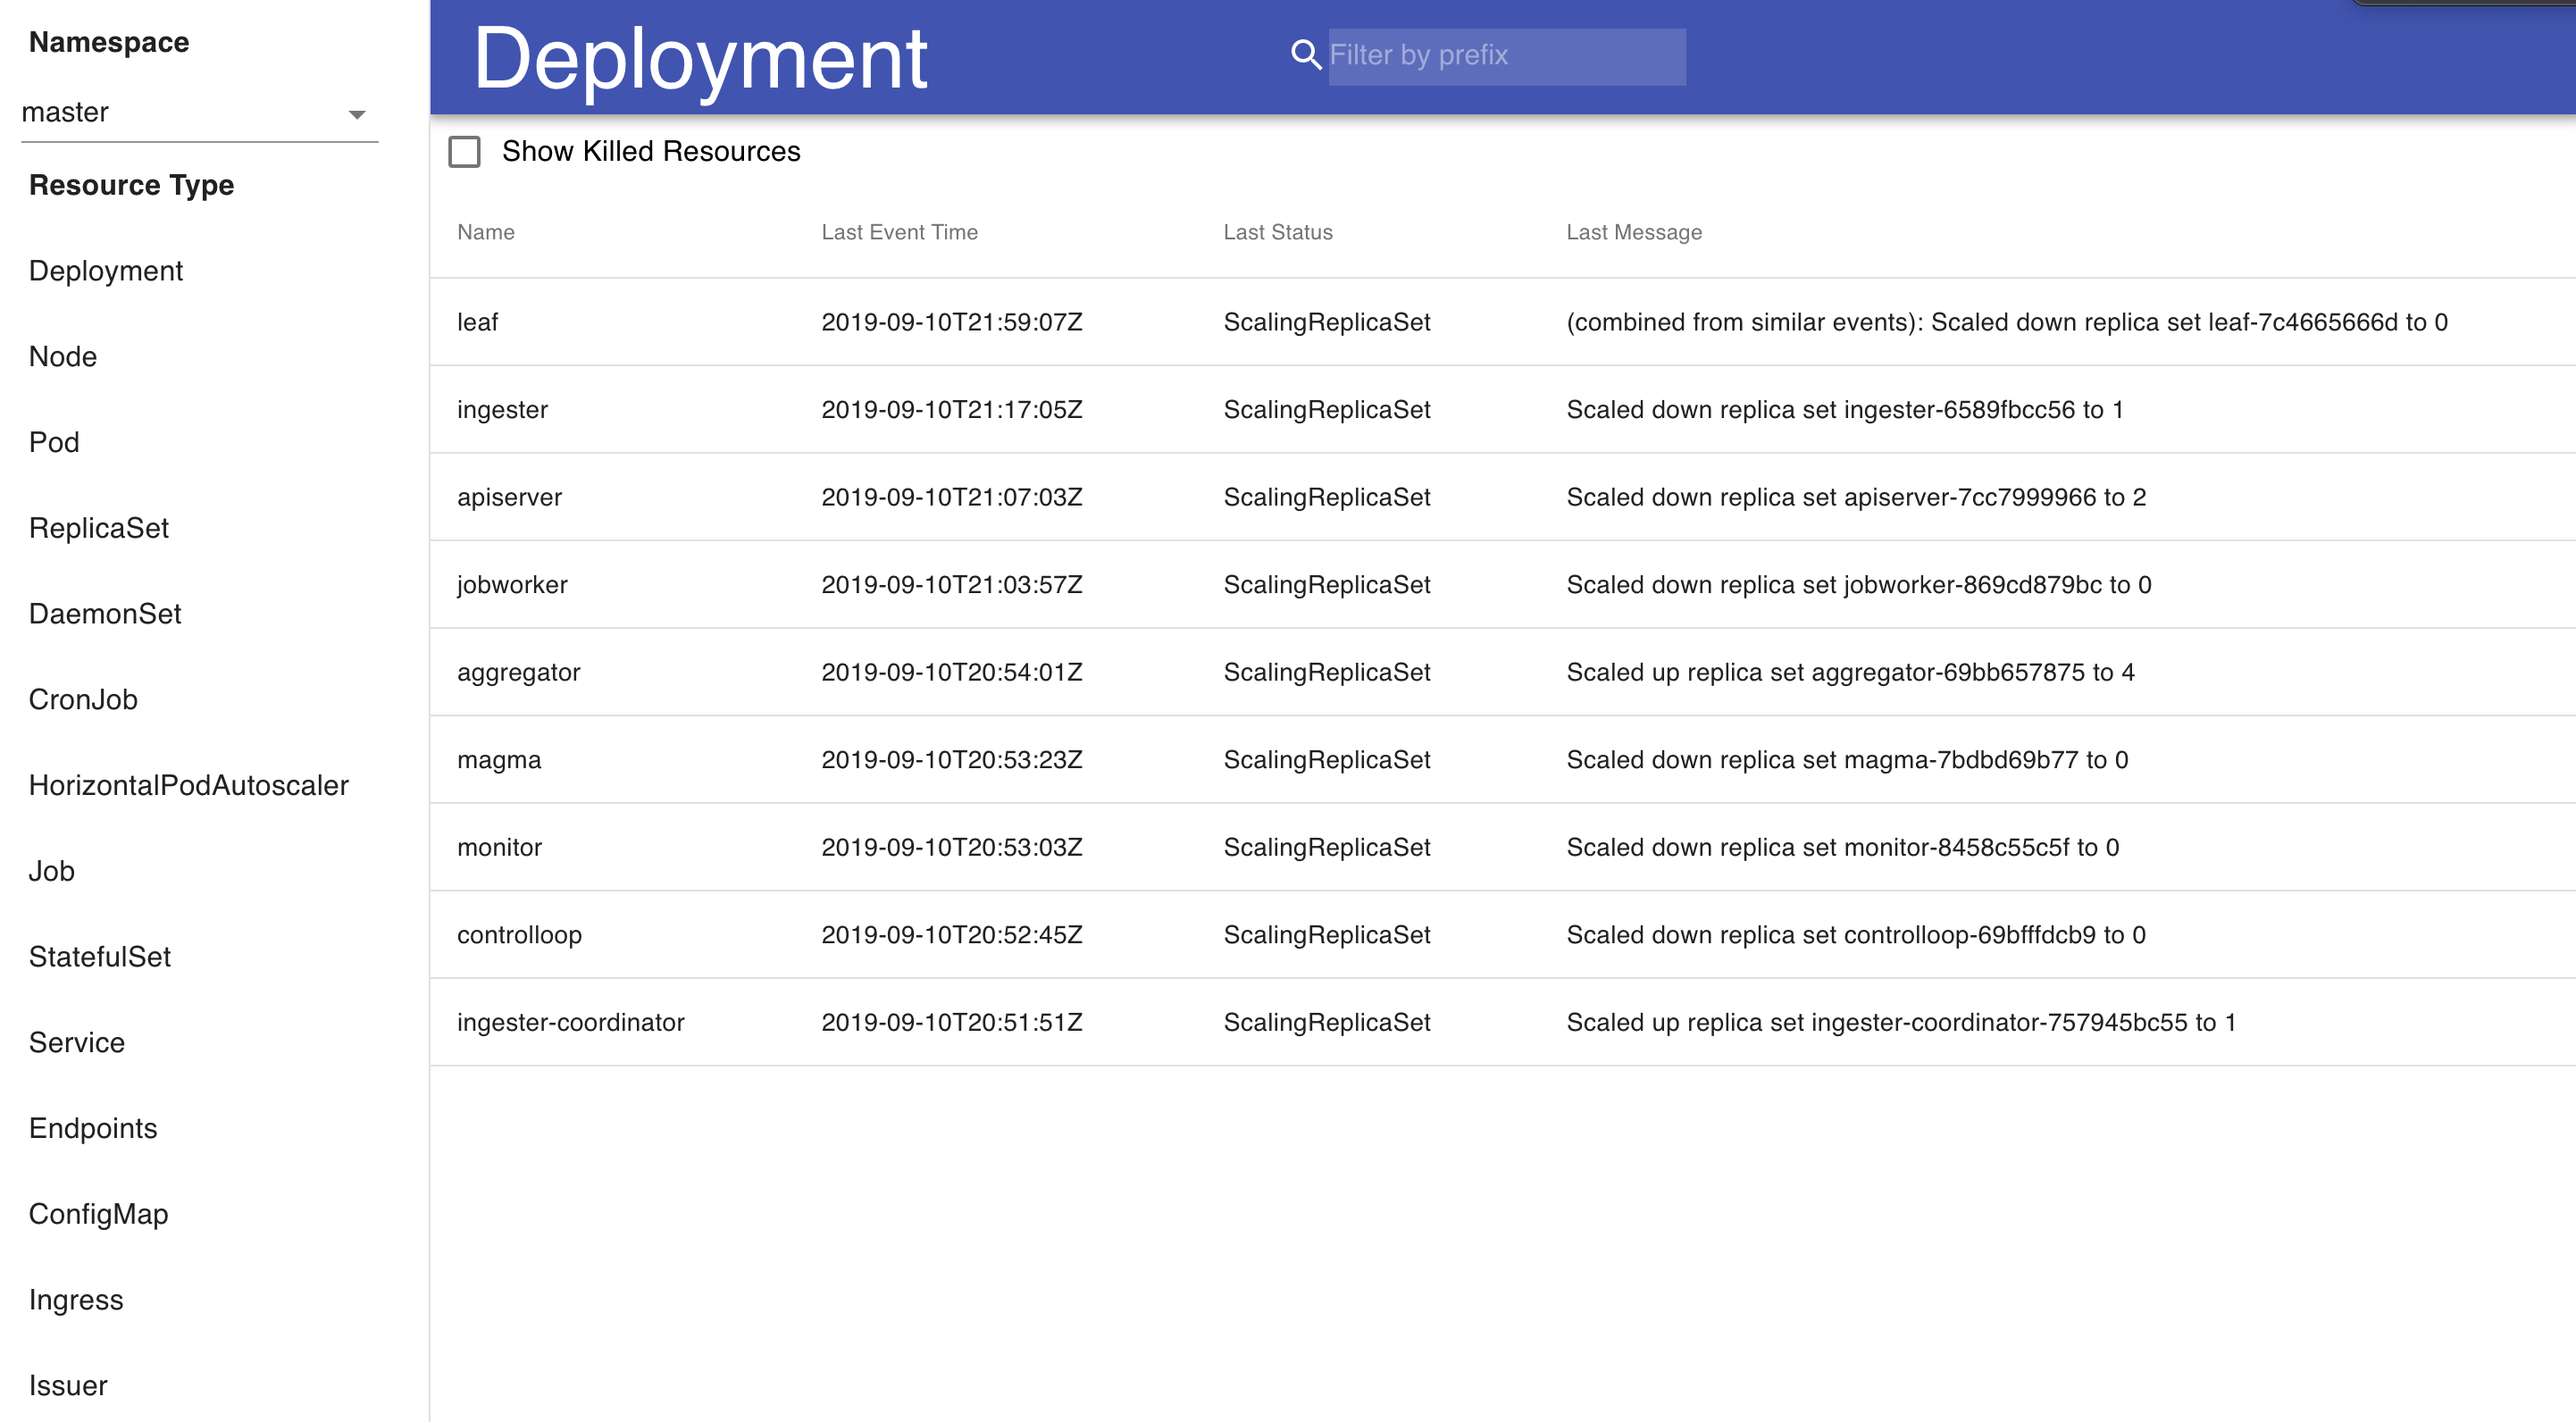
If we are interested in the health and state of any particular resource, each per-resource summary is clickable and opens a page with a detailed overview of the event logs of that resource, with a graph that shows the events and errors over time to provide a holistic picture of how the resource is being managed.
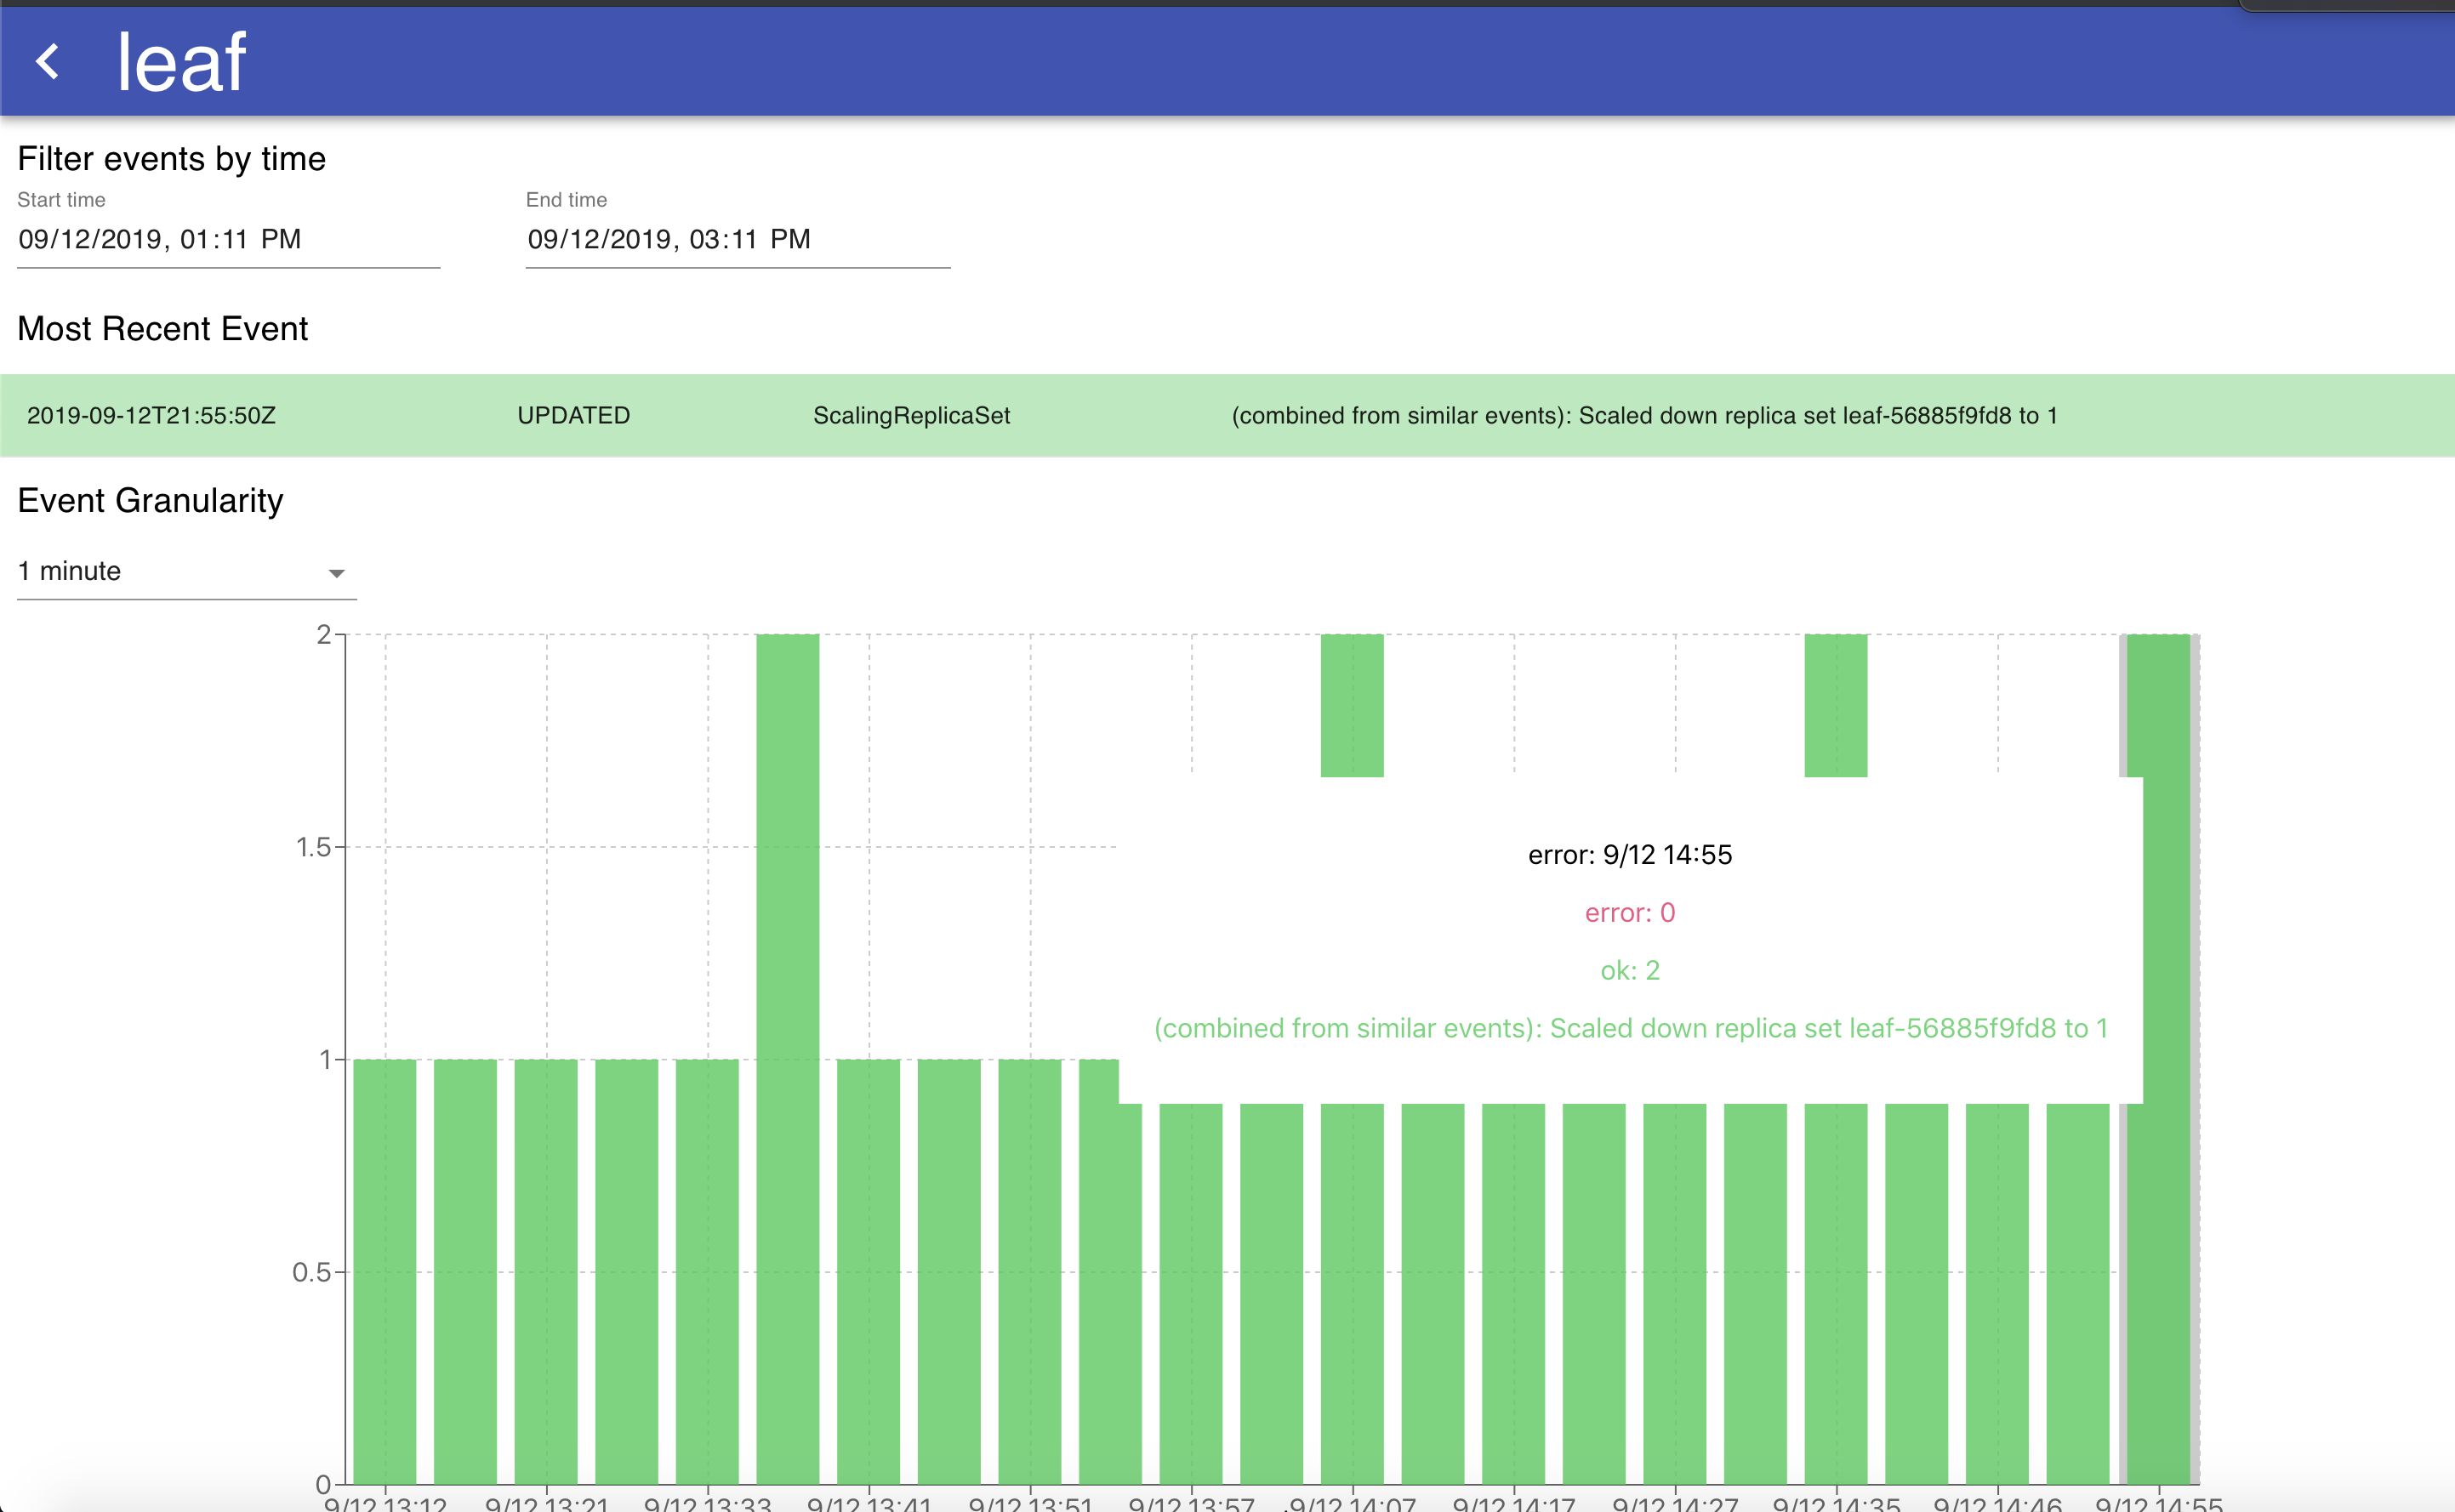
The graph in this visualization has adjustable granularity, and the change in time range allows for viewing the events for a given resource over any specified interval. Hovering over a specific bar on the stacked bar chart allows us to see the types of errors occurring during that time period for helpful over-time analytics of what is occurring to a specific resource. The table of events listed below the graph is sorted by event time and also tells contains the same information as the graph - that is, a chronological overview of all the events that happened to this specific k8s resource. The graph and table are helpful ways to understand why a Kubernetes resource has been failing in the past, and any trends over time that may accompany that failure (for example, if it coincides with the release of a new microservice).
Conclusion
Currently, we are using the real-time visualization of events to investigate our own Kubernetes deployments in both development and production. This tool and data source allows us to see our deployments as they are ongoing without having to wrangle the kubectl interface to see what is broken and why. Additionally, this tool is helpful to get a retrospective look on past incidents. For example - if we spot transient issues, we now have the power to go back in time and take a retrospective look at transient production issues, finding patterns of why it may have occurred, and what we can do to prevent the incident from happening again in the future.
The ability to access historical Kubernetes event logs at fine granularity is a powerful abstraction that provides us at Rockset a better understanding of the state of our Kubernetes system than kubectl alone would allow us. This unique data source and visualization allows us to monitor our deployments and resources, as well as look at issues from a historical perspective. We’d love for you to try this, and contribute to it if you find it useful in your own environments!
Link: https://github.com/rockset/recipes/tree/master/k8s-event-visualization