
Firefox Debugger has evolved into a fast and reliable tool chain over the past several months and it’s now supporting many cool features. Though primarily used to debug JavaScript, did you know that you can also use Firefox to debug your TypeScript applications?
Before we jump into real world examples, note that today’s browsers can’t run TypeScript code directly. It’s important to understand that TypeScript needs to be compiled into Javascript before it’s included in an HTML page.
Also, debugging TypeScript is done through a source-map, and so we need to instruct the compiler to produce a source-map for us as well.
You’ll learn the following in this post:
- Compiling TypeScript to JavaScript
- Generating source-map
- Debugging TypeScript
Let’s get started with a simple TypeScript example.
TypeScript Example
The following code snippet shows a simple TypeScript hello world page.
// hello.ts

interface Person {
  firstName: string;
  lastName: string;
}

function hello(person: Person) {
  return "Hello, " + person.firstName + " " + person.lastName;
}

function sayHello() {
  let user = { firstName: "John", lastName: "Doe" };
  document.getElementById("output").innerText = hello(user);
}
TypeScript (TS) is very similar to JavaScript and the example should be understandable even for JS developers unfamiliar with TypeScript.
The corresponding HTML page looks like this:
// hello.html

<!DOCTYPE html>
<html>
<head>
  <script src="hello.js"></script>
</head>
<body">
  <button onclick="sayHello()">Say Hello!</button>
  <div id="output"></div>
</body>
</html>
Note that we are including the hello.js not the hello.ts file in the HTML file. Today’s browser can’t run TS directly, and so we need to compile our hello.ts file into regular JavaScript.
The rest of the HTML file should be clear. There is one button that executes the sayHello() function and <div id="output"> that is used to show the output (hello message).
Next step is to compile our TypeScript into JavaScript.
Compiling TypeScript To JavaScript
To compile TypeScript into JavaScript you need to have a TypeScript compiler installed. This can be done through NPM (Node Package Manager).
npm install -g typescriptUsing the following command, we can compile our hello.ts file. It should produce a JavaScript version of the file with the *.js extension.
tsc hello.tsIn order to produce a source-map that describes the relationship between the original code (TypeScript) and the generated code (JavaScript), you need to use an additional --sourceMap*.map file.
tsc hello.ts --sourceMapYes, it’s that simple.
You can read more about other compiler options if you are interested.
The generated JS file should look like this:
function greeter(person) {
  return "Hello, " + person.firstName + " " + person.lastName;
}
var user = {
  firstName: "John",
  lastName: "Doe"
};
function sayHello() {
  document.getElementById("output").innerText = greeter(user);
}
//# sourceMappingURL=hello.js.map
The most interesting thing is probably the comment at the end of the generated file. The syntax comes from old Firebug times and refers to a source map file containing all information about the original source.
Are you curious what the source map file looks like? Here it is.
{
   "version":3,
   "file":"hello.js",
   "sourceRoot":"",
   "sources":["hello.ts"],
   "names":[],
   "mappings":
"AAKA,SAAS,OAAO,CAAC,MAAc;IAC7B,OAAO,SAAS,GAAG,MAAM,CAAC,SAAS,GAAG,GAAG,GAAG,MAAM,CAAC,QAAQ,CAAC;AAC9D,CAAC;AAED,IAAI,IAAI,GAAG;IACT,SAAS,EAAE,MAAM;IACjB,QAAQ,EAAE,KAAK;CAChB,CAAC;AAEF,SAAS,QAAQ;IACf,QAAQ,CAAC,cAAc,CAAC,QAAQ,CAAC,CAAC,SAAS,GAAG,OAAO,CAAC,IAAI,CAAC,CAAC;AAC9D,CAAC"
}
It contains information (including location) about the generated file (hello.js), the original file (hello.ts), and, most importantly, mappings between those two. With this information, the debugger knows how to interpret the TypeScript code even if it doesn’t know anything about TypeScript.
The original language could be anything (RUST, C++, etc.) and with a proper source-map, the debugger knows what to do. Isn’t that magic?
We are all set now. The next step is loading our little app into the Debugger.
Debugging TypeScript
The debugging experience is no different from how you’d go about debugging standard JS. You’re actually debugging the generated JavaScript, but since source-map is available the debugger knows how to show you the original TypeScript instead.
This example is available online, so if you are running Firefox you can try it right now.
Let’s start with creating a breakpoint on line 9 in our original TypeScript file. To hit the breakpoint you just need to click on the Say Hello! button introduced earlier.

See, it’s TypeScript there!
Note the Call stack panel on the right side, it properly shows frames coming from hello.ts file.
One more thing: If you are interested in seeing the generated JavaScript code you can use the context menu and jump right into it.
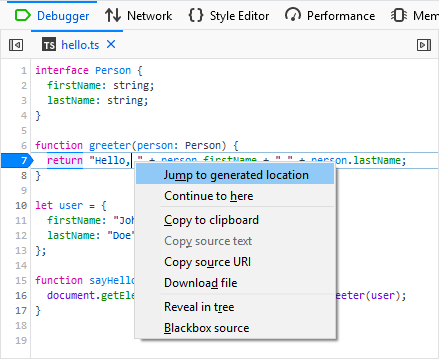
This action should navigate you to the hello.js file and you can continue debugging from the same location.

You can see that the Sources tree (on the left side) shows both these files at the same time.
Map Scopes
Let’s take a look at another neat feature that allows inspection of variables in both original and generated scopes.
Here is a more complex glitch example.
- Load https://firefox-devtools-example-babel-typescript.glitch.me/
- Open DevTools Toolbox and select the Debugger panel
- Create a breakpoint in
Webpack/src/index.tsxfile on line45 - The breakpoint should pause JS execution immediately
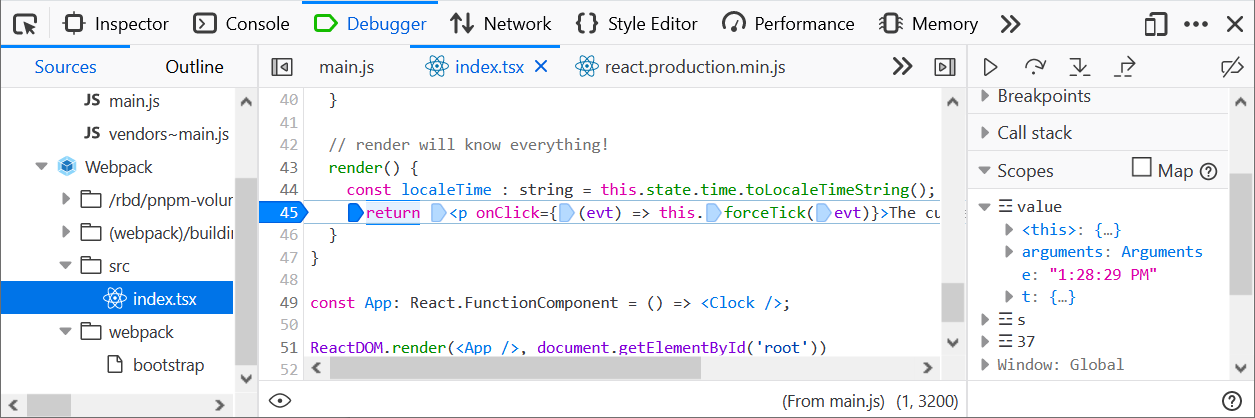
Notice the Scopes panel on the right side. It shows variables coming from generated (and also minified) code and it doesn’t correspond to the original TSX (TypeScript with JSX) code, which is what you see in the Debugger panel.
There is a weird e variable instead of localeTime, which is actually used in the source code.
This is where the Map scopes feature comes handy. In order to see the original variables (used in the original TypeScript code) just click the Map checkbox.
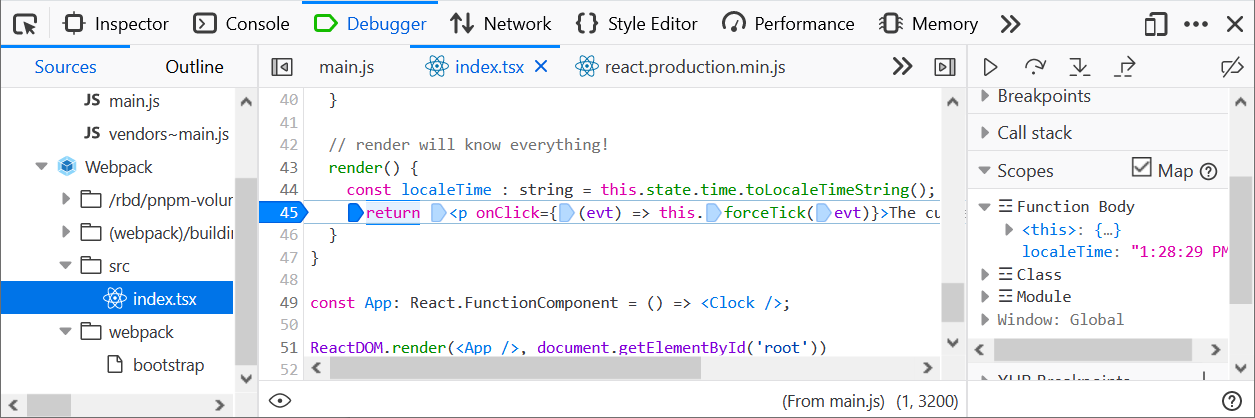
See, the Scopes panel shows the localeTime variable now (and yes, the magic comes from the source map).
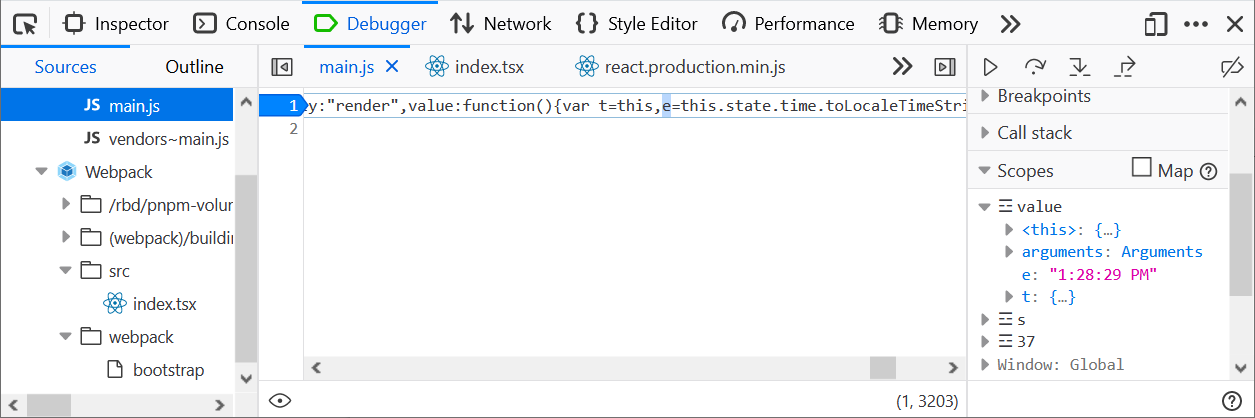
Finally, if you are interested in where the e variable comes from, jump into the generated location using the context menu (like we just did in the previous example).
Stay tuned for more upcoming Debugger features!
Jan ‘Honza’ Odvarko
About Jan Honza Odvarko
Honza is working on Firefox Developer Tools