
As a backend developer, I always need to monitor something. State machine in the database, records count, message queue lag, custom application metrics, system performance, progress of my deployment scripts. Tons of stuff!
For a long time I was trying to find a tool which can save me time — will be able to keep everything in one place, and notify me when needed. Heavy production monitoring systems can't help with the development tasks, I needed a swiss army knife - something that can be configured in a minute and give me the results right away.
There were no such thing, so I wrote my own. Meet Sampler - command-line UI for any shell commands, written in pure Go.
To install, follow the instructions for macOS, Linux or Windows
How does it work?
The idea is very simple - almost all metrics you might want to monitor and visualize are available via CLI:
- The basics: CPU, memory, disk space, network
- Telemetry from a remote machine via SSH
- Any database metrics and results of your custom queries
- Kafka, RabbitMQ, ActiveMQ
- K8s RAM/CPU/events
- Everything available via http, e.g. Spring Boot Actuator metrics
- Docker
- JMX
- Logs
That means we can create our dashboards without complex integrations, drivers and dependencies. We can do it right from the terminal.
Using Sampler is basically a 3-step process:
- Define your configuration in a YAML file
- Run
sampler -c your-config-file.yml - Adjust components size and location on UI
Examples
Visualizations and their YAML configuration
Runcharts

runcharts:
  - title: Search engine response time
    rate-ms: 500        # sampling rate, default = 1000
    scale: 2            # number of digits after sample decimal point, default = 1
    legend:
      enabled: true     # enables item labels, default = true
      details: false    # enables item statistics: cur/min/max/dlt values, default = true
    items:
      - label: GOOGLE
        sample: curl -o /dev/null -s -w '%{time_total}'  https://www.google.com
        color: 178      # 8-bit color number, default one is chosen from a pre-defined palette
      - label: YAHOO
        sample: curl -o /dev/null -s -w '%{time_total}'  https://search.yahoo.com
      - label: BING
        sample: curl -o /dev/null -s -w '%{time_total}'  https://www.bing.com
Sparklines

sparklines:
  - title: CPU usage
    rate-ms: 200
    scale: 0
    sample: ps -A -o %cpu | awk '{s+=$1} END {print s}'
  - title: Free memory pages
    rate-ms: 200
    scale: 0
    sample: memory_pressure | grep 'Pages free' | awk '{print $3}'
Barcharts
![]()
barcharts:
  - title: Local network activity
    rate-ms: 500        # sampling rate, default = 1000
    scale: 0            # number of digits after sample decimal point, default = 1
    items:
      - label: UDP bytes in
        sample: nettop -J bytes_in -l 1 -m udp | awk '{sum += $4} END {print sum}'
      - label: UDP bytes out
        sample: nettop -J bytes_out -l 1 -m udp | awk '{sum += $4} END {print sum}'
      - label: TCP bytes in
        sample: nettop -J bytes_in -l 1 -m tcp | awk '{sum += $4} END {print sum}'
      - label: TCP bytes out
        sample: nettop -J bytes_out -l 1 -m tcp | awk '{sum += $4} END {print sum}'
Gauges
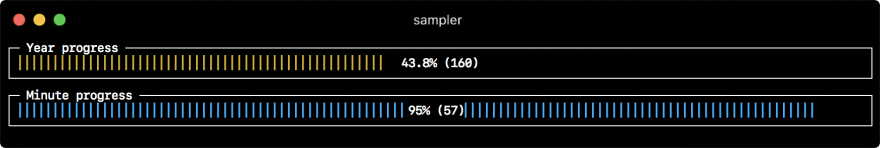
gauges:
  - title: Minute progress
    rate-ms: 500        # sampling rate, default = 1000
    scale: 2            # number of digits after sample decimal point, default = 1
    percent-only: false # toggle display of the current value, default = false
    color: 178          # 8-bit color number, default one is chosen from a pre-defined palette
    cur:
      sample: date +%S  # sample script for current value
    max:
      sample: echo 60   # sample script for max value
    min:
      sample: echo 0    # sample script for min value
  - title: Year progress
    cur:
      sample: date +%j
    max:
      sample: echo 365
    min:
      sample: echo 0
Textboxes
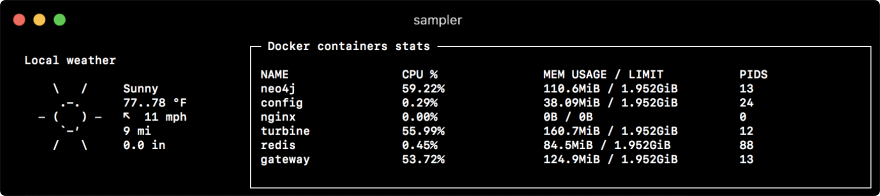
textboxes:
  - title: Local weather
    rate-ms: 10000      # sampling rate, default = 1000
    sample: curl wttr.in?0ATQF
    border: false       # border around the item, default = true
    color: 178          # 8-bit color number, default is white
  - title: Docker containers stats
    rate-ms: 500
    sample: docker stats --no-stream --format "table {{.Name}}\t{{.CPUPerc}}\t{{.MemUsage}}\t{{.PIDs}}"
Asciiboxes

asciiboxes:
  - title: UTC time
    rate-ms: 500        # sampling rate, default = 1000
    font: 3d            # font type, default = 2d
    border: false       # border around the item, default = true
    color: 43           # 8-bit color number, default is white
    sample: env TZ=UTC date +%r
There is more!
Interactive shell support, PTY mode, triggers, alerts and variables. Real-world recipes to work with MySQL, PostgreSQL, MongoDB, Neo4J, Kafka, SSH and JMX. You can read about advanced capabilities in the documentation.
Don't hesitate to ask questions, contribute and ⭐ star ⭐ the project on Github!


Top comments (7)
Great article! Such an awesome tool! I like that you don’t need to know how to program to use it😁
If you ever want to get away from the terminal check out this article I wrote about a similar tool 😝 dev.to/jcoelho/powershell-universa...
Love love love this. Going to build one and stick it on a 40" display! 😆
Good job, mate !
Pretty cool project, thanks for sharing! Does this work with Prometheus? Because that would be bomb 💣 I could look at my server metrics while on the server
Looks great and being written in Go makes me want to learn this language even more.
I'll give it a try asap.
This might be the most effective use of graphics in a console that I have ever seen. Thank you for sharing this work of art with us!
Very impressive stuff. It looks awesome as well, good job!