
This article was created in partnership with Percy. Thank you for supporting the partners who make SitePoint possible.
Visual testing is the automated process of ensuring your user interface looks correct in different browsers and at different screen widths.
Most development teams rely solely on unit and integration tests. While this practice helps ensure application logic is working correctly, it fails to detect visual defects at the UI level. Implementing this type of test allows visual problems to be detected early and to get fixed before the product is released.
In this tutorial, you’ll learn how to set up and run visual testing for your project using Percy. For demonstration purposes, we’ll be using a single-page application that’s API-driven using real-world data. You’ll learn how to visually test UIs that output dynamic data, and about Percy’s visual review and approval workflow.
Prerequisites
Visual testing is a topic for intermediate and advanced users. To follow this tutorial, you’ll need to be comfortable writing code in JavaScript ES6+ syntax. We won’t be doing actual app development, but you should at least have some experience using the following libraries in case you want to tweak something in the demo project we’ll be using:
- Express.js + RESTful APIs
- jQuery
- Axios
- CSS frameworks
You should also be familiar with Git branching and different types of branching strategies. Familiarity with any testing framework will also help you easily understand the concepts discussed in this article. You’ll need to have a GitHub account before you can proceed with this tutorial. We’ll use this demo project as our starting point.
About Percy
Percy provides developers with a platform and workflow to run visual testing and reviews on web apps, static sites, or component libraries. There’s a free plan that supports unlimited team members, 5,000 snapshots per month (with a one-month history), and unlimited projects.
To get started with Percy, install one of its SDKs into the project you want to visually test. It’s the same as installing a testing framework like Mocha or Jest. Next, you write a script and run it just as you would with any type of test.
However, in Percy’s case, DOM snapshots of your web application are captured and uploaded for rendering on Percy’s infrastructure. Percy then detects and highlights visual differences between new and previous snapshots, also known as the baselines. The results are displayed in Percy, where you can review and determine whether the UI looks correct or needs to be fixed.
Percy renders each snapshot in Chrome and Firefox and can render at up to ten different screen resolutions. That’s quite impressive, as doing this manually is tiresome. I encourage you to read through the following docs to gain a deeper understanding:
Next, let’s dive into the practical implementation of the visual testing process. In this article, we will:
- set up a demo project
- set up the Percy project dashboard
- generate Percy snapshots
- handle dynamic data
- set up the approval workflow
Let’s get started.
1. Setting up the demo project
We’re going to perform visual testing on an API-driven currency app I built earlier. You can find the tutorial for building this app here if you’re interested.
Otherwise, head over to this GitHub repository and fork it to your GitHub account. Next, open README.md for instructions on how to download and configure the project on your hard drive. Follow them until you have the app running on your machine.
The project is a single-page application powered by Express, jQuery and Handlebars. AJAX calls from the web page are routed to the Express server, which in turn routes the requests to third-party currency API providers. The app is made up of three pages:
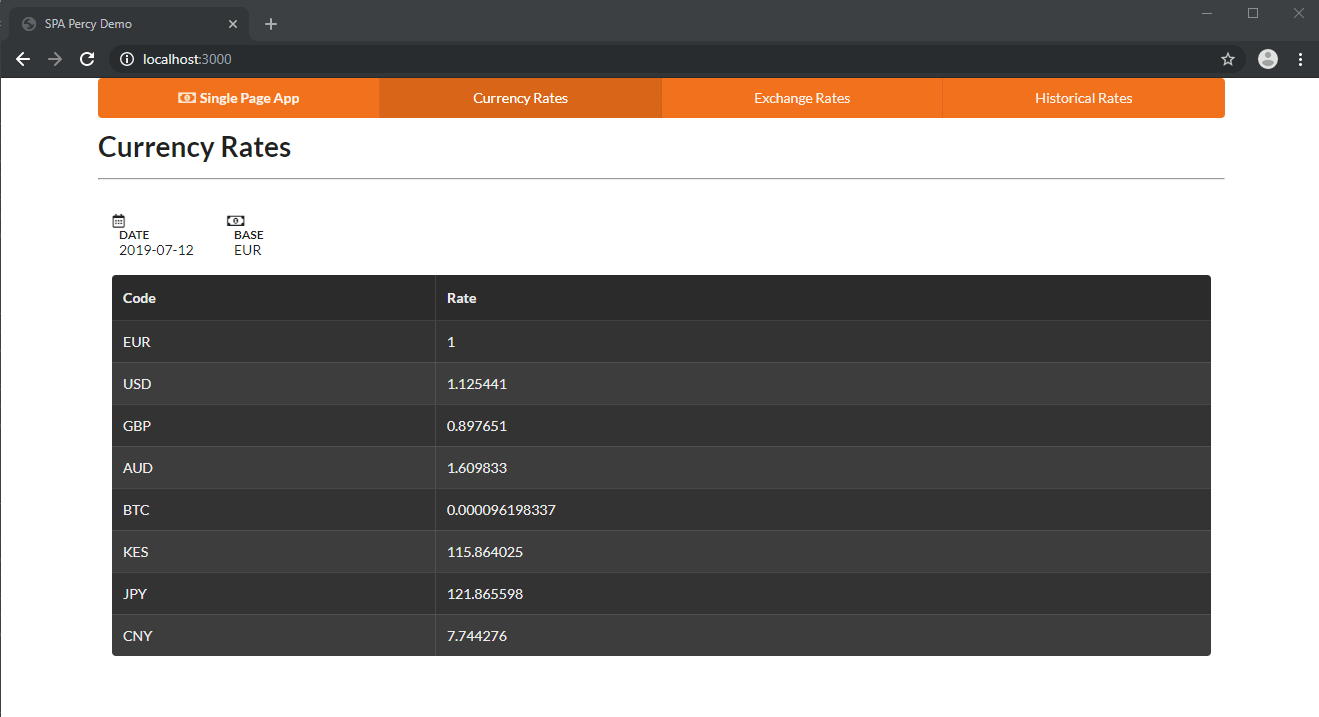
The home page of the app is where daily currency rates are displayed. The data is refreshed every hour.
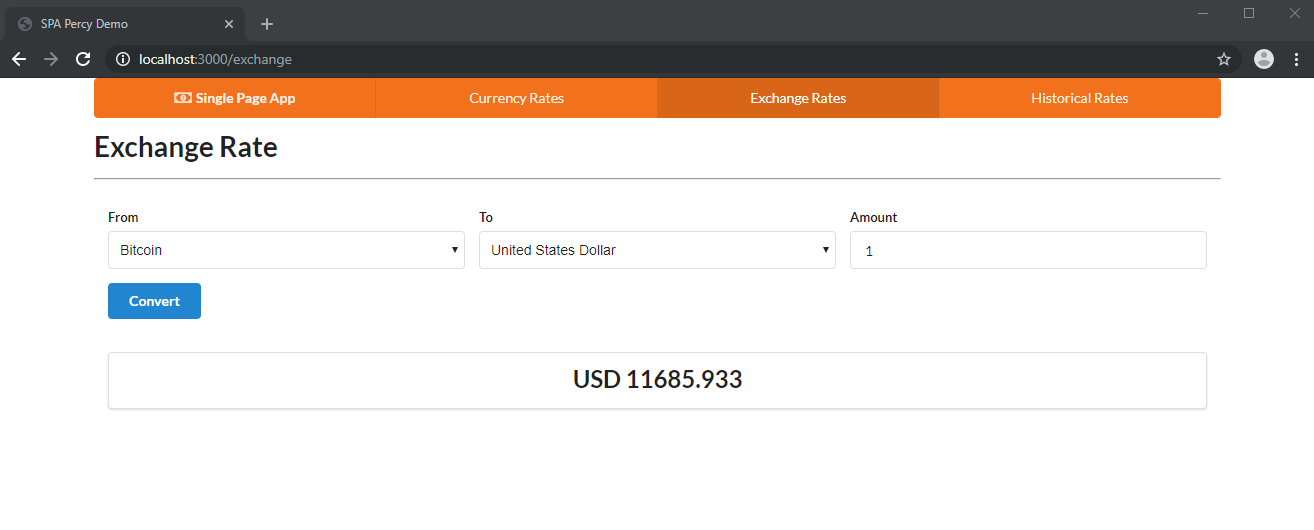
The exchange rate page allows you to convert one currency to another.
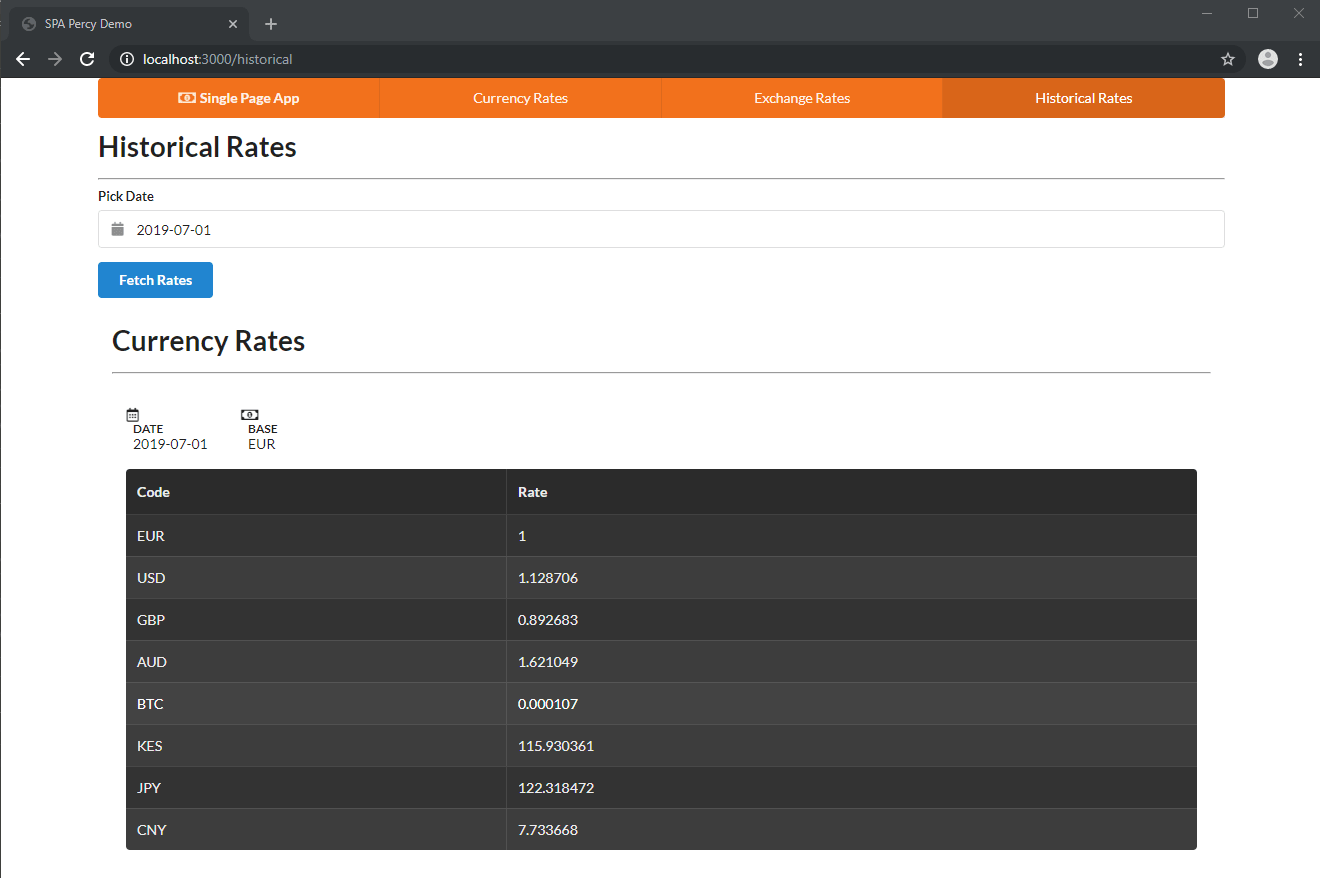
The Historical Rates page is similar to the Currency Rates page, except that it allows you to display rates for any past date as far back as 1999.
Feel free to go through the source code if you want to, but this isn’t necessary. The important thing is that you see for yourself how to interact with the app. In the next section, we’re going to automate this interaction using code to create the necessary snapshots required for visual testing. Next, let’s set up our Percy project account.
2. Setting up Percy’s project dashboard
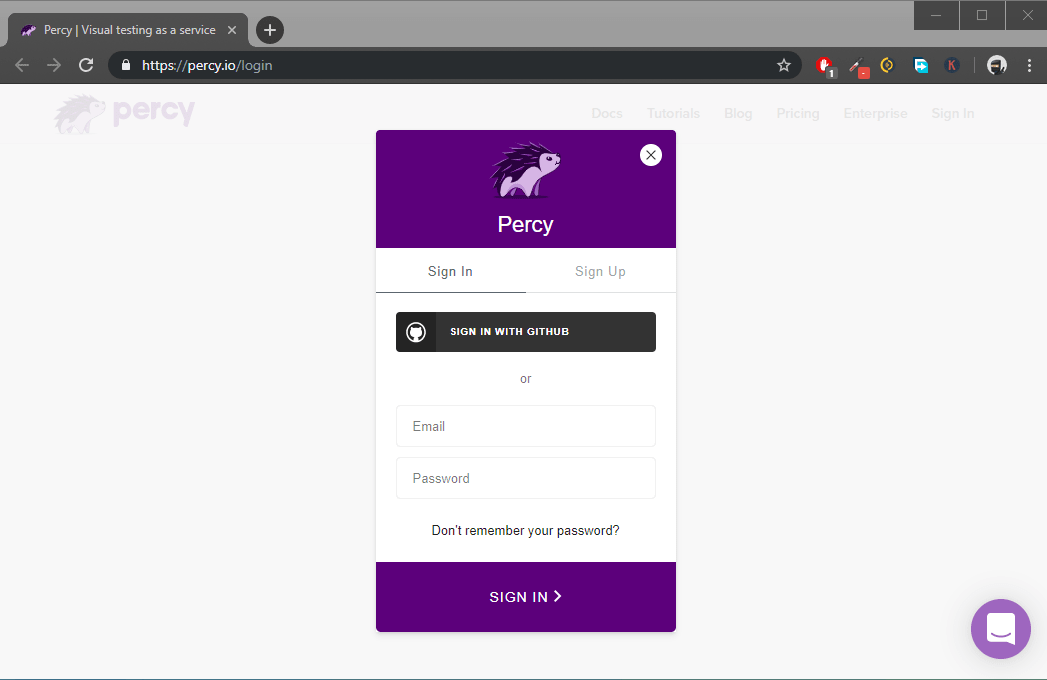
As mentioned earlier, the visual testing process requires a Percy project where we can review and approve snapshots. To get one, simply sign up for a free Percy account.
Once you’ve completed the sign-up process, you’ll be presented with the option of either creating a new project or trying out a demo project. This will take you through a guided tour that will show you how to interact with different elements of the review tools. Feel free to check it out, but it’s optional.
If you feel confident navigating the dashboard, scroll to the top and click the Create project button. Enter a project name on the next page: “Percy-Tutorial.” Once you confirm the name, you’ll be taken to the Build page, where you can configure visual testing settings for your project.
We’re going to link the “Percy-Tutorial” project to the project you forked to your GitHub account earlier. First, we need to give Percy permission to access our GitHub repositories. Repositories in GitHub are structured under organizations. You need to have the “owner” role to give Percy permission access to your repository.
Head over to the Integrations tab. Under the “Link a repository” section, you’ll get a message requiring you to “install an integration” for your organization. Click on it and you’ll be taken to a page with a list of Percy integrations. Follow the screens to set up the GitHub integration and give access to all the repositories that you want to perform visual testing on. After you’ve completed the installation steps, you need to link up the Percy-Tutorial project with your GitHub repository:
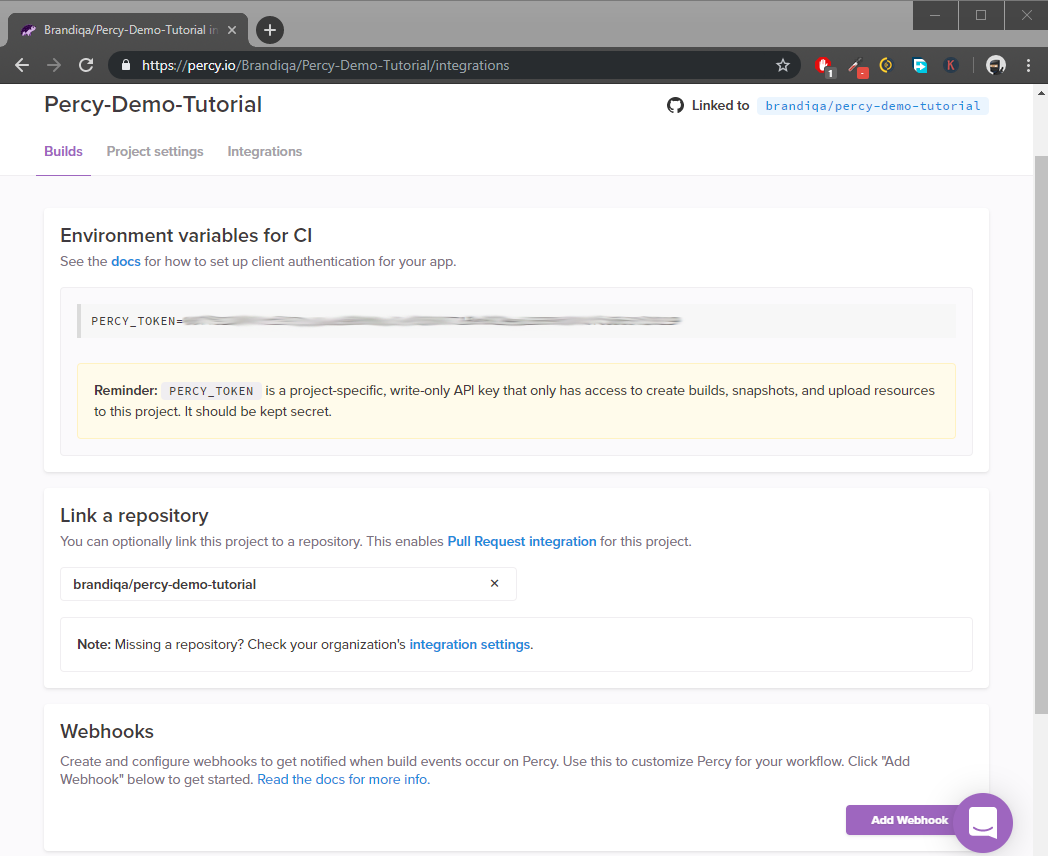
Next, navigate back to your Percy project and access the Builds page. Copy the PERCY_TOKEN under the CI section set-up and save it somewhere. We’ll need this for the next step.
3. Generate Percy snapshots
Now that we have our Percy project ready to receive snapshots, we need to generate and upload them to Percy for review. We’ll use PercyScript to accomplish this task. Go to the folder where you set up the demo project. Open a terminal and install the following package to it:
npm install -D @percy/script
PercyScript uses Puppeteer, which is a high-level API for controlling the Chrome browser over the DevTools protocol. In short, Puppeteer allows us to interact with a web page in the same way humans do but using code. For example, we can input text, and click buttons and links. Do note that the Chrome browser will be downloaded inside your node_modules folder, so be patient if you have a slow internet connection.
Next, create a new JavaScript file at the root of the project, snapshots.js, and copy this code. This script will create three snapshots for us, one for each page. There are many scenarios we can test for, but for the sake of simplicity, we’ll only test to ensure that each page is working and displaying the results correctly:
const PercyScript = require('@percy/script');

PercyScript.run(async (page, percySnapshot) => {
    /**
    |---------------------------------------|
    | Generate Daily Rates Snaphsot         |
    |---------------------------------------|
    **/
    await page.goto('http://localhost:3000/');
    // wait for AJAX call to complete
    await page.waitForSelector('.loading', {
        hidden: true
    });
    // Take snapshot
    await percySnapshot('homepage');

    /**
    |---------------------------------------|
    | Generate Exchange Rate Snapshot       |
    |---------------------------------------|
    **/
    await page.goto('http://localhost:3000/exchange');
    // Wait for AJAX call to complete
    await page.waitForSelector('.loading', {
        hidden: true
    });
    await page.select('select#from', 'BTC'); // Select Bitcoin
    await page.select('select#to', 'USD'); // Select US Dollar
    await page.type('#amount', '1'); // Enter Amount
    await page.click('.submit'); // Hit the convert button
    // wait for AJAX call to complete
    await page.waitForSelector('.loading', {
        hidden: true
    });
    // Take snapshot
    await percySnapshot('exchange');

    /**
    |---------------------------------------|
    | Generate Historical Rates Snapshot    |
    |---------------------------------------|
    **/
    await page.goto('http://localhost:3000/historical');
    // wait for AJAX call to complete
    await page.waitForSelector('.loading', {
        hidden: true
    });
    // Set Calendar Date Input
    await page.evaluate(() => {
        document.getElementById('date').value = '2019-07-01';
    })
    // Click Fetch Rates Button
    await page.click('.submit');
    // wait for AJAX call to complete
    await page.waitForSelector('.loading', {
        hidden: true
    });
    // Take snapshot
    await percySnapshot('historical');
});
To understand the script, you’ll need to go through Puppeteer’s API documentation to find references to the functions used. You’ll also need to read the comments I’ve put in place to understand what each line does.
One thing I would like to clarify is that I’m using Semantic UI Loader in the Currency App project to indicate to the user that an AJAX request is being processed in the background. When the request is complete, the loader is hidden from view using CSS. In the Puppeteer code, we need to wait for the loader to disappear before we can take a snapshot.
Before we run the script, we need to launch a separate terminal to run our app using the command npm start. Otherwise, Percy won’t be able to find and interact with our web app.
Let’s run the script. If you’re on Windows, I recommend you use Git Bash or any Linux-based terminal to execute the following command. If you insist on using PowerShell or any Windows-based terminal, you’ll need to use the right syntax for setting environment variables:
$ export PERCY_TOKEN=aaabbbcccdddeee # Replace this with your project token
$ npx percy exec -- node snapshots.js
Give this a few seconds for the snapshots to be generated and uploaded to your Percy project dashboard:
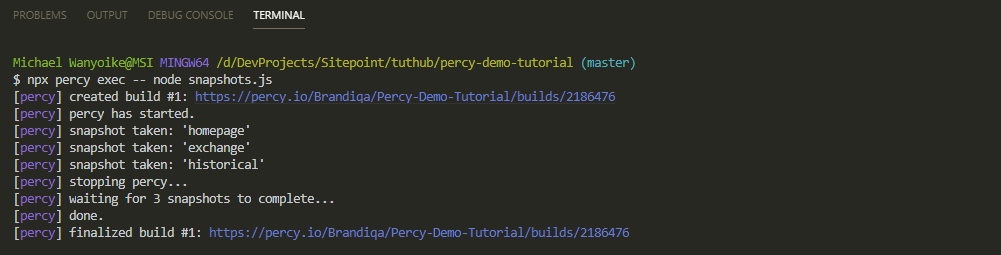
A link to the results will be generated for you. Press Alt + click on the link to open the dashboard build page. You can also find the results directly in Percy under the Builds tab. Once you open the page, you may have to wait a bit for the results to be displayed; the first build takes longer as Percy gathers and renders the assets for the first time. Since these are the first snapshots you’ve uploaded, there’s no baseline to compare against to detect visual diffs.
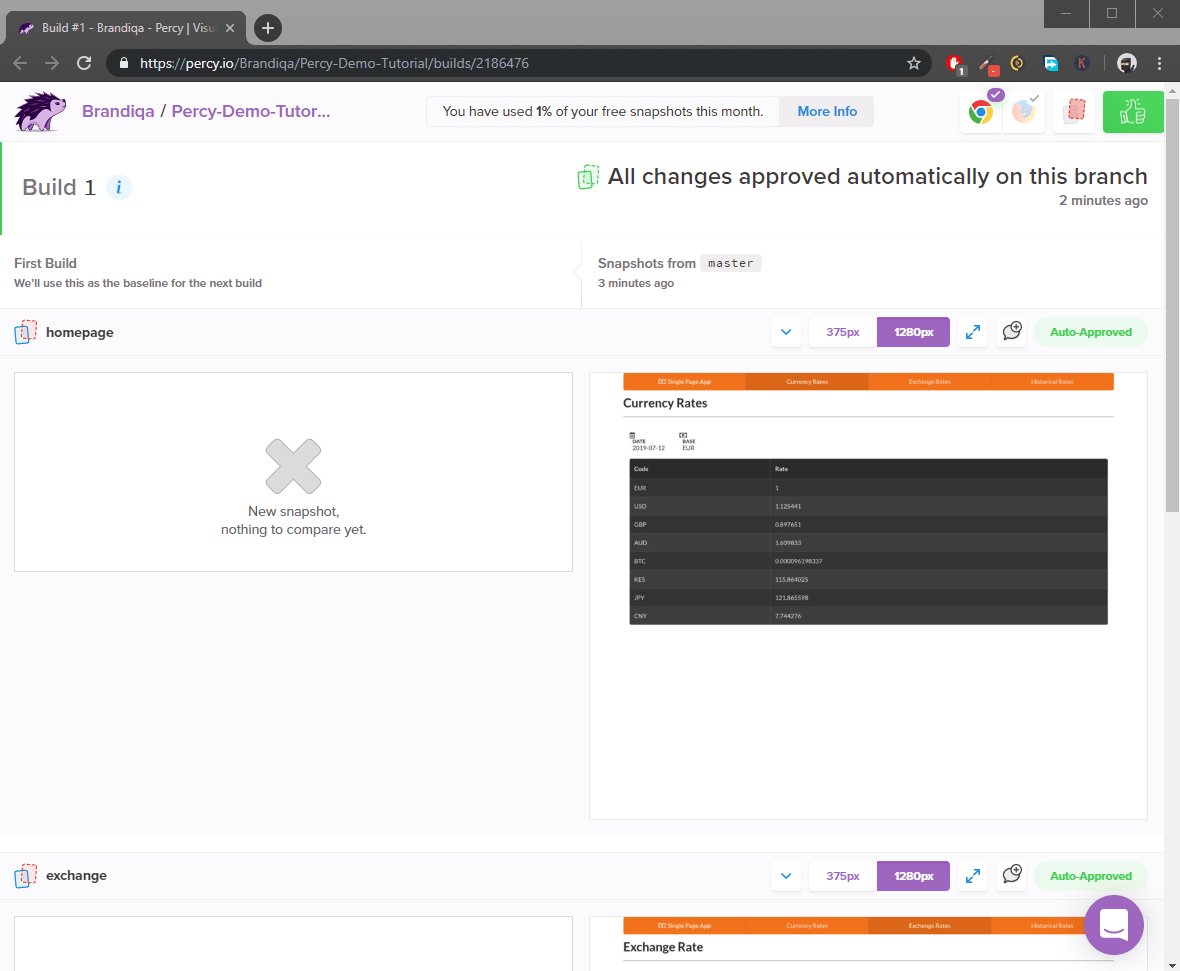
You may also have noticed that these snapshots have been “auto-approved”. Percy’s default setting is to auto-approve any test builds performed on the master branch. You can change this in your Project Settings.
The snapshots that have been generated look ideal to use as a baseline for future tests. However, there’s a problem. If you were to go for lunch now and then re-run the tests when you return, a visual diff is going to be detected despite not changing anything. This will occur on the Daily Rates and Exchange Rate pages. The history page won’t be affected, since the data is frozen on any specific past date.
The problem is caused when currency rates get refreshed and new results are displayed. This is a big problem, as visual diffs will be generated for something irrelevant. We need to freeze this data so that we can focus on testing areas that do matter. In the next section, you’ll learn how to do this.
4. Handling dynamic data
If your application deals with dynamic data, you can launch it in a test environment where it will seed fixed data. It’s possible to use data generation libraries such as faker.js for these projects. In our case, we’re dealing with dynamic data being sourced from a real-world, remote RESTful API. To solve this issue, we need to intercept the HTTP API requests and replace responses with our local data. Puppeteer has a function, page.setRequestInterception(true) that can allow us to do exactly that.
We’ll need to intercept requests for the Daily Currency Rates and Exchange Currency Conversion pages. During testing, we’ll supply the requests with our data so that snapshots will always be consistent. Update snapshots.js. Make sure to place the mock handling data and code at the top, as follows:
const PercyScript = require('@percy/script');

const mockRates = {
  "success": true,
  "timestamp": 1563176645,
  "base": "EUR",
  "date": "2019-07-15",
  "rates": {
    "EUR": 1,
    "USD": 1.12805,
    "GBP": 0.897815,
    "AUD": 1.604031,
    "BTC": 0.00011,
    "KES": 116.200495,
    "JPY": 121.793281,
    "CNY": 7.75354
  }
};

const mockConvertRate = {
  "rate": 10244.442
}

PercyScript.run(async (page, percySnapshot) => {
  /**
  |---------------------------------------|
  | Mock Page Requests                    |
  |---------------------------------------|
  **/

  //Activate request interception
  await page.setRequestInterception(true);
  // Listen to each page request
  page.on('request', request => {
    // Mock Daily Rates API
    if (request.url().includes('/api/rates')) {
      request.respond({
        status: 200,
        contentType: "application/json; charset=utf-8",
        body: JSON.stringify(mockRates) // return mock rates data
      });
    }
    // Mock Convert/Exchange API
    else if (request.url().includes('/api/convert')) {
       request.respond({
         status: 200,
         contentType: "application/json; charset=utf-8",
         body: JSON.stringify(mockConvertRate) // return convert rate data
       });
    } else {
      request.continue();
    }
  });
}
//...
Once again, run your Percy tests: npx percy exec -- node snapshots.js. Give it a few minutes. Soon, you should have a clean build that we’ll use as the baseline for future visual testing.
5. Approval workflow
In the course of developing a project, there will be many changes introduced to the application. Some of the changes may be accidental, others intentional. Either way, changes need to be approved by a project manager or team member. Assuming you have a Git branching strategy in place, this is a quick rundown of how the approval workflow looks:
- create a new feature branch
- make and commit changes on the feature branch
- create a pull request via your GitHub dashboard
- run the Percy tests
- approve the build in the Percy dashboard
- merge the feature branch
- create a new baseline on master
Let’s jump in and do some practice. We’ll start by creating a new feature branch:
git checkout -b feature-1
Next, let’s make some visual changes. We’ll change the icon and button colors. Open index.html in your code editor and use search-and-replace to replace all occurrences of orange with green, except for the one under menu. Leave that one orange. Only icons should change to green. Next, commit the changes and push to your remote repo:
git add .
git commit -m "Replaced Orange Color with Green"
git push -u origin feature-1
Next, go to your GitHub repo page and create a new pull request:
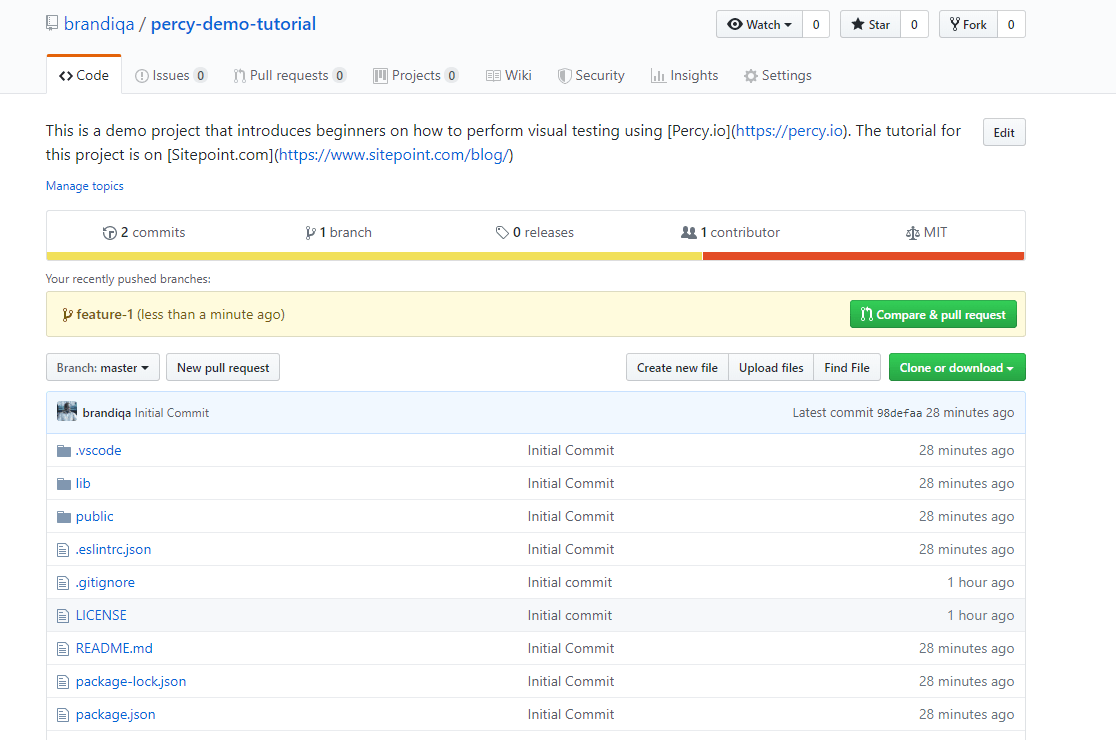
You can also click on the pull request link that’s provided to you after pushing the branch to remote. Feel free to provide a comment. After that’s done, you can generate a new visual test build: npx percy exec -- node snapshots.js.
After the script has executed, wait a bit for the snapshots to be rendered in Percy. If you were to check the status of your pull request, this is what you would see:
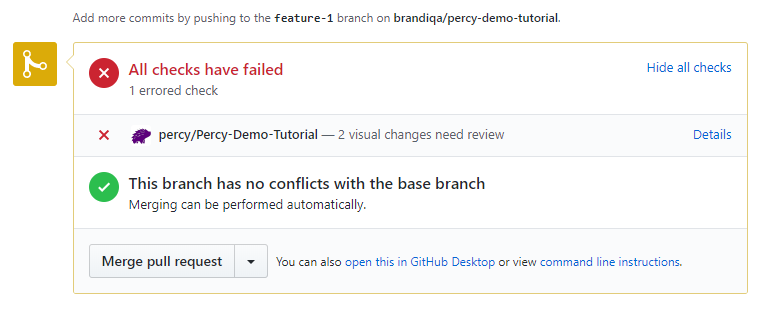
Clicking Details will take you to Percy to review the visual changes.
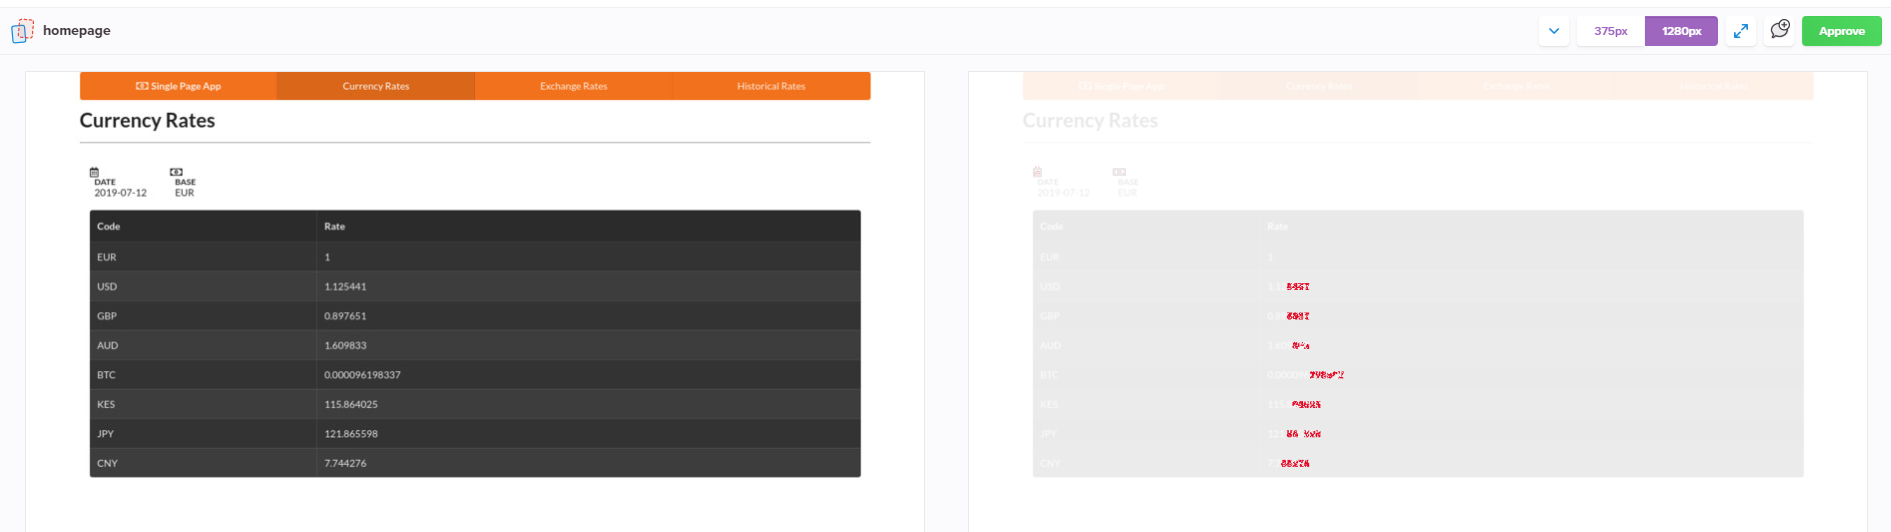
Daily Rates visual diff:
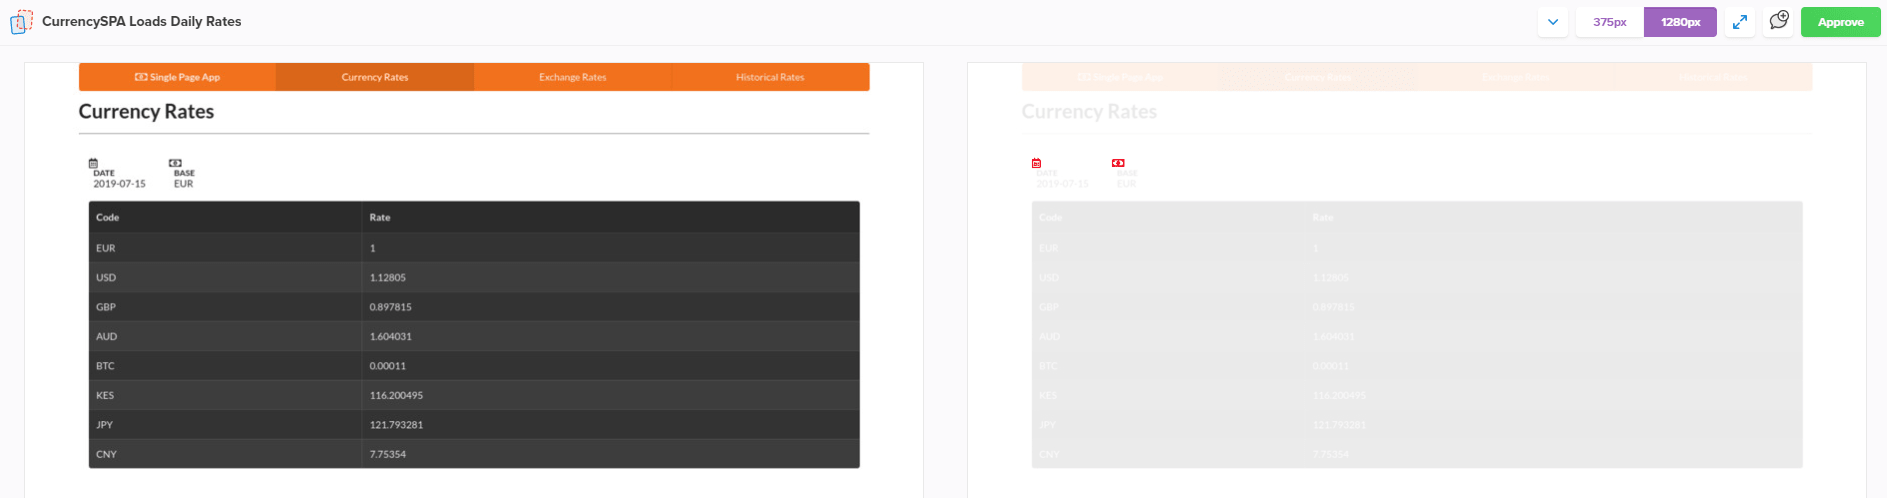
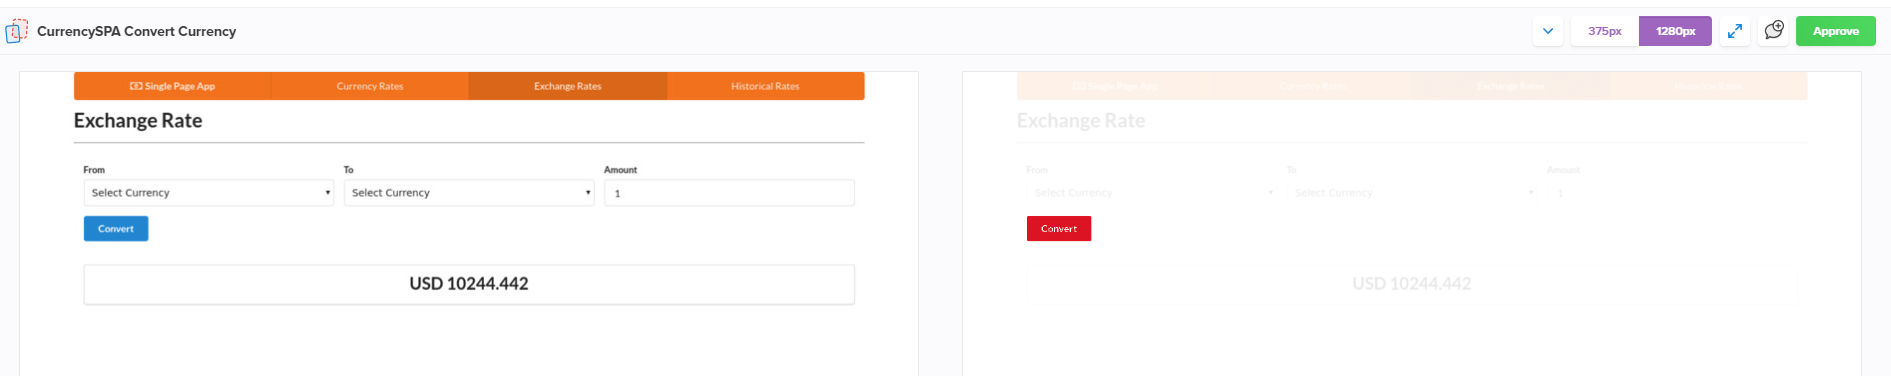
Exchange Rates visual diff:
Historical Rates visual diff:
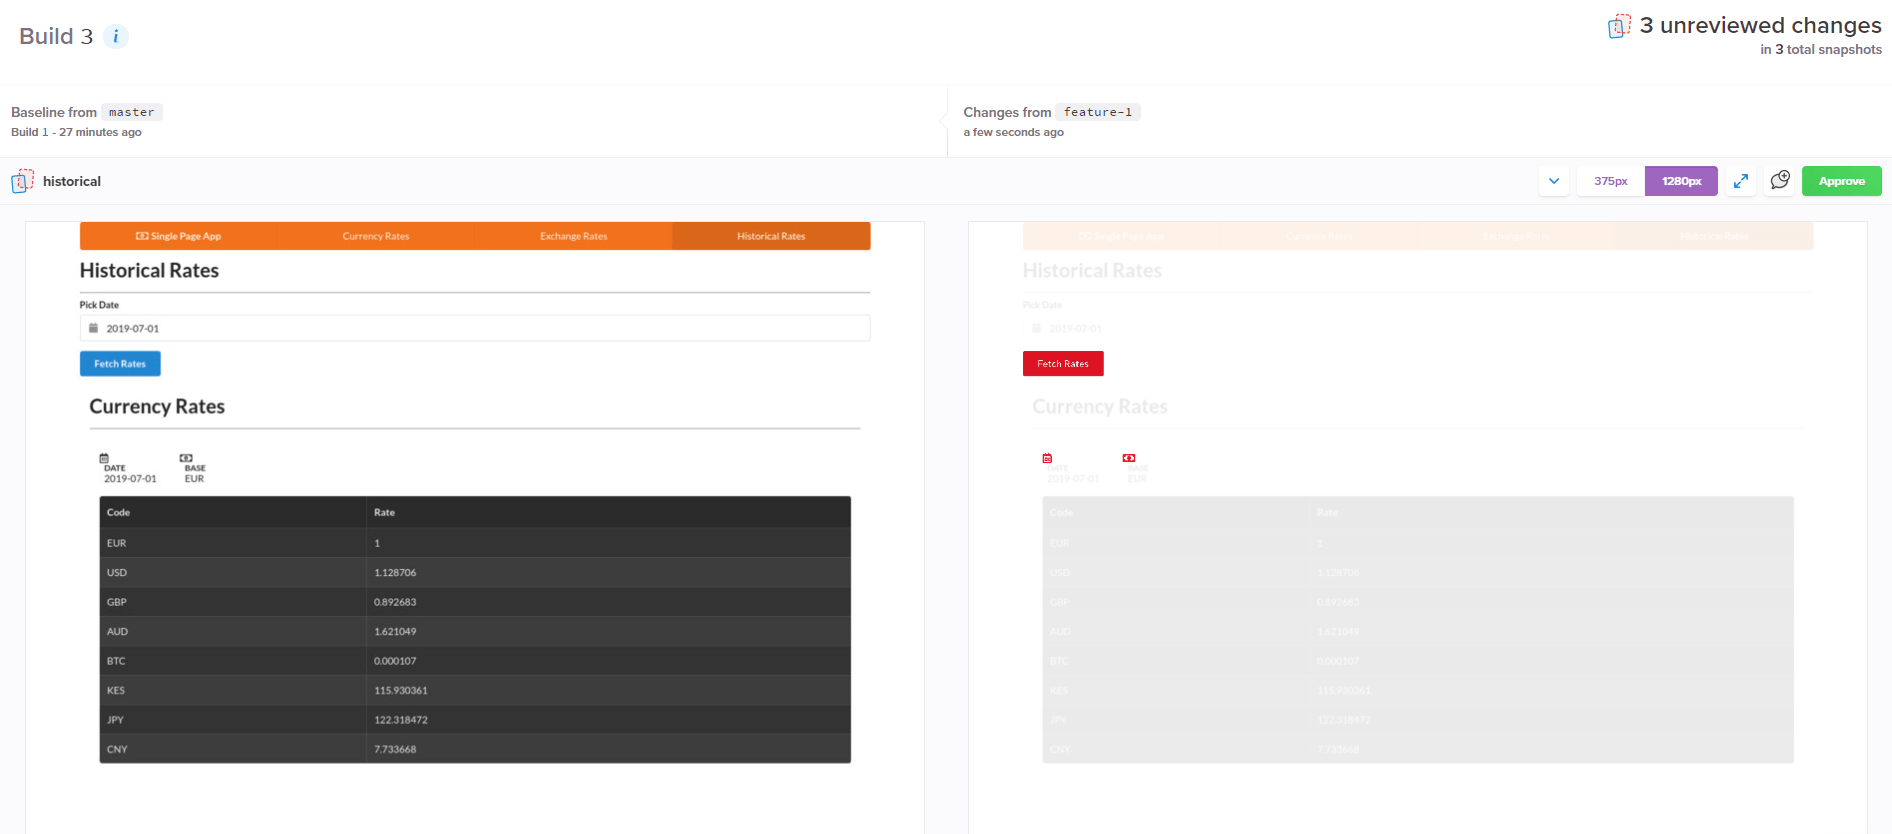
Everything looks great. Check to see the changes across browsers and device widths. The visual changes should be as expected. You can approve one by one, or hit the Approve All button at the top. Quickly switch to your GitHub dashboard and you’ll see your pull request update:
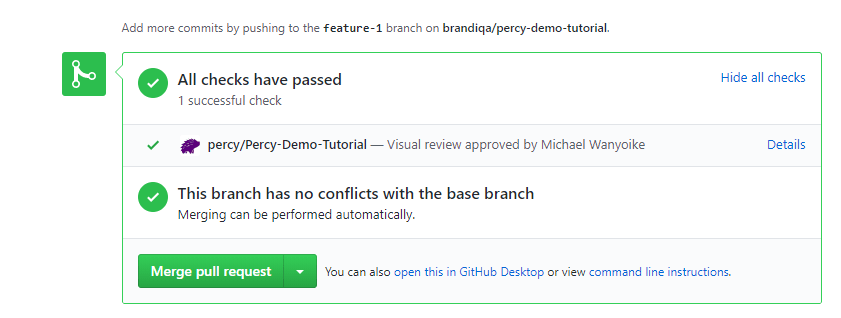
Percy updates the status of pull requests both when changes are detected and when changes are approved. We can now merge the PR. The final step is going back to the master branch, updating it, and running the visual test build again:
git checkout master
git pull
npx percy exec -- node snapshots.js
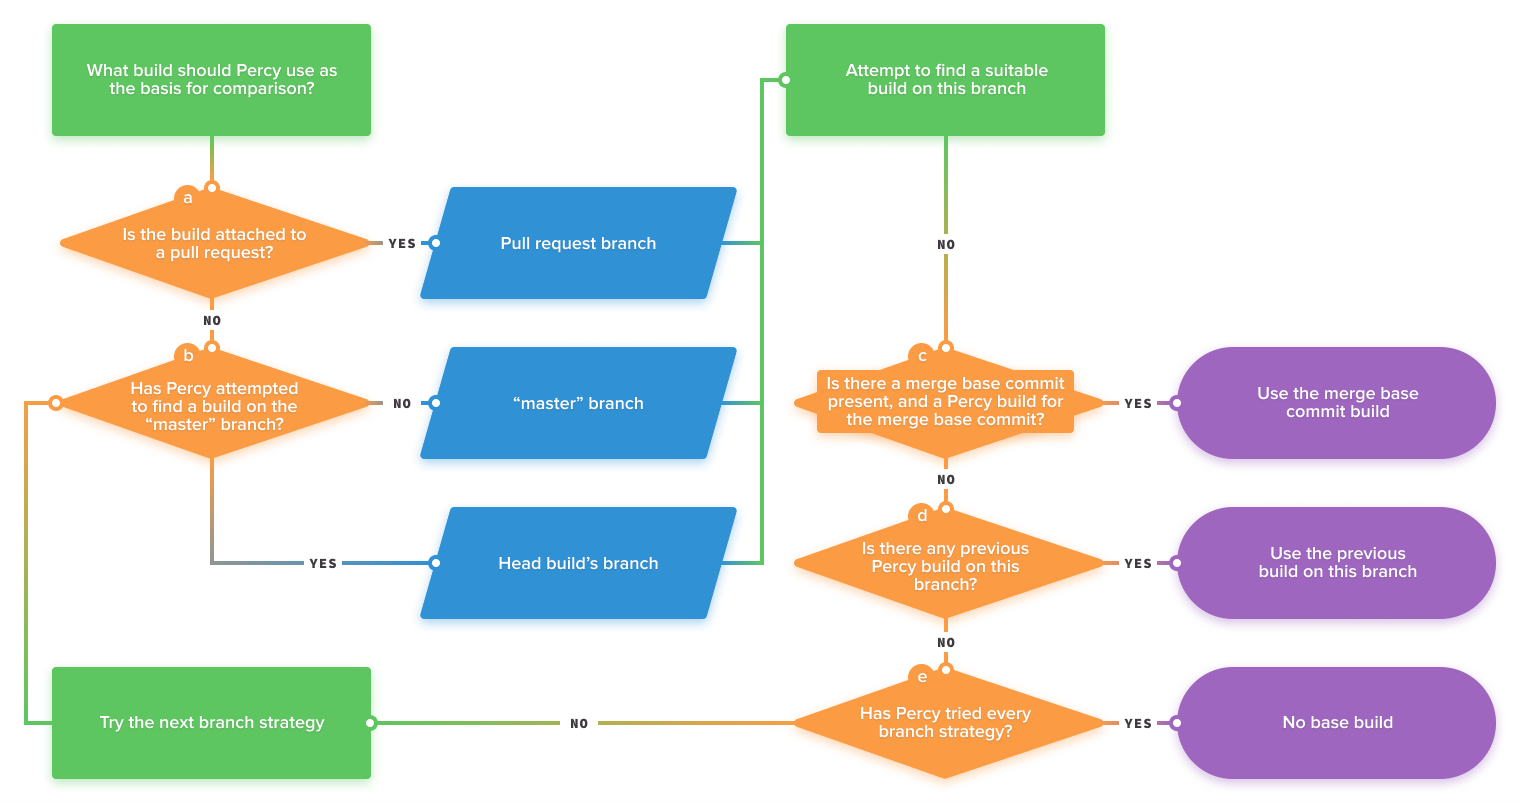
Building the visual test on the master branch again is necessary so that future tests will use this build as the baseline. Here’s an illustration of how baselines are picked:
Running visual tests every time we push a commit or merge branches is tedious. The good news is that we can automate this process by using a Continuous Integration platform. Running tests locally is great while you’re getting started, but Percy is designed to be part of the automated testing kicked off by your CI platform. Percy supports several:
- AppVeyor
- Azure Pipelines
- Buildkite
- CircleCI
- CodeShip
- Drone
- GitLab CI
- Jenkins
- Semaphore
- Travis CI
You can also host your own CI/CD server on your local network; Percy supports that too. If your preferred solution is not on the list, you can chat with Percy support or your CI/CD provider to get set up.
SDK Integration
Before we conclude, I’d like to mention that there are a number of SDKs that allow you to use an existing framework to generate Percy snapshots. For example, if you’re using Cypress, you use the Percy/Cypress SDK to leverage your existing suite for visual testing. Here’s an example of how we can use Cypress to generate Percy snapshots:
describe('CurrencySPA', () => {

    beforeEach(() => {
        cy.server();
        cy.route('GET', '/api/rates', 'fixture:rates.json'); // Mock Daily Rates Response

        cy.visit('localhost:3000');
    })

    it('Loads Daily Rates', () => {
        cy.get('#app > h1').should('have.text', 'Currency Rates'); // Confirm Page Header Title
        cy.get('.loading').should('not.be.visible');
        cy.get('tbody>tr').eq(0).should('contain', 'EUR');
        cy.get('tbody>tr').eq(1).should('contain', '1.12805');
        cy.percySnapshot();
    });

    it('Convert Currency', () => {
        cy.route('POST', '/api/convert', { // Mock Convert Currency Response
            "rate": 10244.442
        });
        cy.get('.menu > a:nth-child(3)').click(); // Click Exchange Rates Menu
        cy.get('#app > h1').should('have.text', 'Exchange Rate'); // Confirm Page Header Title
        cy.get('.loading').should('not.be.visible');
        cy.get('#from').select('BTC');
        cy.get('#to').select('USD');
        cy.get('#amount').type('1');
        cy.get('.submit').click();
        cy.get('#result').should('have.text', 'USD 10244.442');
        cy.percySnapshot();
    });

    it('Loads Historical Rates', () => {
        cy.get('.menu > a:nth-child(4)').click(); // Click Historicals Rates Menu
        cy.get('#app > h1').should('have.text', 'Historical Rates'); // Confirm Page Header Title
        cy.get('#date')
            .type('2019-07-02') // Will revert to 2019-07-01 (known bug)
            .blur();
        cy.get('.submit').click();
        cy.get('table').should('be.visible');
        cy.percySnapshot();
    });
});
Pretty neat, right?
There are also other end-to-end testing integrations that Percy supports. For a complete list of integrations, you should check out Percy’s SDK page. You can also build your own SDK if there’s no alternative for the technology you’re using.
Summary
I hope you’re now confident in your ability to implement visual testing. In this tutorial, we walked through a simple feature change wherein the visual changes were intended, but you can imagine that visual testing helps catch unintended visual changes as well.
In both cases, visual testing provides a level of UI coverage not possible with functional tests, and with Percy’s workflow, you can get that coverage on every pull request.
With visual testing technology, you can now truly have 100% test coverage for your projects. While not a guarantee that issues won’t slip by, Percy will greatly reduce your team’s risk of releasing products to end-users with defects.
Frequently Asked Questions (FAQs) about Visual Testing with Percy
What is visual testing and why is it important?
Visual testing is a quality assurance activity that is aimed at verifying the graphical user interface of a web application appears correctly to users. It involves the process of validating the visual aspects of an application such as layout, design, and responsive UI elements. This is important because even a minor visual glitch can significantly impact the user experience, leading to loss of customers or users. Visual testing helps to catch such issues early in the development cycle, reducing the cost and time of fixing them.
How does Percy help in visual testing?
Percy is a visual testing tool that helps developers automate the process of visual testing. It takes screenshots of your web pages and compares them with the baseline images to identify any visual changes or discrepancies. This helps in catching visual bugs that might have been missed during manual testing. Percy also integrates with your existing test suite and CI/CD pipeline, making it easy to incorporate visual testing into your development workflow.
What are the key features of Percy?
Percy offers several key features that make visual testing efficient and effective. These include parallelization, which allows you to run multiple tests simultaneously, reducing the overall testing time. It also provides a visual review platform where you can see the visual changes, approve or reject them. Percy supports various testing frameworks and languages, and it integrates with popular CI/CD tools. Moreover, it offers responsive testing, allowing you to test your application on different screen sizes and resolutions.
How does Percy compare to other visual testing tools?
Percy stands out from other visual testing tools due to its ease of use, comprehensive feature set, and seamless integration with various development tools. It supports a wide range of testing frameworks and languages, making it versatile for different development environments. Its parallelization feature allows for faster testing, and its visual review platform makes it easy to identify and address visual changes. However, the choice of a visual testing tool may depend on specific project requirements and the development environment.
How to integrate Percy with my existing test suite?
Percy provides SDKs for various testing frameworks and languages, making it easy to integrate with your existing test suite. You just need to install the Percy SDK for your testing framework, and then you can add Percy snapshots to your tests. When you run your tests, Percy will capture screenshots and upload them for visual comparison. It also provides detailed documentation and guides to help you with the integration process.
Can I use Percy for responsive testing?
Yes, Percy supports responsive testing. You can specify different screen widths for your Percy snapshots, and it will capture screenshots at those widths. This allows you to test how your application looks and behaves on different screen sizes and resolutions, ensuring a consistent user experience across all devices.
What is parallelization in Percy?
Parallelization in Percy allows you to run multiple visual tests simultaneously. This can significantly reduce the overall testing time, especially for large applications with many pages. When you run your tests in parallel, Percy will capture screenshots from all tests at the same time and then compare them with the baseline images.
How does Percy handle dynamic content?
Percy has a feature called “Percy Freeze” that freezes the state of your application at the time of snapshot. This ensures that dynamic content such as animations, timestamps, or any other content that changes over time does not cause false positives in visual comparisons.
How does Percy’s visual review platform work?
Percy’s visual review platform provides a user-friendly interface where you can see all the visual changes detected by Percy. It highlights the changes in a side-by-side comparison of the new and baseline images. You can approve or reject the changes directly from the platform. This makes it easy to review and manage visual changes, ensuring that only the intended changes are deployed.
Is Percy suitable for my project?
Percy is a versatile visual testing tool that can be used for projects of all sizes and complexities. It supports various testing frameworks and languages, and it integrates with popular CI/CD tools. Whether you are developing a small website or a large web application, Percy can help you ensure a consistent and high-quality user interface. However, the suitability of Percy for your project may also depend on your specific testing requirements and development environment.
 Michael Wanyoike
I write clean, readable and modular code. I love learning new technologies that bring efficiencies and increased productivity to my workflow.