The series so far:
- Reporting Services Basics: Overview and Installation
- Reporting Services Basics: Creating Your First Report
- Reporting Services Basics: Data Sources and Datasets
- Reporting Services Basics: Parameters
- Reporting Services Basics: Adding Groups to Reports
Adding parameters is one of the essential skills to learn when you are new to SSRS. Parameters give end-users the ability to change the filter of the report on-the-fly. Imagine creating a separate report for every sales year or every department. Even worse, imagine creating a report for every combination of years and departments! With parameters, you can create one report that will work for any combination of these variables.
Starting with the Product List Report
To demonstrate parameters, this article will use the list of products found in the AdventureWorks database. To get started, create a new Report Server Project called Parameters with a shared data source. (See previous articles in this series if you need help understanding how to work with projects, data sources, or datasets.) Add a report named Product List with this embedded dataset:
|
1 2 3 4 5 6 7 |
SELECT P.ProductID, P.Name AS ProductName, P.Color, P.Size, P.ListPrice, PC.Name AS Category, PS.Name AS SubCategory FROM Production.Product AS P JOIN Production.ProductSubcategory AS PS ON PS.ProductSubcategoryID = P.ProductSubcategoryID JOIN Production.ProductCategory AS PC ON PC.ProductCategoryID = PS.ProductCategoryID; |
Your Solution Explorer should look like Figure 1.
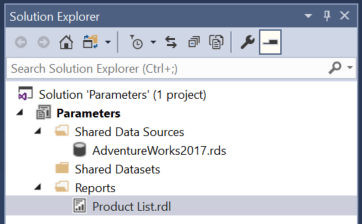
Figure 1: The Solution Explorer
Your Report Data window should look like Figure 2.
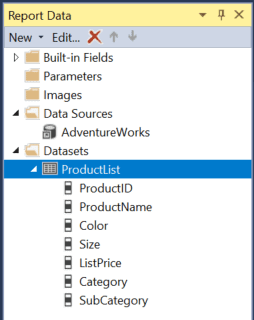
Figure 2: The Report Data window
Add a Table control to the report’s canvas and add these fields to the Data row.
- ProductID
- ProductName
- Color
- Size
- ListPrice
The table on the report will look like Figure 3.
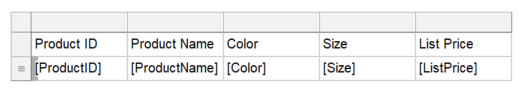
Figure 3: The table
Preview the report to make sure it works at this point. It should look something like Figure 4.
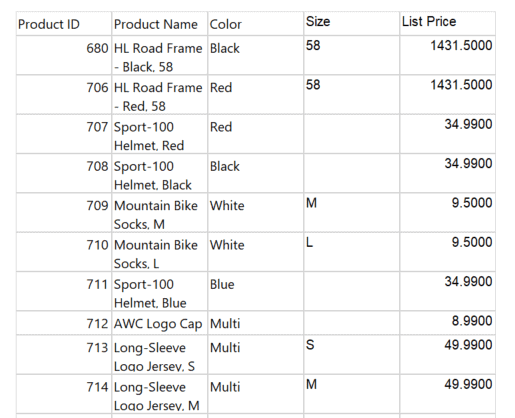
Figure 4: The report in Preview mode
Spend some time formatting the report. This is not required for learning about parameters, but if you are like me, the unformatted report is quite annoying! Your report might look something like Figure 5 when you are done.
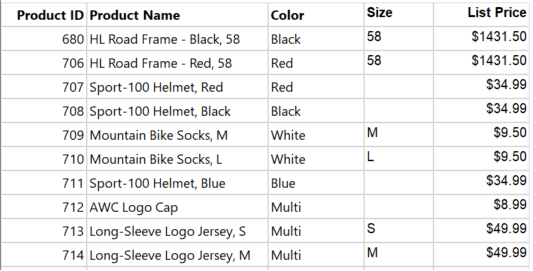
Figure 5: The formatted report
The wizard report from the first article had a header, but you didn’t learn how to add a header to a new report. To do so, make sure that the report is in Design view. Select the report canvas, which makes the Report menu show up in the menu bar. Select Report Add Page Header, as shown in Figure 6. Also, add a page footer.
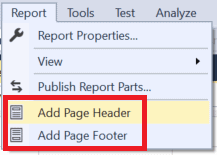
Figure 6: Add a page header and footer
Move the table so that it is close to the header and the left of the page. Also, drag the top of the footer to the bottom of the table. Drag the right side of the canvas to the table. The canvas should look like Figure 7.
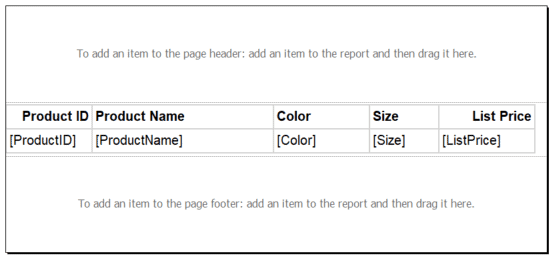
Figure 7: The canvas with header and footer
In the Report Data window, expand Built-in Fields. Drag the Report Name field into the page header, as shown in Figure 8.
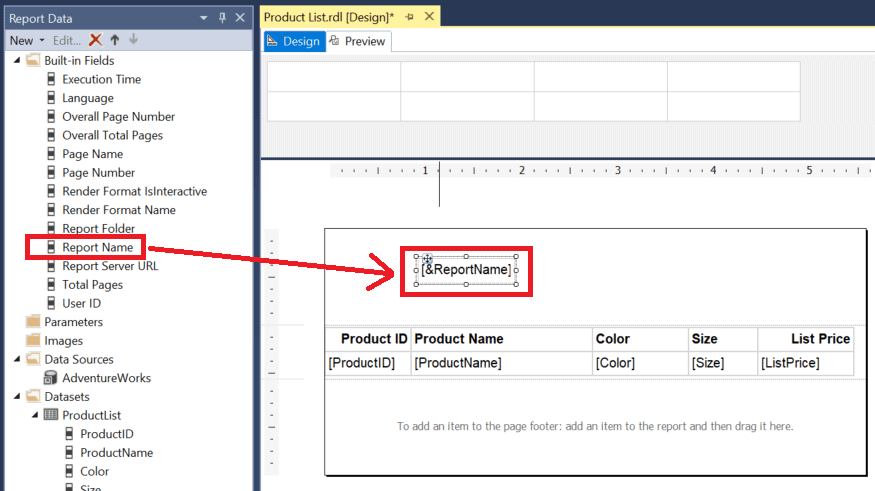
Figure 8: Drag the Report Name
Expand the textbox width to the size of the canvas. Increase the font size to 22 and align the text in the centre. You can also drag Execution Time and Page Number to the footer. (Note that you may need to expand the are under the table where you can temporarily drag the first footer item before adding it to the footer.) The report canvas should now look like Figure 9.
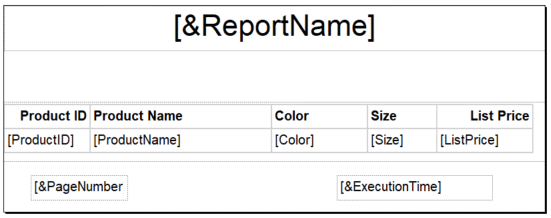
Figure 9: Formatted header and footer
Adding Simple Parameters
SSRS will automatically add parameters to your report when you have variables in the WHERE clause of the query. In this case, you’ll add a parameter to filter on color. Double-click the dataset and change the query to this:
|
1 2 3 4 5 6 7 8 |
SELECT P.ProductID, P.Name AS ProductName, P.Color, P.Size, P.ListPrice, PC.Name AS Category, PS.Name AS SubCategory FROM Production.Product AS P JOIN Production.ProductSubcategory AS PS ON PS.ProductSubcategoryID = P.ProductSubcategoryID JOIN Production.ProductCategory AS PC ON PC.ProductCategoryID = PS.ProductCategoryID WHERE P.Color = @color; |
Click OK, and you’ll see the new parameter @color listed in the Parameters folder and the Parameters section of the report canvas, as shown in Figure 10.
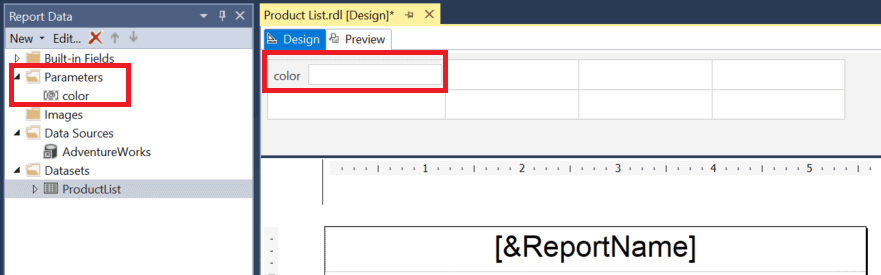
Figure 10: The @color parameter
Preview the report. This time, it will not run automatically. Fill in the color “blue” and click View Report. The report should look like Figure 11 with only blue items displayed.
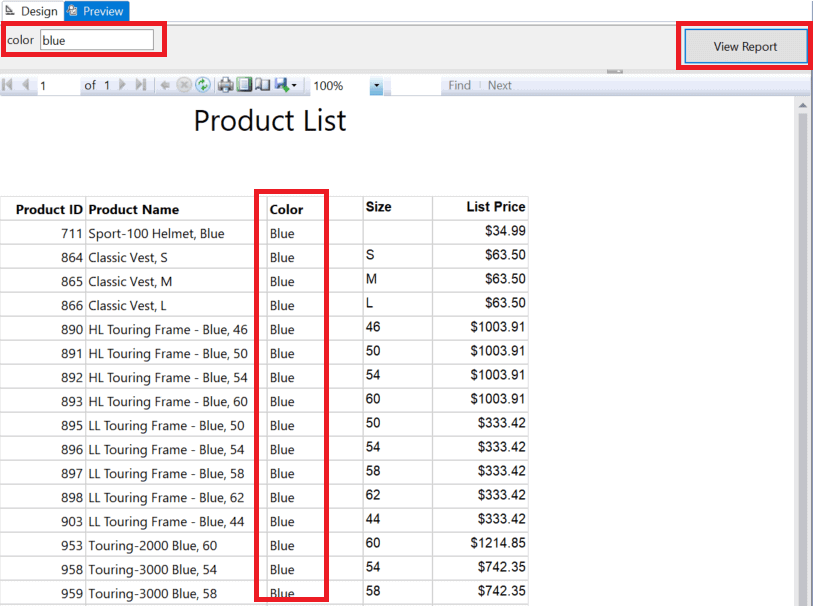
Figure 11: Filtered by blue
Right now, you must type in a valid color to get the report to return products. If you type in “purple,” for example, no products will be returned.
There are quite a few properties you can set to control the behaviour of parameters. You might allow a blank value, for example, or supply a list of values from which to choose. To see the properties, double-click the parameter. The Report Parameter Properties dialogue looks like Figure 12.
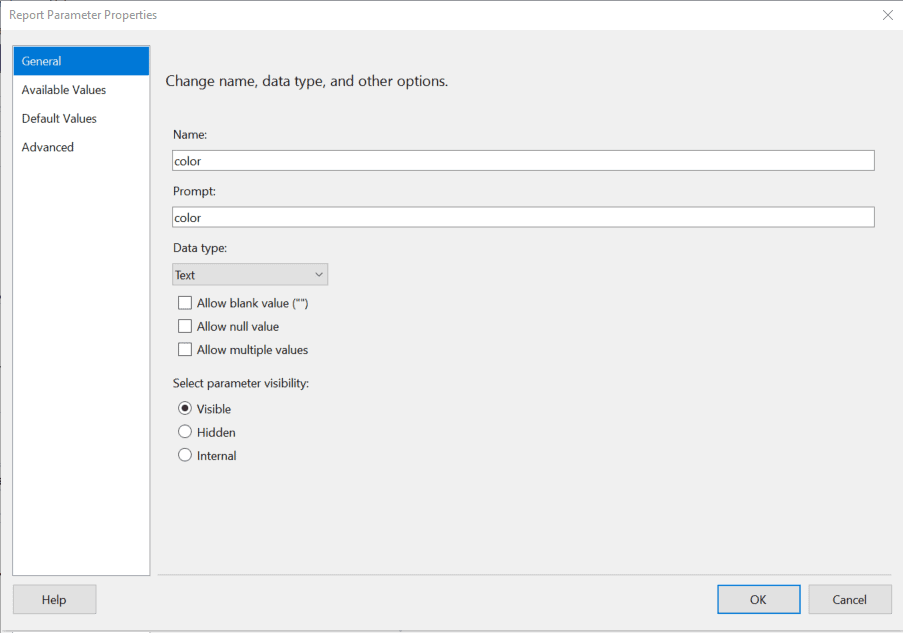
Figure 12: The parameter properties
There are a few interesting items to note on the General page. For example, what is the difference between Name and Prompt? The Name refers to the actual name of the parameter that is used in the SQL query. The Prompt is what the user will see. So, you might want to change the “c” in color to uppercase make it more user-friendly.
You can change the Data Type if you must restrict the type of values entered, such as numbers or dates. In fact, if you switch to date, the report will display a date picker control for the parameter when you run the report. There are three other options (Allow blank value, Allow null value, and Allow multiple values) that will be covered later in the article. And, finally, there is the visibility property of the parameter. Here is what each option means:
Visible: The parameter is shown to the end-user who can change the value
Hidden: The end-user is not prompted for the parameter, but the value is typically passed in from a calling report
Internal: The end-user is not prompted and cannot change the value. This might be used for passing in the user id to the server.
There are three more pages to this dialogue. This article will cover Available Values and Default Values. Now, you’ll learn how to provide a list of values for the parameter.
Adding a Parameter List
It can be difficult for the user to remember the valid values for a report, so report developers often provide lists of values from which to choose. To provide a list of colors, follow these steps.
Switch to the parameter’s Available Values page. Currently, the option is set to None, as shown in Figure 13, which means that no list is provided.
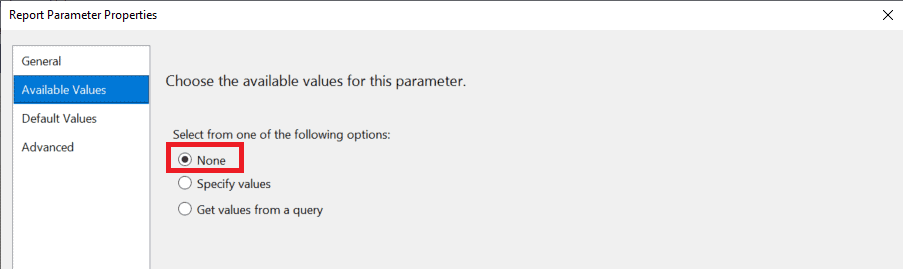
Figure 13: The Available Values page
Switch to Specify values and click Add. You’ll now have a space to type in the first value, as shown in Figure 14.
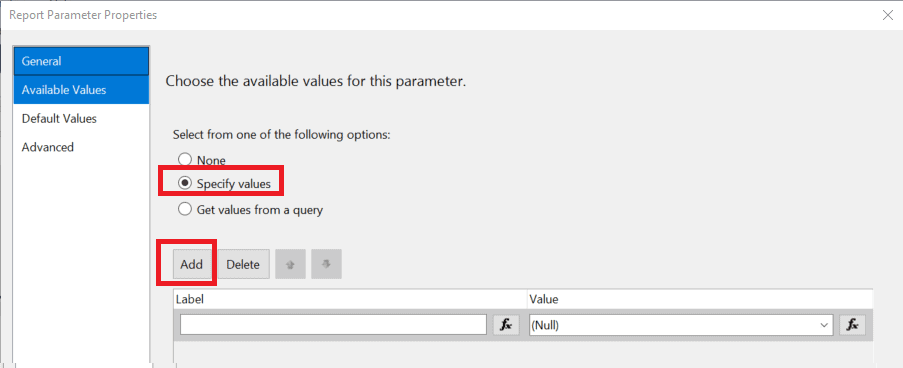
Figure 14: Type in values
The Label is shown to the end-user, while the Value is passed to the SQL query. In this case, both values are the same. Enter the following list:
- Black
- Blue
- Grey
- Multi
- Red
- Silver
- Silver/Black
- White
- Yellow
The screen should look like Figure 15 when you are done. Click OK to save the list.
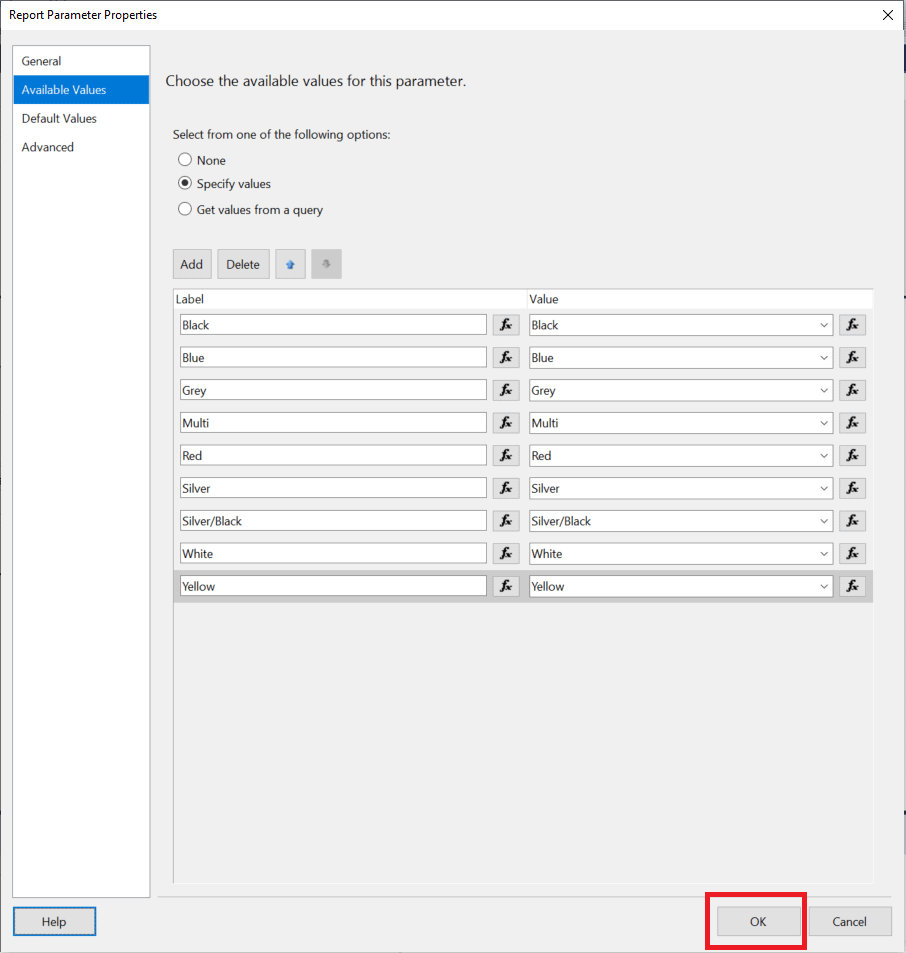
Figure 15: The parameter list
Now when you preview the report, you’ll see a list of colors from which to choose, as shown in Figure 16.
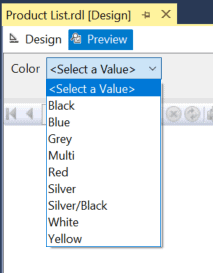
Figure 16: The parameter with the list
Try running the report multiple times, each time with a different color to verify that the report works as expected.
If you are familiar with this data, you’ll know that there are several products with no color (NULL). How can you allow a user to see those products? You’ll learn that next.
Searching for NULL values
You may recall that there is a parameter option to allow NULL (see Figure 12), but to use this option, you must make a change to your query that causes other complications later. It gets messy quickly, so I suggest substituting the NULLs instead.
To get started, add another item to the available values in the Color parameter, N/A for both Value and Label. Double-click the ProductList dataset and change the query to this:
|
1 2 3 4 5 6 7 8 |
SELECT P.ProductID, P.Name AS ProductName, P.Color, P.Size, P.ListPrice, PC.Name AS Category, PS.Name AS SubCategory FROM Production.Product AS P JOIN Production.ProductSubcategory AS PS ON PS.ProductSubcategoryID = P.ProductSubcategoryID JOIN Production.ProductCategory AS PC ON PC.ProductCategoryID = PS.ProductCategoryID WHERE COALESCE(P.Color,'N/A') = @color; |
When you rerun the report and select N/A, you should see all the items with no color. So far, you are working with a static parameter list. Now, you’ll learn how to create a dynamic list. Note that using a function like COALESCE on a column in the WHERE clause can often cause performance issues.
Using a Query for a Parameter List
What happens if AdventureWorks gets in a new purple or orange product? You would have to manually add those colors to keep the parameter list up to date. Instead, you might want to maintain the list using a query. To do so, switch back to Design view add a new Dataset called Colors to the report with this query that causes the N/A row to show up first.
|
1 2 3 4 |
SELECT DISTINCT COALESCE(Color,'N/A') AS Color, CASE WHEN Color IS NULL THEN 0 ELSE 1 END AS SortOrder FROM Production.Product AS P ORDER BY SortOrder, Color; |
Figure 17 shows how the dataset should look.
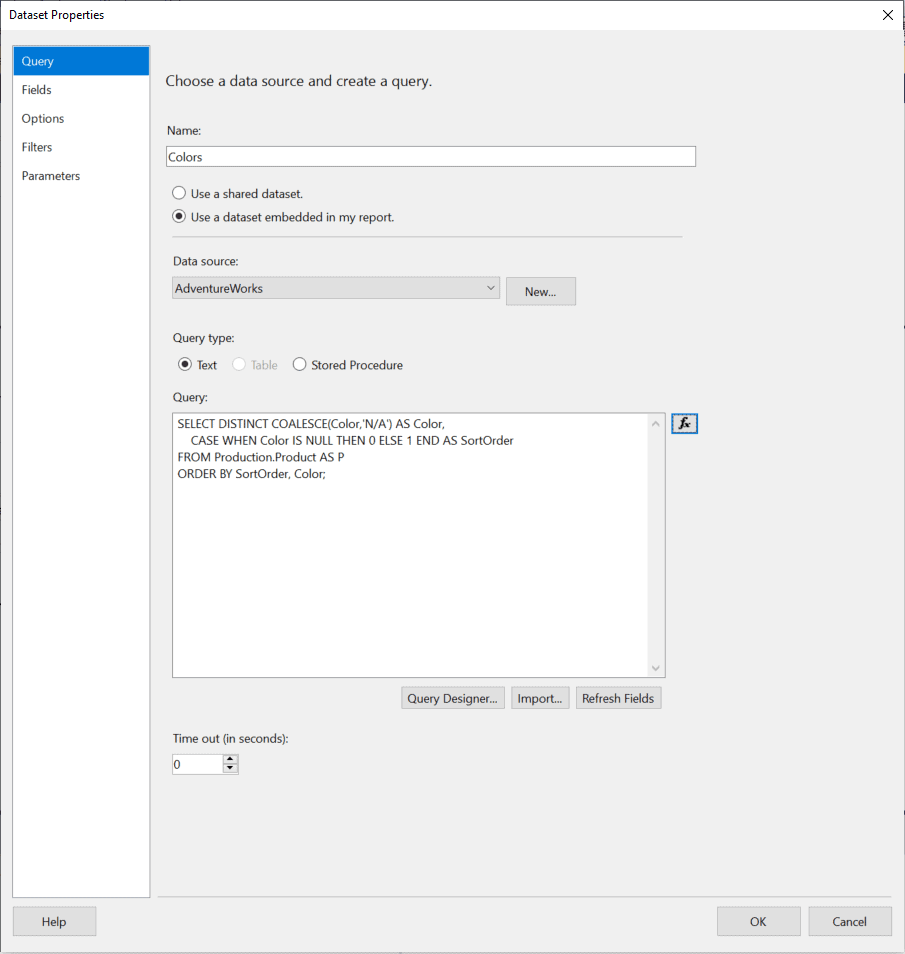
Figure 17: The Colors dataset
Click OK to create the dataset. Now open the parameter properties again and switch to the Available Values page. Select Get values from a query. Under Dataset, select Colors. In both the Values and Labels field, select Color. The properties should look like Figure 18.
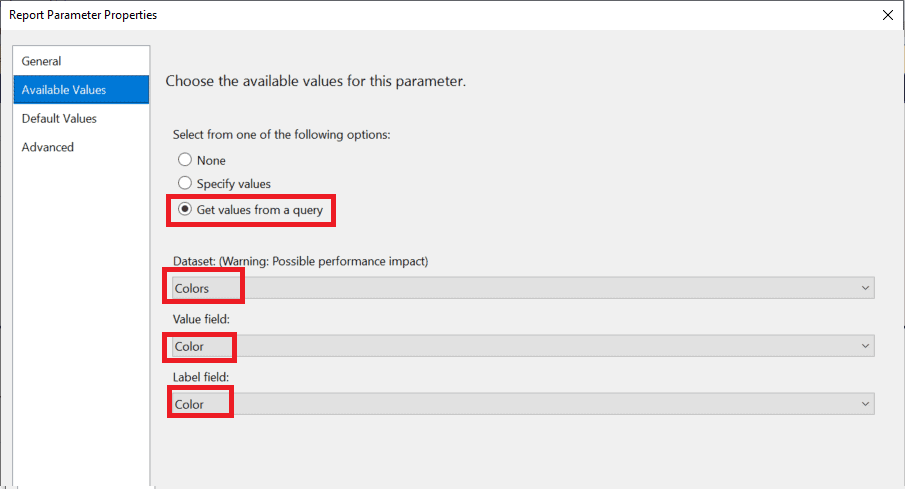
Figure 18: Using a query for the parameter list
Click OK to save the change and be sure to test the report. If you don’t mind modifying a row of the Product table, run this update statement in SSMS or Azure Data Studio.
|
1 2 3 |
UPDATE Production.Product SET Color = 'Orange' WHERE ProductID IN (802, 803); |
If you rerun the report, you should see Orange in the parameter list and the orange items in the results. Figure 19 shows the report.
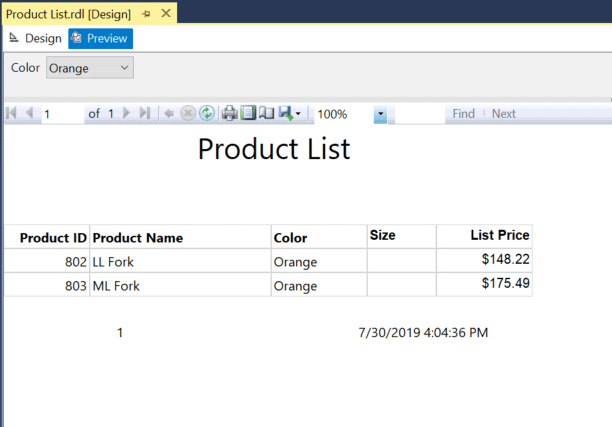
Figure 19: The orange items
You might want to give the ability to select multiple items at once. The next section will show you how to do that.
Selecting Multiple Values
The person running your report might want to see more than one color at a time, maybe even all of them. There is a setting on the General page of the parameter properties (see Figure 12) that allows you to select more than one item. If you do this, however, your query will error, and the report will not run. Figure 20 shows the error message:
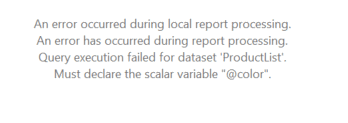
Figure 20: The error message after setting Allow multiple values.
The query sent to SQL Server uses = (equal to), but the variable holds a comma-delimited list of values. To fix this issue, you’ll need to modify the ProductList query to this:
|
1 2 3 4 5 6 7 8 |
SELECT P.ProductID, P.Name AS ProductName, P.Color, P.Size, P.ListPrice, PC.Name AS Category, PS.Name AS SubCategory FROM Production.Product AS P JOIN Production.ProductSubcategory AS PS ON PS.ProductSubcategoryID = P.ProductSubcategoryID JOIN Production.ProductCategory AS PC ON PC.ProductCategoryID = PS.ProductCategoryID WHERE COALESCE(P.Color,'N/A') IN (@color); |
After running, the report should look something like Figure 21 when Multi and Orange are selected.
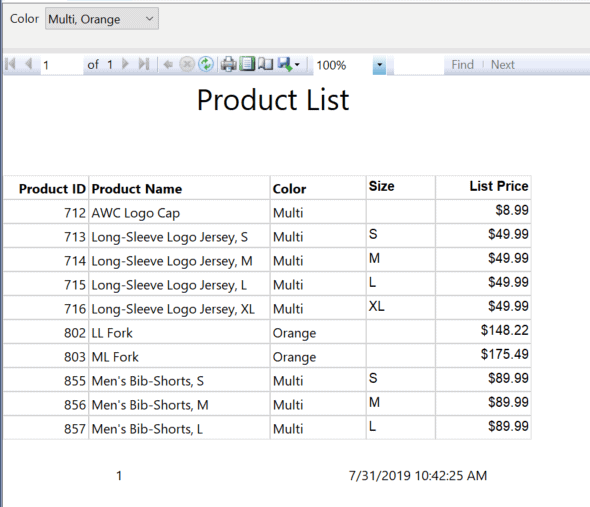
Figure 21: Selecting multiple values
So far, you have added just one parameter to the report. Many of the reports you run in the future will have more than that. Either the dataset will have multiple predicates in the WHERE clause, or you might also use parameters to control something about how the report looks. In the next section, you’ll learn how to control the value of a textbox in the report with a parameter.
Displaying Parameter Values on the Report
Parameters are the “workhorse” of SSRS. You can do so many things with them. In this section, you’ll learn that you can display the value or label of a parameter in a textbox.
Back in Design view, add a Textbox to the header section of the report. Drag it to the left of the page and expand the width. It should look like Figure 22.
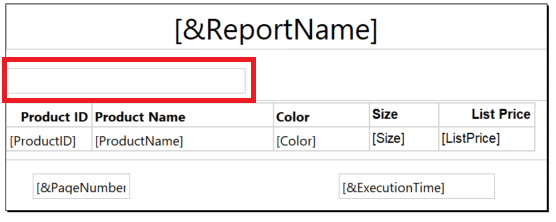
Figure 22: The new Textbox
Right-click on the new Textbox and select Expression, as shown in Figure 23.
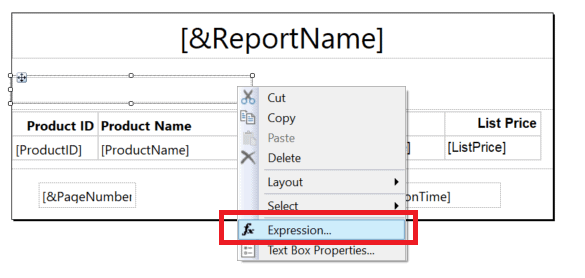
Figure 23: Select Expression
Just about any property in an SSRS report can be controlled with an Expression, i.e., a formula. You’ll learn much more about expressions throughout these articles, but this is a simple example to get you started. Once you select Expression in the menu, the Expression dialogue should pop up, as shown in Figure 24.
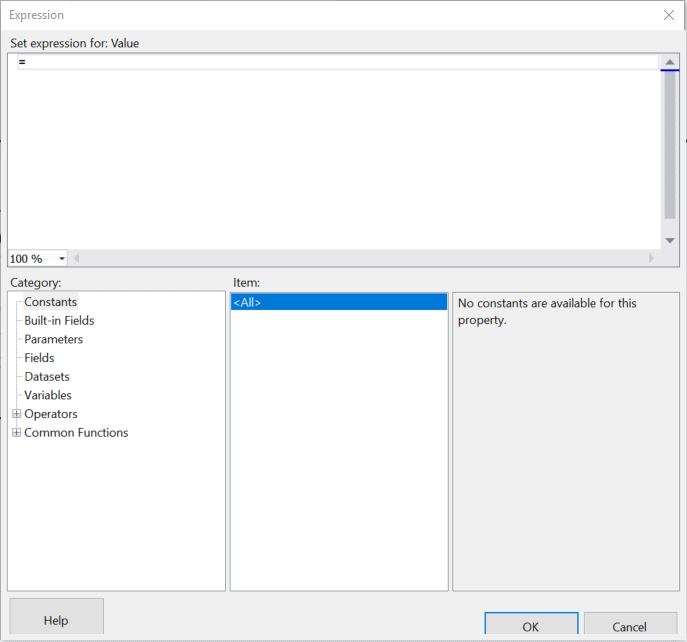
Figure 24: The Expression dialogue
Any expression begins with an equal to sign (=) similar to formulas in Excel. The Category area contains dozens of built-in fields and functions that you can use to build these expressions. Change the expression to
|
1 |
="Colors chosen: " + |
Then, make sure your cursor is to the right of the plus sign (+), click Parameters and double-click color in the Values window, as shown in Figure 25.
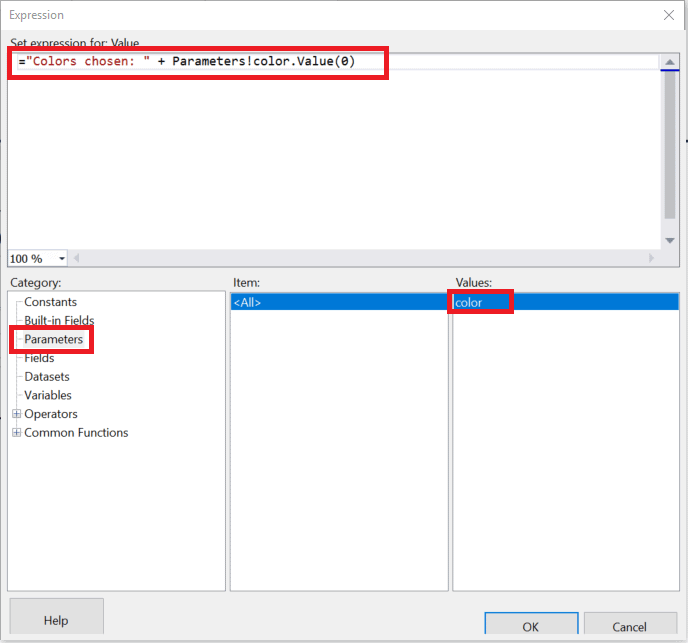
Figure 25: The expression
The final expression should be:
|
1 |
="Colors chosen: " + Parameters!color.Value(0) |
Click OK to save the expression. The Textbox will show <<Expr>> instead of a field name. Run the report but select only one color. The report should look like Figure 26 if you selected Orange. The value you chose is visible on the report.
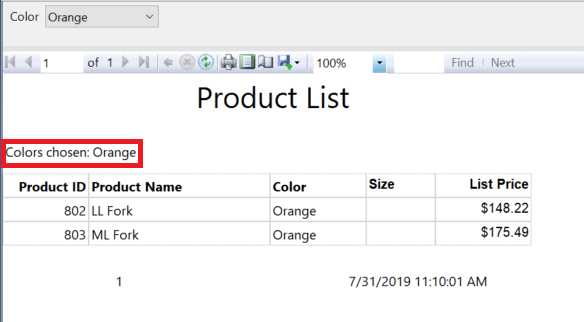
Figure 26: The parameter value displayed
This works great, but it will only display one item. It’s possible that you are allowing multiple values to be selected. When you select more than one, only the first item is displayed. The reason is that the parameter values are held in an array of strings. Right now, the formula displays the first item in the array.
To display all the chosen values, go back to Design view and bring up the Expression dialogue again. Change the formula to this:
|
1 |
="Colors chosen: " + Join(Parameters!color.Value,", ") |
Notice that the index of the array (0) was removed. The Join function builds a string from the array values. Now when you run the report, it will look something like Figure 27.
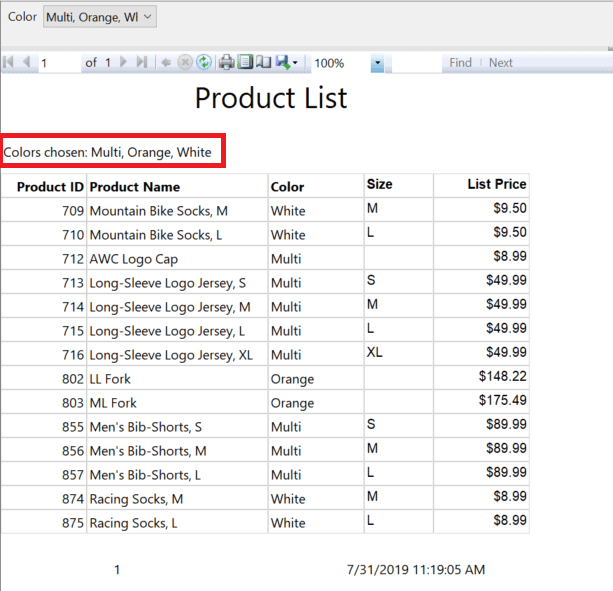
Figure 27: Displaying multiple values
In this example, the Values and Labels of the parameter are identical. In many cases, they are different. For example, the query might need an ID number while the person running the report might like to see the name. To get around this, change the formula so that the user-friendly label is used instead of the value:
|
1 |
="Colors chosen: " + Join(Parameters!color.Label,", ") |
You can also use parameters to change the properties of objects on the report. You’ll learn how to do this next.
Using Parameters to Control Properties
Just about any property in SSRS can be controlled with an expression. If you take a look at the Text Box Properties dialogue of the Textbox you created in the last section, you’ll see the fx symbol next to two properties, as shown in Figure 28.
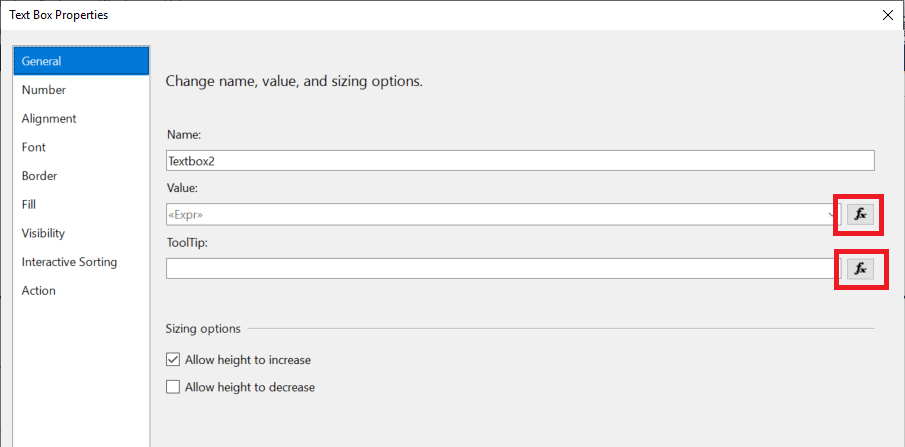
Figure 28: The fx symbol
Clicking this symbol anywhere you see it brings up the Expression box to control the associated property. Before adding in an expression, cancel out of this dialogue. Create a new parameter called Background by right-clicking the Parameters folder and selecting Add Parameter. Add these values/labels on the Available Values page.
- Yellow
- LightBlue
- Plum
Once all the parameter properties are in place, click OK. You’ll then see the second parameter in the list of parameters. Remember that this one isn’t connected to a dataset query; it will be used to control the background, or fill, color of the Textbox.
The next step is to connect the parameter to the Textbox. Right-click and select Text Box Properties. Select the Fill page. Click the fx symbol, as shown in Figure 29.
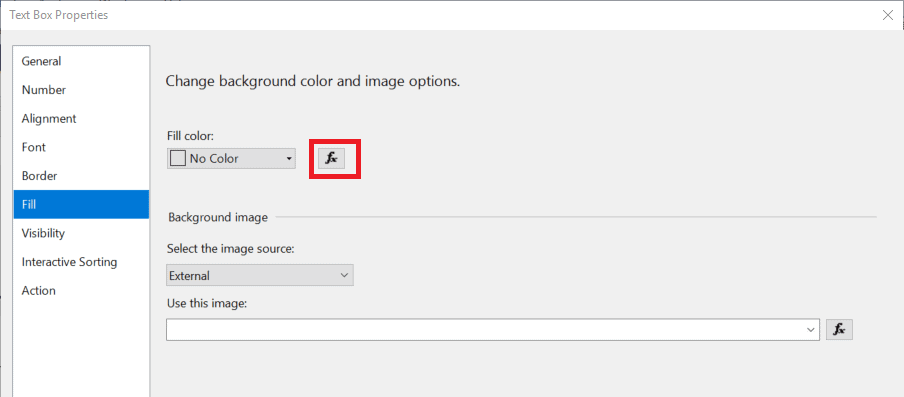
Figure 29: The Fill property
The initial expression is “No Color.” Replace it with this formula:
|
1 |
=Parameters!Background.Value |
The Expression dialogue should look like Figure 30.
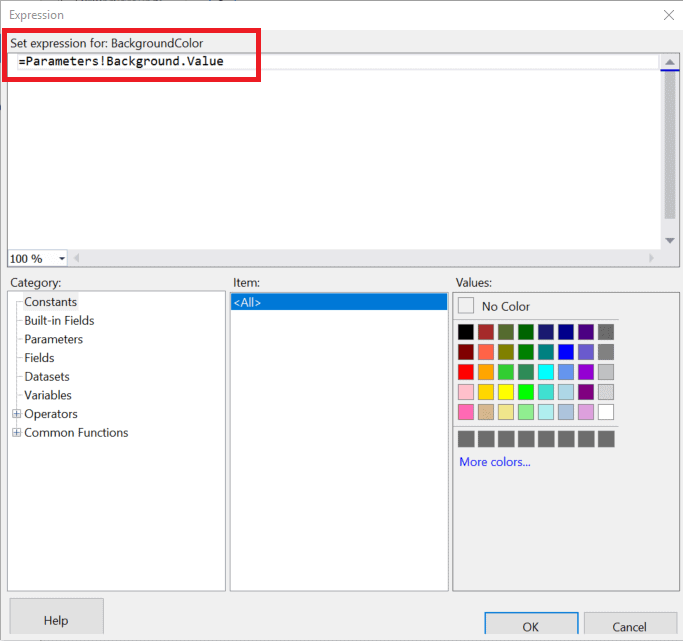
Figure 30: The background expression
Click OK twice to save the property change. Now, try running the report. If you chose LightBlue, the report should look something like Figure 31.
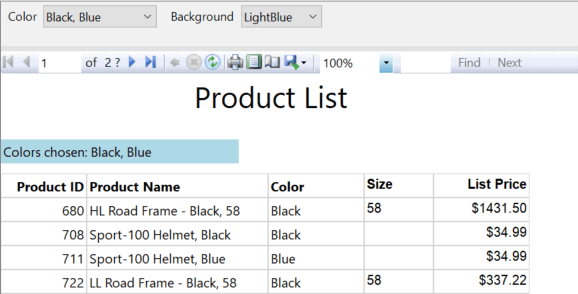
Figure 31: The textbox with a blue background
This simple example demonstrated how powerful expressions and parameters are. Next, you’ll see how to set default values for parameters.
Using Default Parameters
In some cases, the user is likely to select a specific value for a parameter and only rarely change it. To learn how to set up a default value for the parameter, open the properties of the Background parameter. Select the Default Values page and Specify values, as shown in Figure 32.
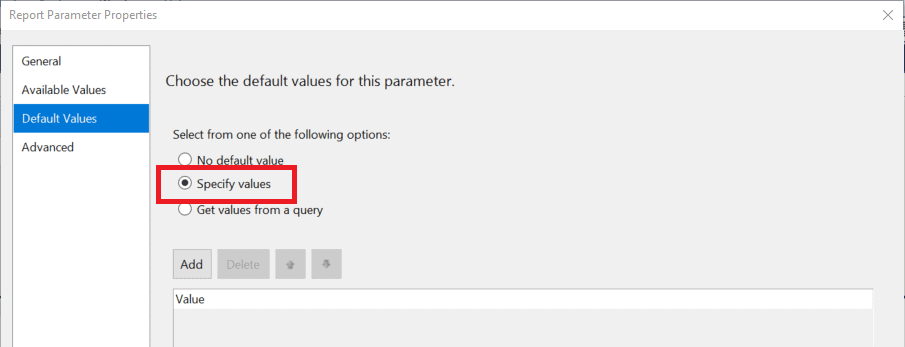
Figure 32: The Default Values page
Click Add. Type in your favourite of the three colors, LightBlue, Plum, or Yellow. The property should look like Figure 33. Click OK to save the changes.
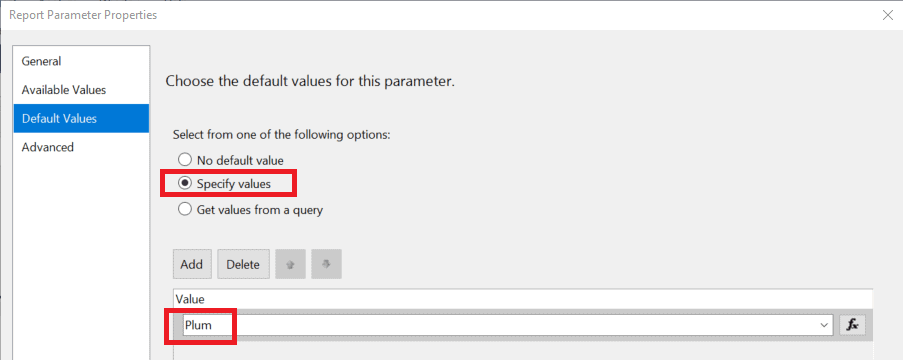
Figure 33: Filling in the default value
Now when you run the report, the background color will be automatically filled in. You can also get default values from a dataset. Open the Default Values properties of the color parameter. Select Get values from a query. Fill in the Colors Dataset and Color Value field. The properties should look like Figure 34.
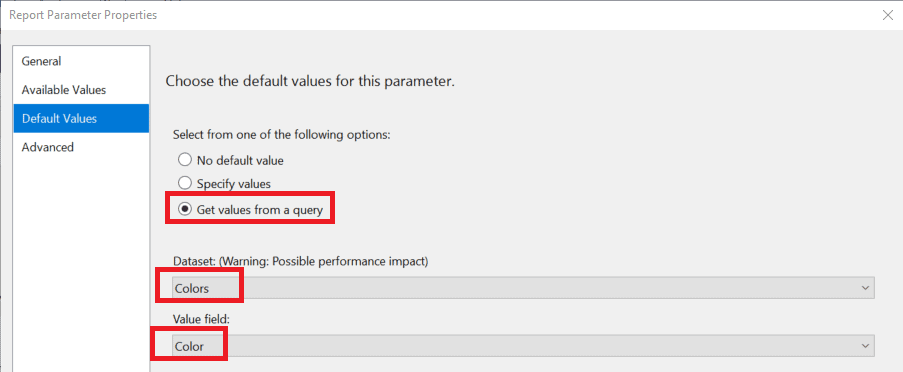
Figure 34: The default values from a dataset
In this case, all colors will be selected when you run the report.
One of the most common requests is to make the selection of one parameter filter another one. You’ll learn how to do that next.
Creating Cascading Parameters
Each product belongs to a subcategory, and each subcategory belongs to a category. This is the type of hierarchical relationship that works well when parameters work together with what’s called Cascading Parameters. Figure 35 illustrates how this will work.
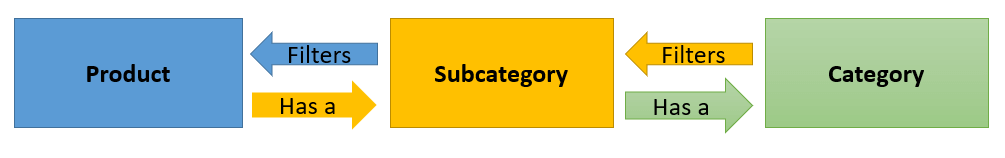
Figure 35: The product/category hierarchy
The first step is to modify the ProductList dataset query so that it prompts for the subcategory. Change the query to this:
|
1 2 3 4 5 6 7 8 9 |
SELECT P.ProductID, P.Name AS ProductName, P.Color, P.Size, P.ListPrice, PC.Name AS Category, PS.Name AS SubCategory FROM Production.Product AS P JOIN Production.ProductSubcategory AS PS ON PS.ProductSubcategoryID = P.ProductSubcategoryID JOIN Production.ProductCategory AS PC ON PC.ProductCategoryID = PS.ProductCategoryID WHERE COALESCE(P.Color,'N/A') IN (@color) AND P.ProductSubcategoryID = @subcategory; |
To make sure that the query works, add the SubCategory and Category fields to the report. Preview the report. Enter subcategory 31. The report should look something like Figure 36.
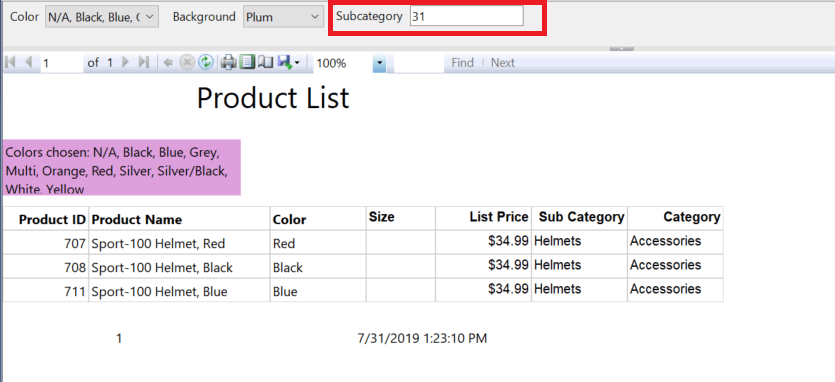
Figure 36: Filtering with subcategory
At this point, the products are being filtered by subcategory, but the ID must be typed in. To get around this issue, add a new dataset called Subcategory with this query:
|
1 2 3 |
SELECT PS.ProductSubcategoryID, PS.Name AS SubcategoryName FROM Production.ProductSubcategory AS PS ORDER BY SubcategoryName; |
Connect the Subcategory dataset to the subcategory parameter. The Values field should be ProductSubcategoryID, and the Label field should be SubcategoryName. In this case, the query needs the ID while the user needs the name. The Available Values properties should look like Figure 37.
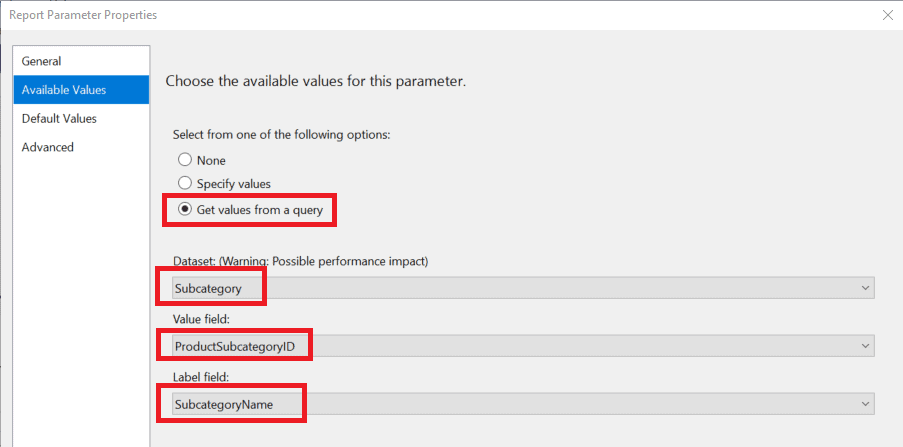
Figure 37: Connect the dataset to the parameter
If you review Figure 35, you’ll see that subcategories should be filtered by category. To do this, change the Subcategory dataset so that it’s filtered by category:
|
1 2 3 4 |
SELECT PS.ProductSubcategoryID, PS.Name AS SubcategoryName FROM Production.ProductSubcategory AS PS WHERE PS.ProductCategoryID = @category ORDER BY SubcategoryName; |
You now have four parameters in place. Notice that Category is listed before Subcategory in Figure 38. That’s because you must choose Category before Subcategory. In this parameter area, you can rearrange the parameters by dragging them around. The report will break if Category is not located before Subcategory!
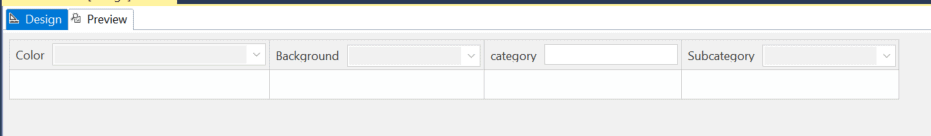
Figure 38: The four parameters
The next logical step is to add a dataset for Category. Use this query:
|
1 2 3 |
SELECT PC.ProductCategoryID, PC.Name AS CategoryName FROM Production.ProductCategory AS PC ORDER BY CategoryName; |
Connect the dataset to the new Category parameter. You guessed it! The Value field is ProductCategoryID, and the Label field is CategoryName. The Available Values page should look like Figure 39.
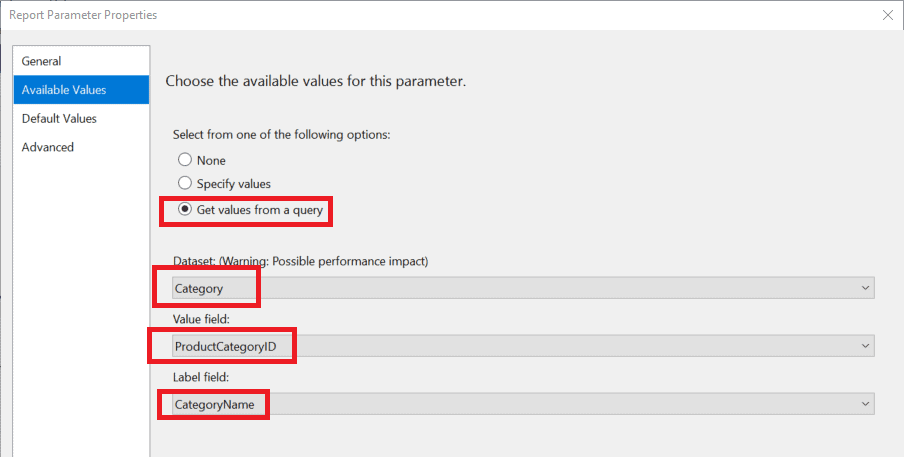
Figure 39: The category Available Values
If you did everything correctly, the parameters should look like Figure 40 when you preview the report. Notice that the Subcategory parameter is greyed out until you select a Category.

Figure 40: The Subcategory parameter is not available
When you select a Category, the Subcategory parameter refreshes. For example, if you select Bikes, only the available bike subcategories show up. Figure 41 shows how this looks.
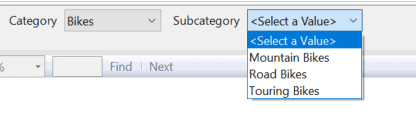
Figure 41: The filtered subcategory
Configuring Cascading Parameters is one of the most challenging things to understand in SSRS. Hopefully, I’ve shown that by breaking the steps down and completing them one at a time, it is doable.
Conclusion
Learning about parameters is critical for SSRS developers. In this article, you learned many ways in which parameters are used, including with a list of available values from a query, multiple selections, defaults, cascading, and more. In the next article, you’ll learn about more features that make SSRS reports dynamic.

Load comments