
The Value in Early Product Analytics
Power in having visibility from the beginning
Product Analytics is an increasingly common discipline across product teams. Often, teams think a product should mature to a particular size or age before bringing in dedicated analytics or ‘data people’. At Square, Product Analytics is often engaged from inception. We find building analytics discipline and bringing data-backed decision-making into each step of a product’s lifecycle sets products up for success as they grow. For the Square for Restaurants product, launched May 2018, a dedicated analytics team was engaged from the early Alpha testing stage on. There are limitations to early stage analytics, but product analytics partners can offer value and guide strategy early in a product’s development.
In addition to building the product itself, Product Teams have a ton of work to do in advance of a launch. The team needs to identify and understand its customer, define success, measure alpha and beta success, and be prepared to respond to feedback and quickly iterate. Product Analytics supported the Square for Restaurants team on all of the above leading up to and immediately after launch, as well as troubleshooting data sources, building early testing discipline, and curating a robust library of event logging.
Understanding the Customer
Product Analytics first supported the Square for Restaurants launch with deep insight into our target merchant. This product is purpose-built to meet the needs of restaurant merchants with features like advanced menu configuration, advanced reporting, table management, coursing, seating, advanced modifiers, item availability (86ing), remote device configuration, and faster order entry. As many of these were brand new features for Square, it was important for the team to combine qualitative interviews and UX research with quantitative understanding of this target customer, to make sure qualitative findings would hold across a larger swath of merchants. The Square for Restaurants Product team was ultimately able to learn and verify valuable insights with our existing merchant pool, as many restaurants had already been using other parts of Square’s ecosystem of products for their business needs, such as Square Payroll, Square Point of Sale, and Caviar.
Product Analytics worked to establish a baseline understanding of how food and beverage merchants were already using Square, particularly the Square Point of Sale. Were they hacking existing features for missing restaurant-specific functionality or leveraging other Square products to unintended ends to make up for gaps? In the case of Square for Restaurants, the answer was definitely yes to both. These were insights we used to inform feature prioritization and our target merchant.
For example, item-level analysis surfaced a trend of merchants stretching category naming and adding dummy divider items to more easily structure a menu on the Point of Sale. This helped inform Square for Restaurants’ approach to menu management and the creation of the Reporting roll-up feature, where merchants save groups of items and categories for reporting purposes. Other merchants added “course” items to divide a check into multiple courses, solidifying the need for a coursing feature that could flex to meet varied needs.
Similarly, Product Analytics found that food and beverage merchants on Square Point of Sale were using our Online Store offering for pick-up and delivery food ordering, as well as creating separate items and categories that provided clean reporting on this revenue stream. This insight helped inform our recently launched work on delivery/pick-up order integration and insertion. Orders from integrated partners can now show up and can be managed in the Point of Sale.
Deep customer understanding can also improve navigation and curation of current offerings. While still in Alpha, Product Analytics completed a K-Means Clustering analysis on Square Dashboard usage among food and beverage merchants. Square Dashboard is where merchants access Square’s extensive reporting tools, can edit and create items, and centrally manage their business. We wanted to understand our target merchants’ usage of these tools, and discovered reporting super-users among existing restaurants. Combined with qualitative feedback, those findings helped inform what we could more immediately surface to make navigating Dashboard easier and quicker for our future Square for Restaurants merchants.
In addition to any internally available data, there are great external, publically available data sources (like census and establishment data) to understand and better meet the needs of your target.
Metric Creation, Defining Adoption, and Goal Setting
Throughout product development, Product Analytics partners offer value by defining and measuring success, and setting goals for features and lifecycle milestones. A critical piece of this work is defining key metrics for each developmental stage. Among other questions, Product Analytics answered or helped to answer the following questions:
- How do you define feature/product adoption per tracked feature?
- What kind of feature adoption can you expect or want?
- How should you structure and source your Alpha and Beta cohorts to ensure the newly built feature set works for a variety of workflows and needs?
- How do you address these questions when serving an audience as diverse as restaurants?
The Square for Restaurants team decided on data-backed product usage goals for each lifecycle stage. During our alpha we focused on platform stability, then shifted focus in beta to scalability and ease of use. The team sourced a variety of restaurant types for beta participants to better ensure our features were tested and used in a variety of configurations, while Product Analytics measured and reported weekly. We did not exit any lifecycle stage until we’d crossed off each usage requirement. For example, we wanted at least 30%+ of merchants leveraging each major feature in beta to ensure fit, usability, and stability before we moved to broader availability.
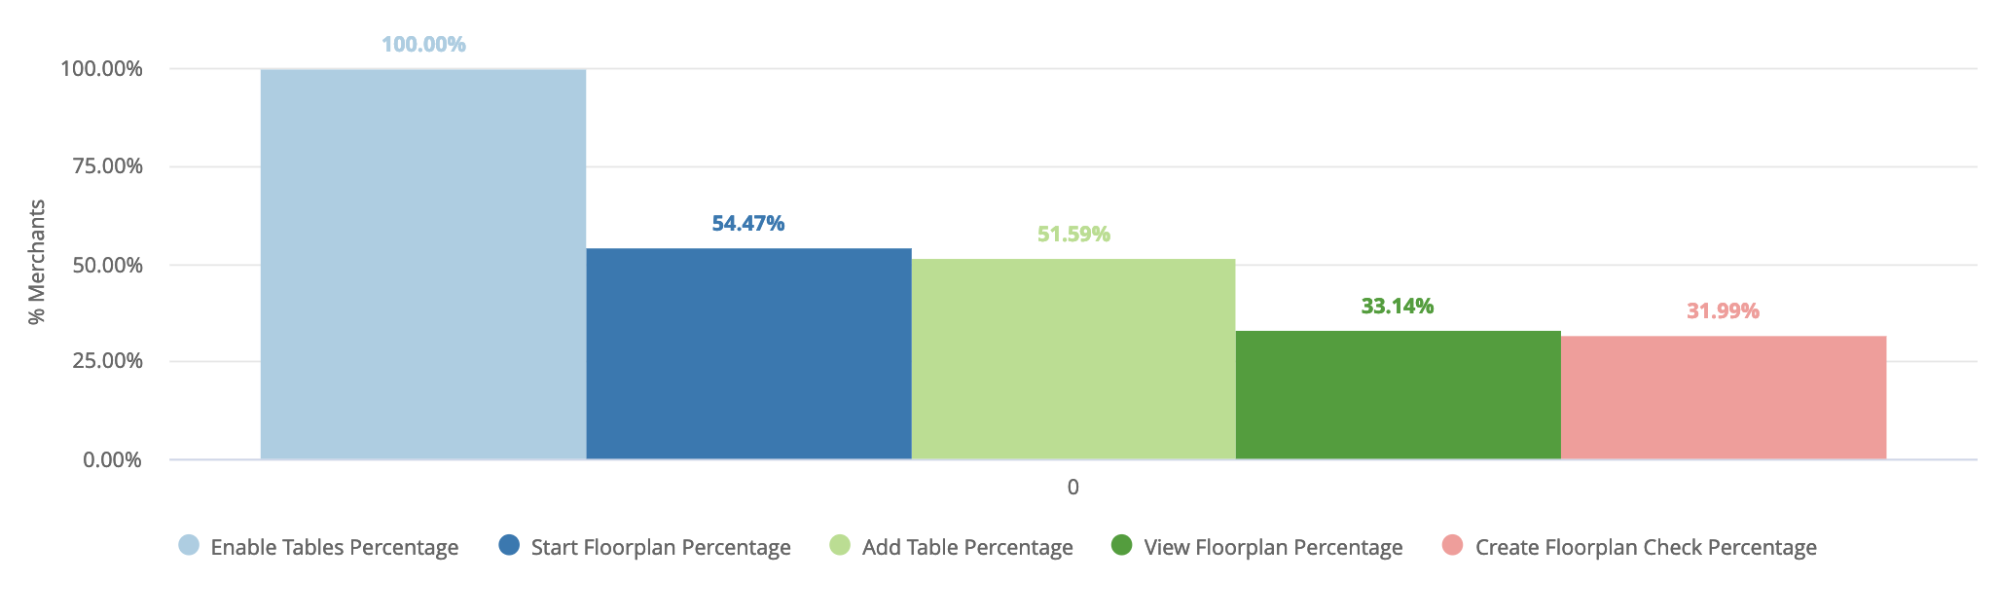
Product Analytics also worked to define adoption for our cornerstone features. Several of the new features - 86ing, seat management, table management, etc. - had several steps to fully adopt and use the functionality. For example, a merchant enables or the feature on Dashboard, tweaks related settings to their specific workflows, then completes the correlated action on the app. Product Analytics developed something we ultimately called ‘feature funnels’ to address this. We built a funnel view with each step to feature adoption, so we could understand adoption drop off and improve the usability of the associated feature.
Logging
To support and measure these metrics and goals, it’s important to instrument your product thoroughly and effectively. Product Analytics started by reviewing designs and functionality, defining adoption and adoption funnel steps, and identified the questions the product team would need and want to answer about the feature. Product Analytics then worked backwards to find the needed feature and workflow events. A new product is an opportunity to get thorough, concise event tracking right from the start. Tracking data can become bloated quickly, but it’s incredibly frustrating when a question goes unanswered because of a gap in tracking. Product Analytics worked to strike a balance between what tracking was necessary, what was nice to have, and what was noise.
While comprehensive logging is near impossible to perfect on the first try, Product Analytics partners can determine what events and metadata should be tracked, how it’s tracked, and how long it’s retained.
It’s also valuable to set (or meet) event naming guidelines early. On Restaurants, we aligned on a Feature: Action: Object naming convention, e.g. Course Management: Fire Course. This sort of framework is common, focusing on the action recipient (Course) and describing the action (fire), with additional metadata passed as needed.
In addition to setting yourself up to understand and analyze engagement down the line, good usage tracking early for your alpha/beta cohorts can make for a smoother launch. For example, we looked at logged settings interactions among our beta group to build smarter device defaults, depending on the type of restaurant. Similarly, early logging showed us how merchants organically discover and return to our 86-ing functionality. We made changes to support and other content to surface that particular flow in set-up.
Evergreen Dashboards
With metrics, goals, and logging in place, early Product Analytics involvement can mean hitting the ground running with dashboards and views into your product’s performance. Here at Square, we talk about our “Minimum Viable Dashboards” - these are views we think add value to products of any stage, with some tailoring depending on product type.
These dashboards start with vitals like customers, revenue, and churn, as well as performance to goal on any axes where you have set them. This allows stakeholders to have visibility into the business from day one and ongoing. On Square for Restaurants we made these views dissectable by restaurant type, size, marketing channel source, and implementation path (paid implementation, or self-onboarded) to allow any dashboard visitors to quickly find and track insights.
Vital dashboards can and should cover more nuanced views like customer segmentation, cohorted retention, and cross-product overlap as well. Customer segmentation surfaces who customers are and how that changes over time - in Square for Restaurants’ case, size and type, Cohorted retention lends color to overall churn numbers - at what stage are merchants churning? Are they churning off features, or the product entirely? Cross-product overlap, particularly for a product ecosystem like Square, allows you to see the other products your customers attach to, which the team can leverage to explore future packaging tests and cross-marketing efforts.
These views into the business and the makeup of our customers are always going to be relevant. They are great to build before launch to both understand beta merchants and track progress from day one.
These dashboards also help validate data sources pre-launch. It sounds simple, but the last thing you want is to surface a bug in your data infrastructure when you’ve made decisions or reported your numbers, or to see nothing in week one. Involving Product Analytics partners early allowed Square for Restaurants to create and validate data pipelines before launch. This ensured a more seamless launch, and confirmed the Restaurants team could confidently share and dig into post-launch numbers.
Jump Start
It’s especially valuable to build vital dashboards before launch to allow Product Analytics a jump start on post-launch analysis. This in turn enables quick and early iteration of sub-optimal product experiences.
On Square for Restaurants, Product Analytics quickly looked at onboarding funnel drop-offs to find areas of tension and difficulty. When data volume had grown, Restaurants Product Analytics conducted an early Magic Moment analysis to identify actions that drive free trial conversion, or, in our eyes, the actions that surface the value of our product offering.
Since launch, the team has already iterated on the series of emails new merchants receive in line with those findings, as well as the onboarding process more broadly. We built and launched in-Dashboard tutorial video content, and are working on further improvements to setup to ensure merchants get the info they need to make a decision about the product and implement expediently. With early Product Analytics involvement and analysis, we were able to iterate from the first quarter in-market.
Testing Discipline
Another area early Product Analytics support adds value is building testing discipline. A/B testing can be weeks/months/years away when a product is getting off the ground and volume is small, but the discipline to identify and document hypotheses, assumptions, methods, and metrics can be built sooner. Building this muscle sets your product team up for iterative and thorough testing come launch and beyond. Testing discipline can be applied to smaller, qualitative surveys and feedback gathering, which we aimed to do while building Square for Restaurants.
For example, we knew we wanted feedback from our merchants on our pricing strategy to ensure it was fair, in line with merchant expectations, and in line with product value. We closely documented what feedback we expected, how we were weighing the feedback we did get, and what we needed to see to make a go/no go final call. As we grow the feature set we return to those hypotheses and findings to ensure they hold.
About a year out from launch, the product team has built the muscle, and has easily fallen into a testing/growth mindset with an expanding growth experiment backlog as our seller volume grows.
Expectation Setting
It is of course important to note that a new product can mean less data with more eyes. As a product moves through its early stages, or when it’s fresh to market, the appetite for signals of product-market fit, product performance, and patterns is huge. A Product Analytics partner can help ensure decisions are made solidly, and that the product team is aware of availability of metrics, reliability and stability (or lack thereof) of data, as well as statistical insignificance. A good, early Product Analytics partners pushes to contextualize any directional signals with qualitative feedback, while helping keep data and quantitative validation top of mind.
Conclusion
Engaging Product Analytics early in the Restaurants product development process helped the team develop deep customer understanding from the jump. This understanding is valuable and critical at any stage, guiding strategy, decision-making, and feature prioritization. Product Analytics worked to define success as the product grew, and establish clean and effective logging to support metric building. The product team was able to understand product and feature performance early, setting them up with a framework to learn and iterate quickly and early.
Authored By


