
Our website uses cookies to enhance your browsing experience.

Many of our articles are focused on anything, but not the PVS-Studio tool itself. Whereas we do a lot to make its usage convenient for developers. Nevertheless, our efforts are often concealed behind the scenes. I decided to remedy this situation and tell you about the PVS-Studio plugin for Visual Studio. If you use Visual Studio, this article is for you.
Static code analysis is the process of detecting errors and flaws in the source code of programs. Static analysis can be considered as a process of automated code review. Joint code review is a wonderful methodology. However, it has a significant drawback - high cost. It's necessary to gather several programmers to review newly written or rewritten code after the modifications made in it.
On the one hand, we want to review code regularly. On the other hand, it is too expensive. The compromise solution is static analysis tools. They earnestly analyze the source code of programs and give recommendations to programmers on reviewing certain code fragments. Of course, a program won't substitute a full-fledged code review, done by a team of developers. However, the ratio price/benefits makes the static analysis quite a useful practice, applied by many companies. If the reader is interested in precise numbers, I suggest you reading the article "PVS-Studio ROI".
There are many commercial and free static code analyzers. A large list of static analyzers is available on Wikipedia: List of tools for static code analysis. The list of languages for which there are static code analyzers is quite large (C, C++, C#, Java, Ada, Fortran, Perl, Ruby, ...). Needless to say, we will tell you about the PVS-Studio analyzer.
The main advantage of static code analysis is the opportunity to greatly reduce the cost of eliminating defects in a program. The earlier an error is detected, the less expensive it is to correct it. Thus, according to the book "Code Complete" by McConnell, error detection at the code testing stage is ten times more expensive than at the stage of code designing (coding):
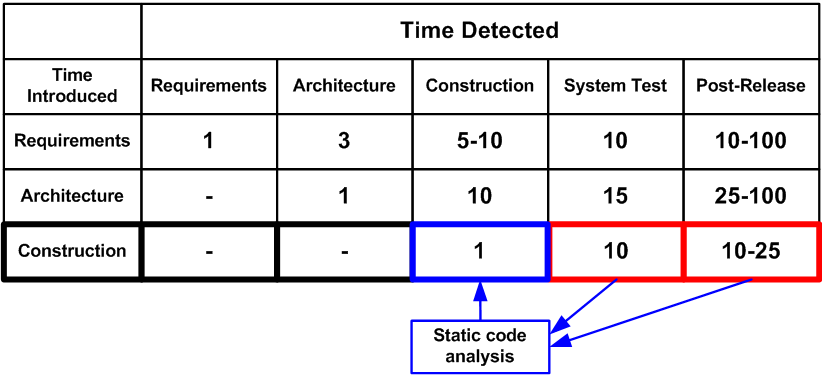
Figure 1. Average cost of correcting defects depending on the time of their appearance and detection in code (data in the table is taken from the book 'Code Complete' by S. McConnell) Click on the picture to enlarge.
Static analysis tools allow detecting a large number of errors, typical for the stage of code designing, which significantly reduces the cost of the whole project development. For example, the PVS-Studio static code analyzer can be run in a background mode right after compilation and in case of finding potential errors will notify a programmer. More on this mode will be given below.
PVS-Studio is a static analyzer that detects bugs and potential vulnerabilities in the source code of applications in C, C++ (other supported extensions: C++/CLI and C++/CX), C# and Java on Windows, Linux and macOS platforms. The analyzer is superbly integrated into the Visual Studio 2010 - 2019 and IntelliJ IDEA IDEs. In this article, we'll take a closer look at PVS-Studio, checking the code in C, C++, and C# languages. You can read about how to use PVS-Studio to check Java code in IntelliJ IDEA here.
After PVS-Studio installation and its integration in Visual Studio, users get an additional item "PVS-Studio" in the main menu and the window for working with error messages:
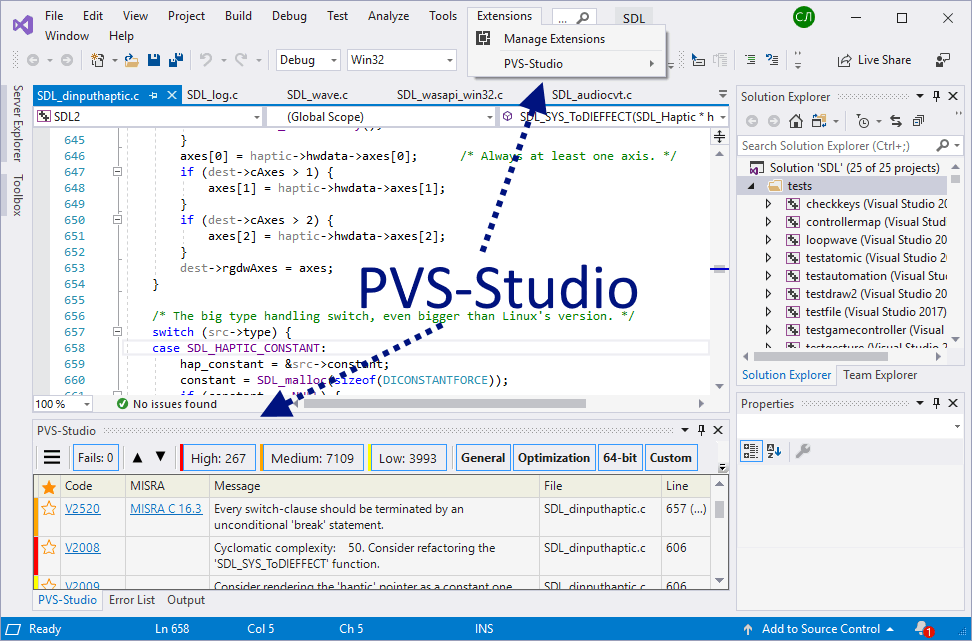
Figure 2. The main items that the PVS-Studio analyzer adds when integrating into Visual Studio. Click on the picture to enlarge.
The analyzer is ready to work right after installation. In most cases, you don't need to configure anything for the first run. The only setup you might need in the beginning is the exclusion of third-party libraries. You're not going to fix anything in the original files, for example, the jpeg library, so there's no need to check it. In addition, excluding of unnecessary folders will speed project analysis up. The directory's exceptions are set here: PVS-Studio > Options... > Don't Check Files > PathMasks (see Figure 3).
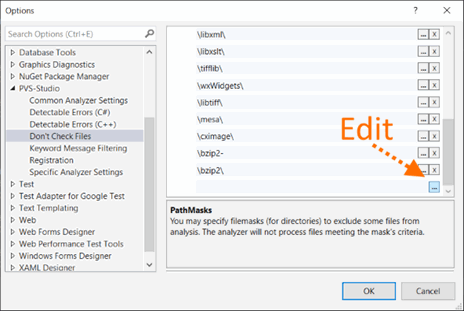
Figure 3. Editing a list of directories that the analyzer won't check.
If in the full file name there is one of specified names, the analysis won't be performed for this file. By default, names of some directories are already included in the list. However, in your project, the directory with the ZLib library can be called not "zlib", but, for example, "zip_lib". Therefore, this list should be edited. To start editing, you need to click a button with three points.
Examples of acceptable masks for the PathMasks list:
In addition to excluding entire directories, you can set masks to exclude individual files. To do this, there is the setting FileNameMasks. Find out more about how to work with exception lists in the documentation: Settings: Don't Check Files.
When you complete the initial settings, you can start checking the project. PVS-Studio for Visual Studio supports checking of C++ (.vcxproj) and C# (.csproj) projects. You can also immediately try to check the entire solution, which contains projects of these types. To do this, select the Extensions menu item Extensions > PVS-Studio > Check > Solution (See Figure 4).
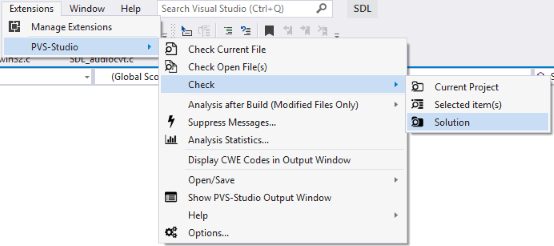
Figure 4. Check of a solution using the PVS-Studio analyzer.
If there are some difficulties with the check, we recommend referring to the section "PVS-Studio: Troubleshooting" on our website. These are not stupid recommendations in the spirit of "check that the plug is inserted into the socket." The section describes typical situations of users' requests and suggests options.
After the check, all diagnostic messages will be displayed in a special window. The window has many control components. All of them serve to show exactly those diagnostic messages that are interesting to the user. However, at the first moment the window may seem complicated. Let's look at all control components (see Figure 5).
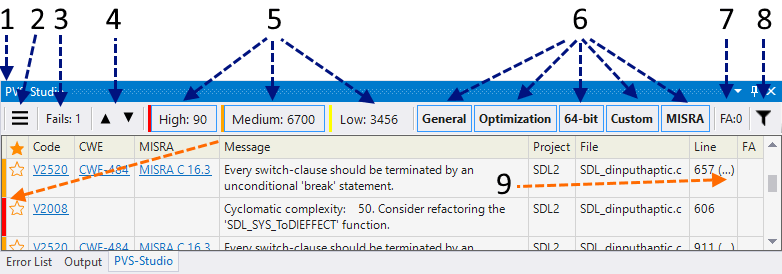
Figure 5. A window with diagnostic messages. Click on the picture to enlarge.
The table with diagnostic messages is divided into the following columns:
Yes, it was exhausting to read it all. However, I assure you, having started to use it, you will quickly get used to the tool. And you'll rarely click something to set up.
So, by double clicking on the message, you go to the relevant piece of code. By the click of the right mouse button, the context menu opens.
The menu is quite simple, and I won't clutter the article with the description of each item. If something is not clear, you can look into the documentation.
Nevertheless, I'd like to dwell on one very useful feature. Do you remember that in settings you can add folders/files to be excluded? The thing is that adding something is much simpler than it seems!
Pay attention to the menu option "Don't check files and hide all messages from...". When you click on it, you get a list of paths that you can add to the exceptions (see figure 6).
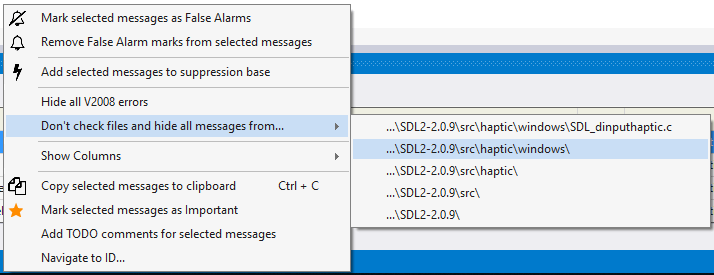
Figure 6. Excluding files from the check. Click on the picture to enlarge.
You can choose a separate file or one of the directories. The picture shows that the folder "SDL2-2.0.9\src\haptic\windows" is chosen. This means that all the files in this folder and all subfolders will be excluded from the analysis. What's more, all messages related to these files will disappear from the list immediately. Very convenient. You don't need to restart the analysis to remove all messages related to the tests.
Introduction to PVS-Studio will be incomplete, if we conceal one of the most important features - incremental code analysis.
The earlier an error is detected, the less expensive it is to eliminate it. The best option is to highlight errors in the edited program text straight away. However, it is technically difficult and resource-intensive. That's why PVS-Studio runs in the background mode when the fixed code is successfully compiled. In so doing, you look for bugs in the code that has just been changed. The icon in the system notification area indicates that the analysis is running.
When an error is found, a pop-up window appears, warning of danger (see Figure 7).

Figure 7. A pop-up message, reporting that suspicious places have been found in edited files.
If you click on the icon, you will open the IDE with the result of the project check (see Figure 2) and you can dig into suspicious code fragments.
In fact, it's easier to try working in this mode than to describe it. You write the code as before. When it is needed, the analyzer will disturb you. Give it a shot!
We use this mode all the time. Yes, we also sometimes make coding errors. The ability to fix them immediately significantly reduces the time for detecting the defect and trying to understand why the program is not behaving as intended. It's very upsetting to spend 15-20 minutes debugging to eventually find a typo in the index. Here's one of the cases when PVS-Studio found an error in PVS-Studio right after it appeared in the code:
if (in[0] == '\\' && in[1] == '.' && in[1] == '\\')
{
  in += 2;
  continue;
}
Well, the most interesting is yet to come. The PVS-Studio analyzer can sometimes be much more useful than this. Here's one of the reviews about our analyzer: "A User's Experience of Working with the Analyzer". The text makes me wonder.
Let me sum it up. Incremental analysis is something you should definitely try. You'll love it as soon as you find a couple of blunders in the fresh code.
Let's be brief. It is impossible to succinctly describe all the diagnostics that are available in PVS-Studio. A full list of diagnostics and their detailed description can be found in the documentation: Description of detected bugs. Let's settle upon the table in which diagnostics are grouped by type. Some diagnostics are in more than one group. The fact is that classification is quite formal. For example, a typo can result in the use of uninitialized memory. Some of the errors, on the contrary, couldn't fit any of the groups, because they were too specific. Nevertheless, this table gives the insight about the functional of the static code analyzer. Note: the table was too long, so you'll only see a small screenshot of it. If you want to see the table in full, then follow the link above, or click on the picture.

Figure 8. PVS-Studio capabilities. Click on the picture to enlarge.
As you see, the analyzer is especially useful is such areas as looking for Copy-Paste bugs. It's great at detecting problems related to code security.
To see these diagnostics in action, have a look at the error base. We collect all the errors that we've found, checking various open source projects with PVS-Studio.
PVS-Studio is a static application security testing tool. The analyzer can detect potential vulnerabilities in the project's code and show the appropriate error identifier in a certain classification.
PVS-Studio supports the following error classifications:
You can enable display of CWE codes by the context menu in the analyzer window by the path Show Columns > CWE
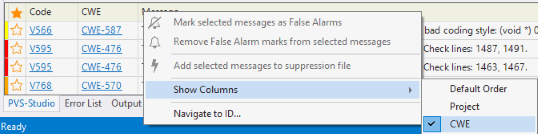
Figure 9. Context menu and the example of CWE output.
Or in the main menu (Extensions > PVS-Studio > Display CWE Codes in Output Window)
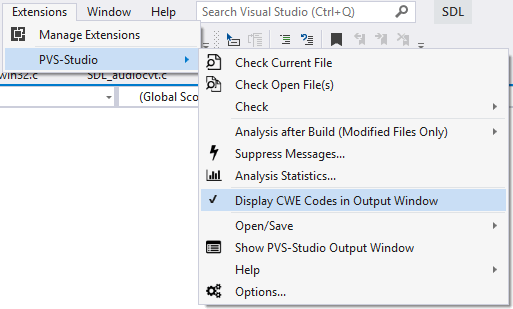
Figure 10. Extension's menu.
MISRA diagnostics are enabled separately in the settings:
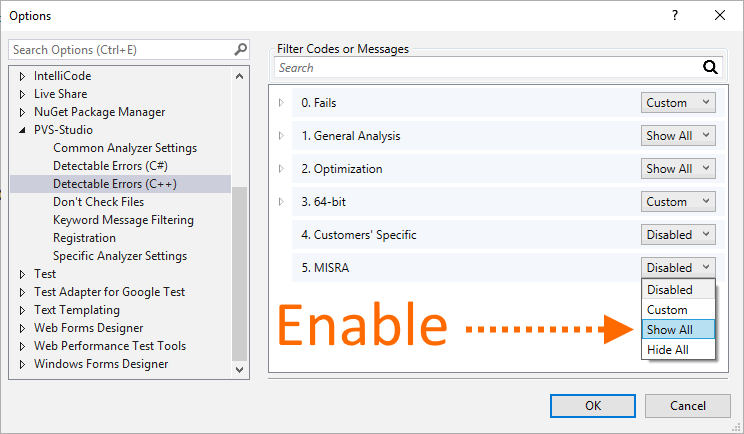
Figure 11. A list of detected errors.
You can read more about these classifications here.
PVS-Studio_Cmd.exe - a utility for checking C++/C# Visual Studio projects (.vcxproj/.csproj) and .sln solutions from the command line. It can be useful to automate the analysis. The program is in the directory where the installation was made - by default it is 'C:\Program Files (x86)\PVS-Studio'.
The program has many parameters, but first we need only 3 of them:
Here's what the run will look like:
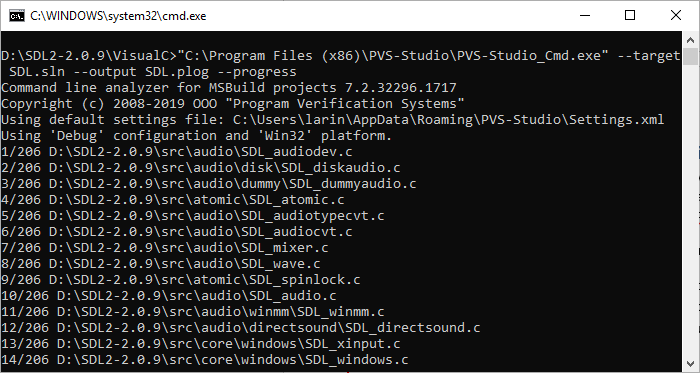
Figure 12. Output of the PVS-Studio_Cmd.exe program.
After running we'll get a plog file with a report, a path to which we specified in the running options. You can convert this report in other formats using the PlogConverter.exe utility. To view the report in IDE, double click a plog file in the finder.
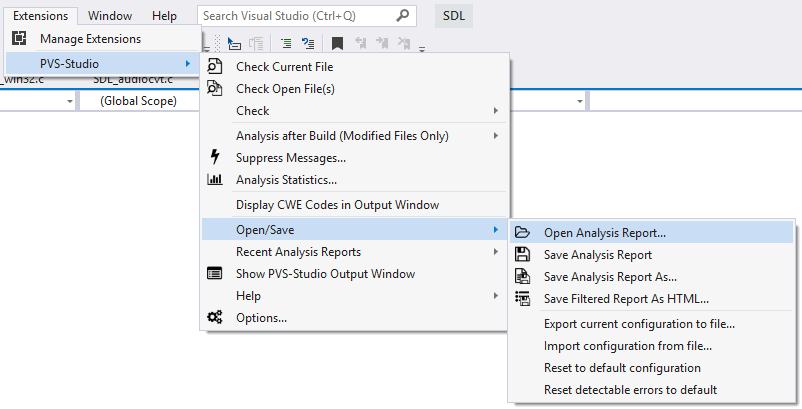
Also you can open the report file in the extension menu by the path Extensions > PVS-Studio > Open/Save > Open Analysis Report...
Detailed information on the utility and its parameters can be found in the documentation.
Some messages issued by the analyzer will inevitably be false. There's nothing we can do about it. A static analyzer is just a program that doesn't have artificial intelligence and can't pinpoint whether it's a real bug or not.
To fight against false positives, the analyzer provides a set of different mechanisms. They are detailed in the following sections of documentation:
Of course, we didn't tell you everything about the tool. If I you tell everything, the article will turn into documentation. The aim was to show how easy it is to work with the tool within the Visual Studio environment. You can read about other environments and modes of work in the documentation and other articles on our website. There are a lot of interesting things for programmers, by the way. Come and hang around.
It's worth noting that PVS-Studio doesn't just work in Microsoft environment. We also support the Java language, we can work on Linux and macOS, integrate into CMake and much more. You can find out more in the documentation.
I wish you bugless bad code and hope you'll enjoy PVS-Studio. If there are any questions, we will always help and give advice. Write to us.
0
0
0
0