After almost half a year since last updates I'm glad to announce that another set of useful features and improvements have found their way to pgwatch2 - our Open Source PostgreSQL monitoring tool of choice. New version is incremented to 1.6 but continuing the naming tradition I'm also calling it "Feature Pack 5" as it's mostly a feature release (with a couple of bugfixes as well). So here is a quick overview on changes in v1.6 – for the "full monty" and when updating from a previous version, please turn to the GitHub changelog link below.
Table of Contents
The choice of data storage "backends" has been widened again (previous version added PostgreSQL) – it's now possible to leverage the very popular Prometheus TSDB to store metrics gathered by pgwatch2! But a recommendation - I'd use Prometheus only when it's already running in your organization and would strongly consider the alternatives (Postgres, InfluxDB) if planning to only monitor Postgres and starting a fresh monitoring setup as Prometheus is not able to store string values which is not optimal for Postgres monitoring. Also remember that we're talking about the "pull" model now – previously metrics were pushed to the datastore. To get quickly started there's also a suitable "predefined config" provided and an "DB Overview" dashboard similar to Postgres / InfluxDB.
The second big feature add support for our favourite Postgres HA cluster manager – Patroni, and should especially appeal to people running Postgres in a "cloudy" manner. In short the feature means that you can provide connection information to your Distributed Consensus Store (etcd, Zookeeper, Consul) that's powering Patroni and then pgwatch2 will periodically consult this DCS and fetch the active "to be monitored" instances listing from there. Remember - the standard way is to exactly tell on which IP-s / hostnames your Postgres instances are available. For the time being though to keep it simple access is only possible to DCS-s that are not using passwords (which is the common case as no real secrets are stored there).
And as always, please do let us know on Github if you’re still missing something in the tool or are experiencing difficulties - any feedback would be highly appreciated!
Project GitHub link – here.
Full changelog – here.
Due to quite some requests we decided to also support one of the most popular metrics gathering solutions – Prometheus. When --datastore=prometheus then pgwatch2 doesn't do any interval-based fetching but listens on port 9187 (changeable) for scrape requests configured and performed on Prometheus side. Returned metrics belong to "pgwatch2" namespace (a prefix basically) and is changeable via the --prometheus-namespace flag. Also, important to note – in this mode the pgwatch2 agent should be now run on all individual DB hosts, not centrally. While technically possible though would counter the core idea of Prometheus and would make scrapes also longer, risking timeouts. FYI – the functionality has overlap with the existing "postgres_exporter" project but also provides more flexibility in metrics configuration and all changes are "online".
pgwatch2 can automatically track and monitor all members of a HA cluster via a DCS connect string. Use the new "Host config" column to provide the DCS info according to help texts when using the Web UI or "host_config" map when using YAML. To track a single DB on all cluster members set "DB type" to " patroni" and to track all DB-s use "patroni-continuous-discovery".
Previously all declared hosts in "enabled" state were monitored but now if we're now only interested in the active master / primary then some storage / network bytes can be saved, and switchover detection will be automatic.
Powered by "goreleaser". Releases will now have DEB / RPM packages of the "gatherer daemon" + needed config / SQL files available on GitHub releases page.
This was an oversight and makes life a lot easier.
Previously one had to have all pieces (host, port, etc...) as separate fields.
Not all but most important settings are tracked when the "settings" metric is activated. Visualized on the "Change events" dashboard.
This enables cluster level summarization of all DB-based metrics. See --add-system-identifier / system-identifier-field params. PG 10+ only due to pg_control_system() requirement.
Previously one had to change all metrics for that. Feature is useful for plain informational purposes or for advanced (corporate) use cases when wanting to "join" metrics gathered by some other monitoring system that works with real database names. See --add-real-dbname / real-dbname-field params.
For most out-of-the-box dashboards it doesn't change much besides a bit shinier visuals, but this means that old v5 dashboards won't get any more updates!
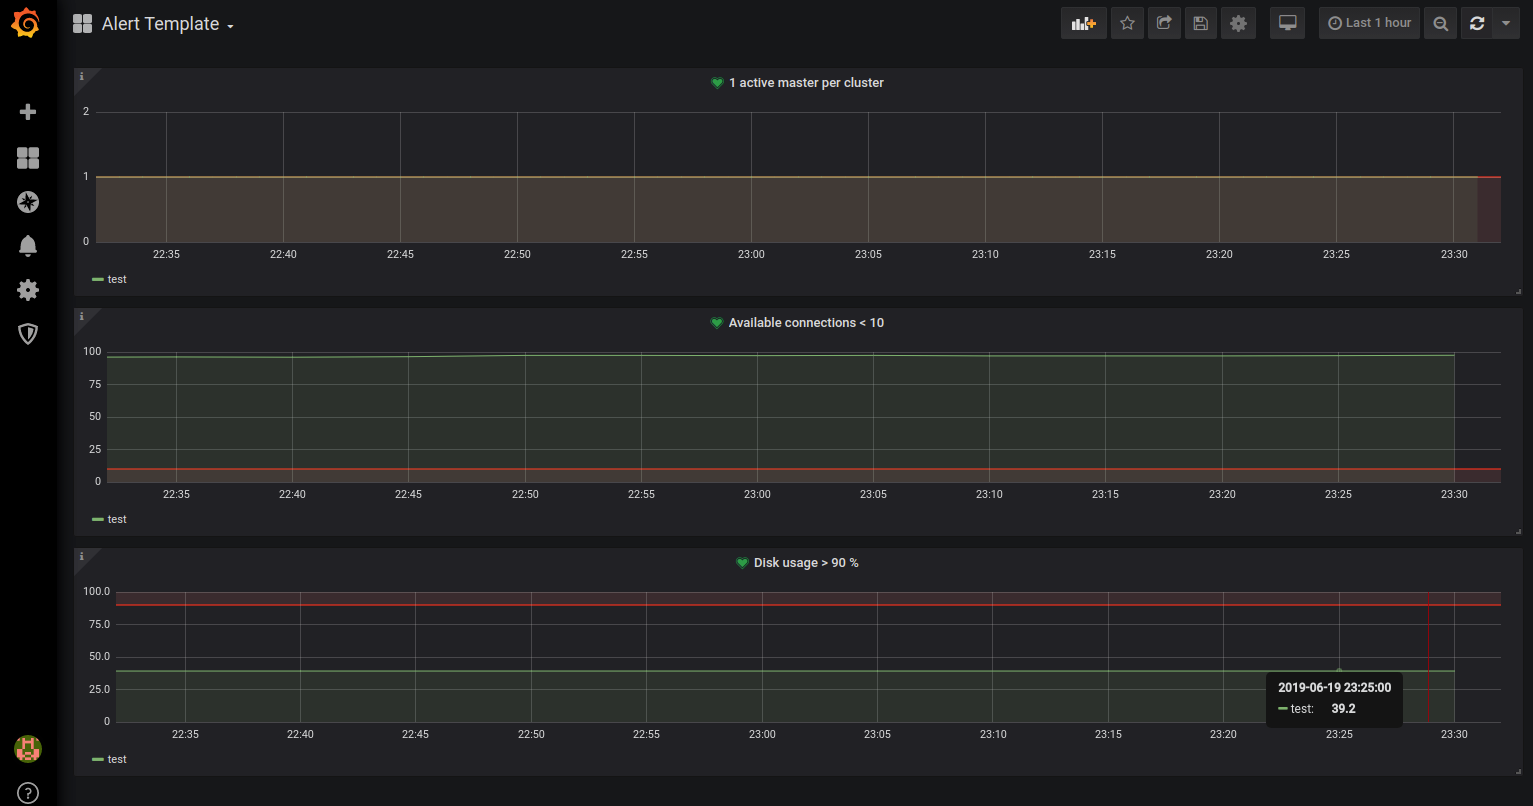
As there have been quite some questions on alerting (which is out of scope basically though), we've added something that people could take a look at and go from there. Postgres backend only.
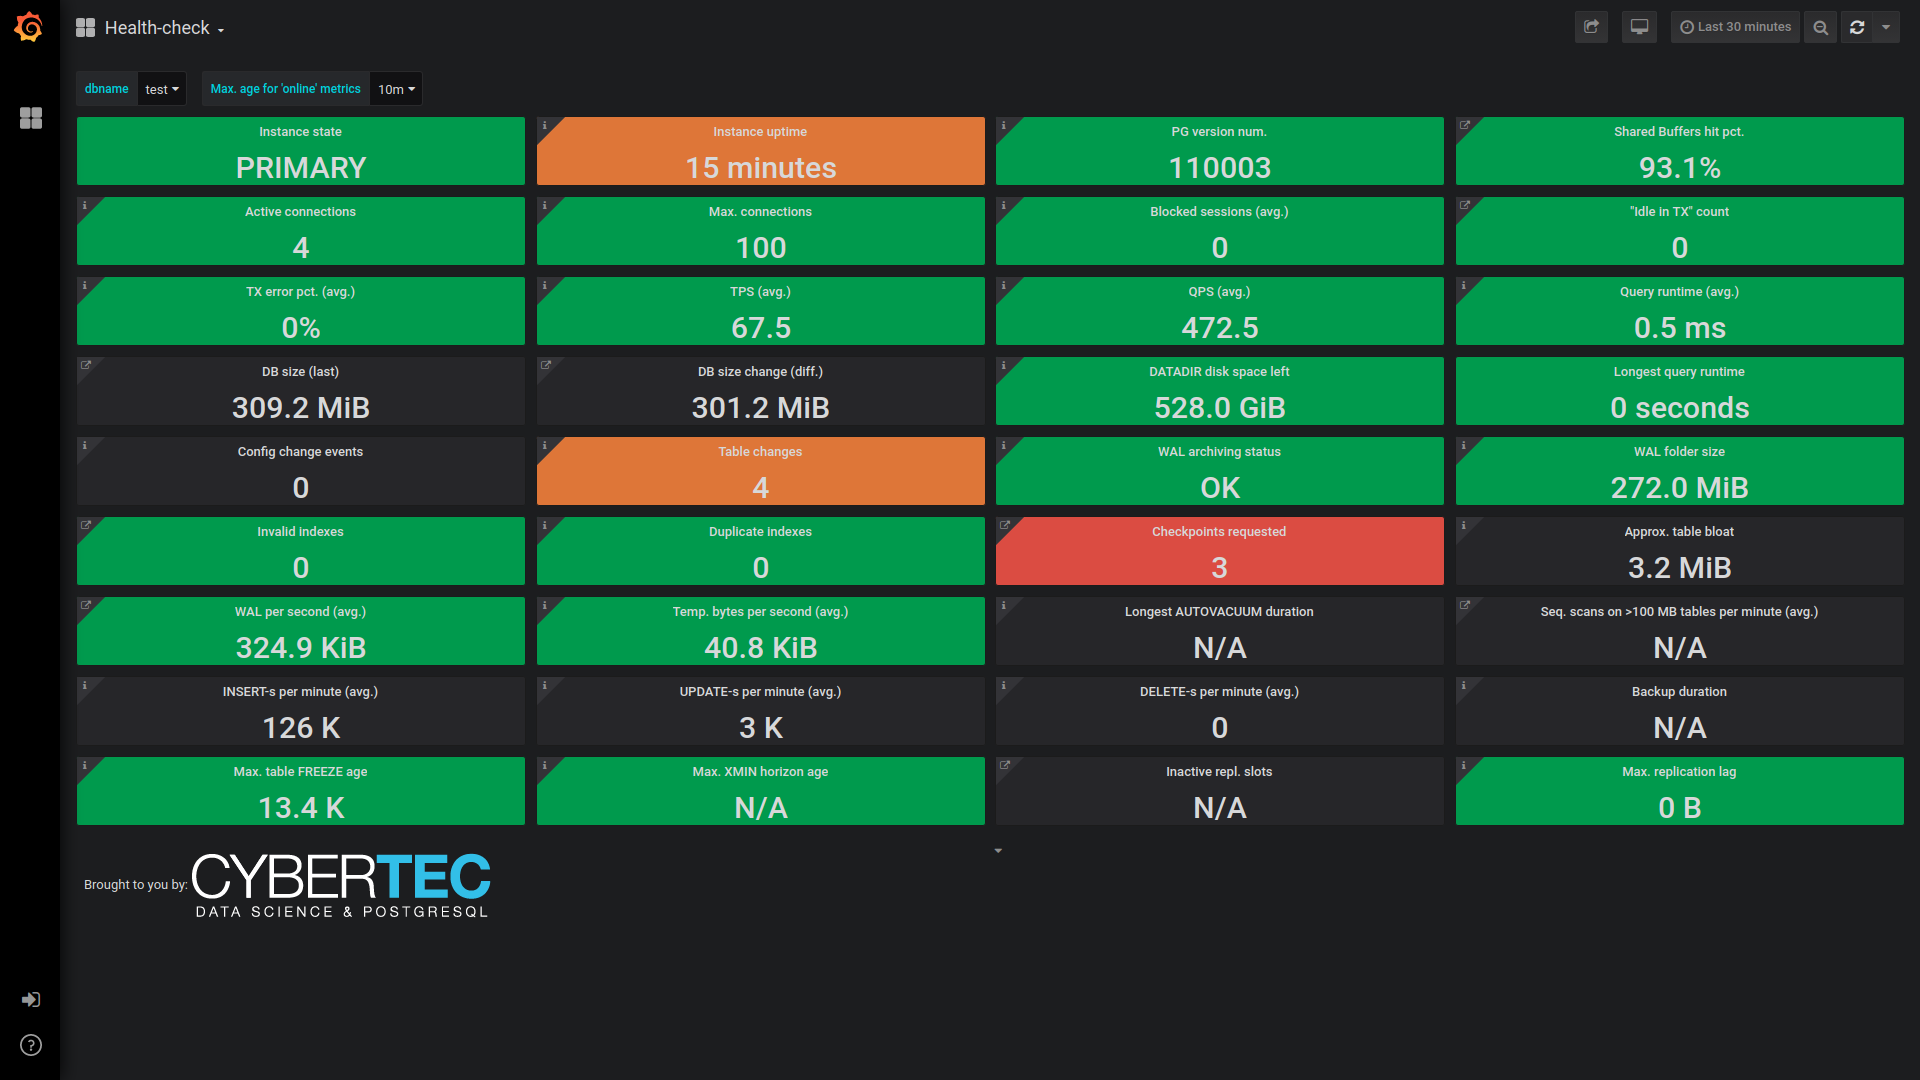
Most changes went to "Health-check" – now showing more info: PG version, uptime, transaction wraparound, longest autovacuum. "Change events" dash now also displays "server restarted / crashed" event annotations. Many other minor dashboard adjustments.
pgwatch2 is constantly being improved and new features are added. Learn more >>
Screenshot of the updated "Health check" dashboard in pgwatch2 v1.6
Screenshot of the new "Alert template" dashboard
+43 (0) 2622 93022-0
office@cybertec.at
You need to load content from reCAPTCHA to submit the form. Please note that doing so will share data with third-party providers.
More InformationYou are currently viewing a placeholder content from Facebook. To access the actual content, click the button below. Please note that doing so will share data with third-party providers.
More InformationYou are currently viewing a placeholder content from X. To access the actual content, click the button below. Please note that doing so will share data with third-party providers.
More Information