
The Couchbase Mobile 2.5 release introduced extensive stats reporting capabilities on the Sync Gateway.The stats provide key insights into the health of your Couchbase Mobile deployment and constitues an integral part of any deployment.
In this post, we discuss how you can use Prometheus, an open source monitoring and alerting platform for monitoring your Sync Gateway nodes and Grafana for visualizing the stats. In an upcoming related post, we will discuss how you can setup monitoring with Prometheus on a Couchbase Mobile Kubernetes cluster.
Background
Sync Gateway Stats Reporting
Sync Gateway stats are reported in JSON format and is available through the _expvar endpoint via the Sync Gateway Admin REST interface.
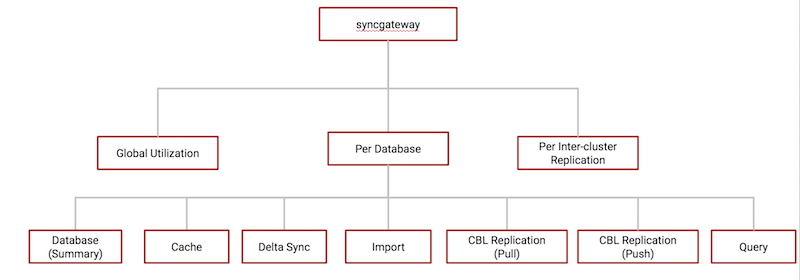
These are the categories of stats that are reported.
Prometheus
Prometheus is an open source systems monitoring and alerting platform and hosted by Cloud Native Computing Foundation. At the core of it is the Prometheus Server that is responsible for polling “Prometheus targets” for stats and storing it as time series data. Prometheus targets are statically configured or can be discovered by Prometheus.
Grafana
Grafana is an open source data visualization and alerting platform. It supports Prometheus as a data source and can be used to build comprehensive dashboards.
Introducing the Prometheus Sync Gateway Exporter
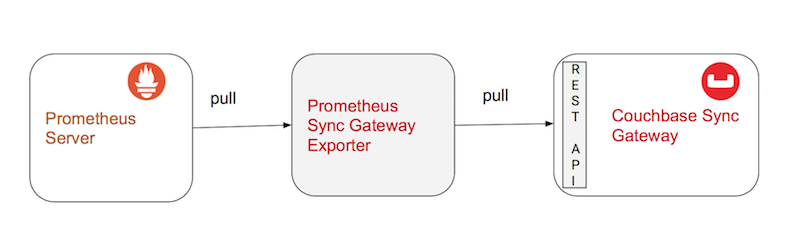
In order for Prometheus to monitor the Sync Gateway, we need a “Prometheus target” corresponding to the Sync Gateway. This target is the Sync Gateway Exporter, herein referred to as “the Exporter”. Simply put, the Exporter is responsible for exporting Sync Gateway stats to Prometheus metrics.
Deployment Architecture
Tying all this together, a typical deployment would like the following –
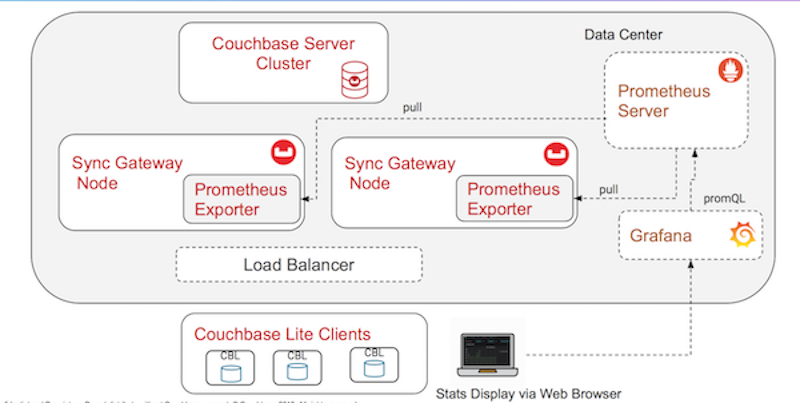
- Sync Gateway Exporter The Sync Gateway Admin REST API is, by default, only exposed on localhost. This configuration is strongly recommended in production enviornments as well. As a result, since the Exporter polls the Sync Gateway Admin API for stats, the Exporter would need to be on the same host/node as the Sync Gateway. Also,the Sync Gateway stats are reported on a per-node basis. So in a cluster of two or more Sync Gateway nodes, each Sync Gateway node must have it’s own Exporter.
- Prometheus Server continually polls the Exporter for stats, which in turn polls the Sync Gateway REST endpoint. The server uses the rules defined in the rules.yaml to push alerts to the Alerting Manager.
- Grafana service polls the Prometheus Server for stats and graphs it on a web-based dashboard that can be accessed via the web browser.
Installation
In the remainder of the post, we will walk through the steps to setup a Couchbase Mobile cluster for monitoring with the Exporter, Prometheus Server and Grafana. While the instructions are intended for a development environment, you can easily customize these for a production environment.
We will be using docker, which will make it extremely simple to get up and going.
Downloading Exporter Source code
The Sync Gateway Exporter is open source couchbaselabs project and available on GitHub. It is compatible with Couchbase Sync Gateway 2.5. To that end, while we will strive to keep it up-to-date with the latest release of Sync Gateway, we cannot guarantee that. But the good news is that it is open source and includes detailed instructions on how you can extend it to support additional stats.
Download the Exporter source from github
|
1 |
git clone https://github.com/couchbaselabs/couchbase-sync-gateway-exporter |
Deploying Couchbase Mobile Cluster
All commands in this section must be executed from the root folder of the cloned github repo.
|
1 |
cd /path/to/exporter/cloned/repo |
If you already have a Couchbase Mobile cluster running on docker, you can skip this step and move on to the “Deploying Sync Gateway Exporter” step. Just remember to substitute the docker network name corresponding to your existing setup in the instructions below.
Creating a docker network
When using docker, it is recommended to run all the components on same docker network.
Create a docker network with the name “demo”
|
1 |
docker network create demo |
Deploying Couchbase Server
We will use a special docker image of the Couchbase Server v6.0.1 that includes a preinstalled sample bucket called “TravelSample” as well as a preconfigured RBAC user with “Application Access” that would enable Sync Gateway to connect to the Couchbase Server.
If you prefer, you can install the vanilla docker image of the latest version of Couchbase Server and manually configure it with a bucket and Sync Gateway RBAC user.
|
1 |
docker run -d –name cb –network demo -p 8091–8094:8091–8094 -p 11210:11210 connectsv/server:6.0.1-enterprise |
Deploying Sync Gateway
The Sync Gateway will be launched with the config file named sync-gateway-config.json that is located in the “testdata” folder of the cloned repo.
|
1 |
docker run -p 4984–4985:4984–4985 –network demo –name sync-gateway -d -v `pwd`/testdata/sync-gateway-config.json:/etc/sync_gateway/sync_gateway.json couchbase/sync-gateway:2.5.0-enterprise -adminInterface :4985 /etc/sync_gateway/sync_gateway.json |
Try it out
Confirm that your Sync Gateway is up and running and that the _expvar endpoint is accessible by running the following curl command. If things are working as expected, you should see a whole lot of stats output to the console.
|
1 |
curl GET http://localhost:4985/_expvar |
Deploying Sync Gateway Exporter
The docker image of the Sync Gateway Exporter is available at couchbasesamples/sync-gateway-prometheus-exporter:latest.
The sgw.url config option is of particular interest. This points to the Sync Gateway server. If you are working with an existing deployment of Couchbase Mobile, make sure you set the sgw.url to point to the Sync Gateway node in your setup.
The Exporter binds to 0.0.0.0 by default. You can override that using --web.listen-address option.
|
1 |
docker run -p 9421:9421 –network demo –name exporter -d couchbasesamples/sync-gateway-prometheus-exporter:latest –-log.level=debug –-sgw.url=http://sync-gateway:4985 |
Try it out
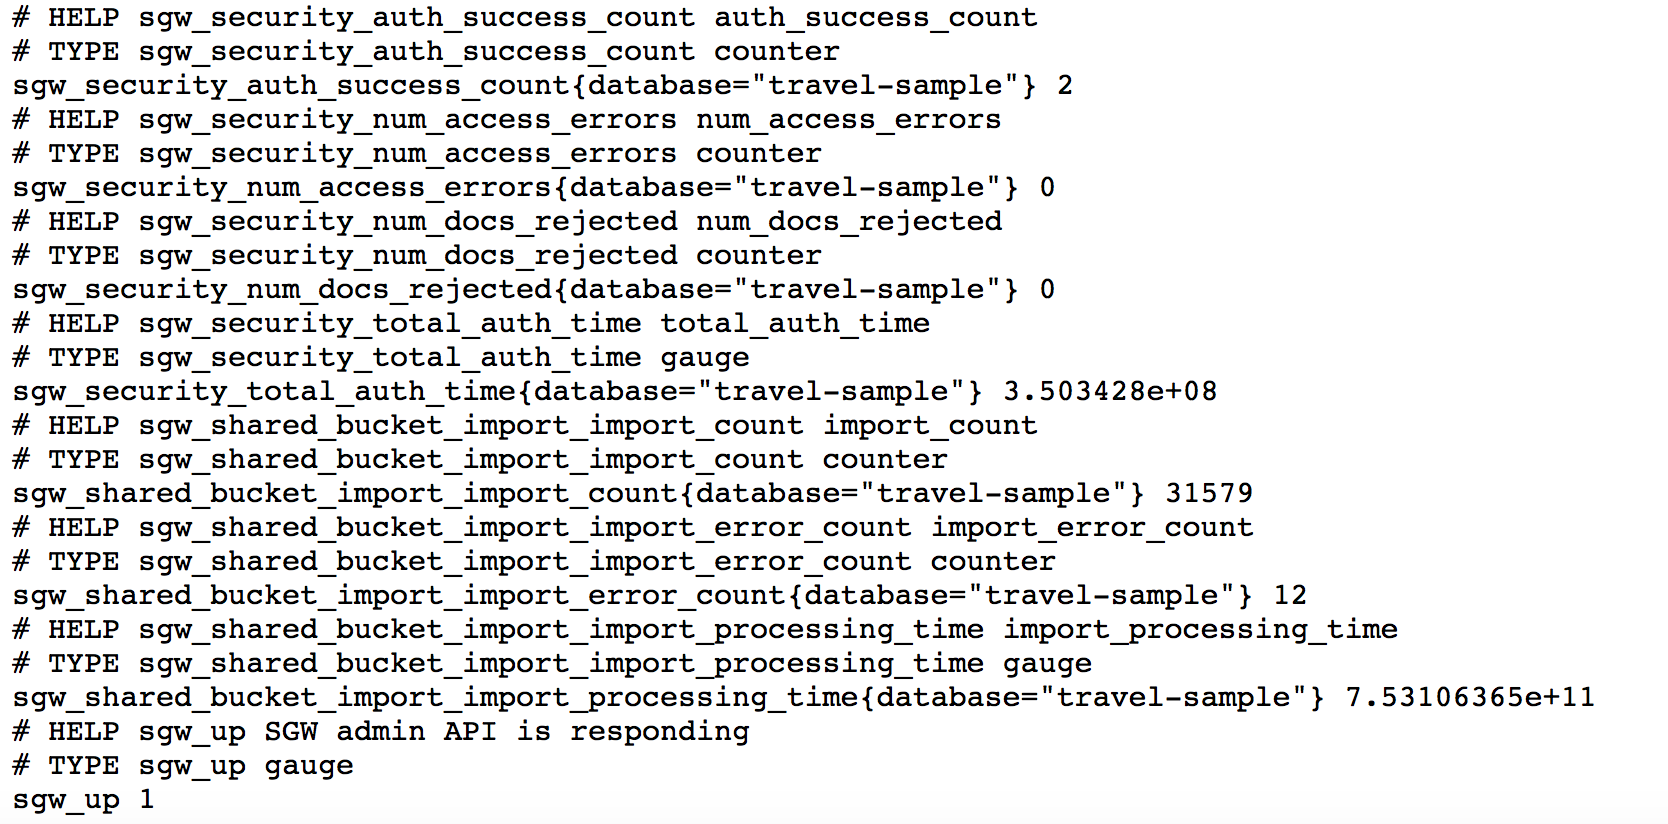
Confirm that the exporter is up and running with the following curl command.
|
1 |
curl http://localhost:9421/metrics |
If things are working, there will be a bunch of metrics output to the console. Confirm that the “sgw_up 1”.
Deploying Prometheus Server
Now that we have the Exporter exporting stats from the Sync Gateway, we will setup Prometheus to poll the Exporter for metrics.
Exploring the prometheus.yml file
The prometheus.yml specifies the config with which the Prometheus server is launched. It is located in the “testdata” folder of the cloned repo. Let’s examine the contents of this file.
|
1 2 3 |
global: scrape_interval: 5s evaluation_interval: 5s |
|
1 2 3 4 5 6 7 8 |
rule_files: - &apos;/etc/prometheus/rules/*&apos; scrape_configs: - job_name: swg static_configs: - targets: - exporter:9421</code></pre> |
- The
scrape_intervalspecifies the polling interval. You can adjust it per your needs - The
rule_filesspecifies the location of the Prometheus Rules file. The Prometheus rules file,sync-gateway.rules.ymlis located attestdata/rules/folder in the cloned repo. The rules are used by Prometheus to trigger alerts. We have provided a baseline set of rules as a starting point. You can customize the rules as needed. The rules file is mounted at/etc/prometheus/ruleswhen the docker container is launched. - The
targetsspecifies the Prometheus targets which is the Exporter. You could have multiple exporters if you have multiple Sync Gateways. In that case, you can statically specify all the Exporter endpoints or configure Prometheus to discover the targets.
Installing docker image
We will deploy the official docker image prom/prometheus with the prometheus.yml file included in the cloned repo.
|
1 |
docker run -p 9090:9090 –network demo –name prometheus -d -v `pwd`/testdata/prometheus.yml:/etc/prometheus/prometheus.yml -v `pwd`/testdata/rules:/etc/prometheus/rules prom/prometheus |
Try it out
Open the URL http://localhost:9090/graph in a web browser.
– Click on the “Insert metric at Cursor” button to see list of available Sync Gateway metrics.
– Click on “Status”->“Targets” to see the list of exporters and their stats
– Click on “Alerts” menu button to see the status of the alerts
Deploying Grafana
While you could use Prometheus’s web UI for visualizing the stats, we will be using Grafana as you can create some very compelling dashboards with it and Grafana integrates well with Prometheus.
- We will install the official
grafana/grafana:6.2.0docker image. Thegrafana/datafolder in the cloned repo contains thegrafana.dbthat is used for persisting the dashboard and other metadata. This is volume mounted atvar/lib/grafana
|
1 |
docker run -p 3000:3000 –network demo –name grafana -d grafana/grafana:6.2.0 -v `pwd`/grafana/data:/var/lib/grafana |
- A default “Couchbase Sync Gateway” dashboard called
dashboard.jsonnetis available in the cloned repo as a jsonnet file. Make thegrafanatarget to generate the correspondingdashboard.jsonfile that can then be imported into Grafana. The dashboard graphs all the metrics exported by the Exporter. You can customize it per your needs.
|
1 2 3 4 5 6 7 8 |
# Pull in relevant submodules that jsonnet needs git submodule update –init –rebase –remote –recursive # Make the grafana target to generate the dashboard.json file make grafana |
Try it out
- Open the URL
http://localhost:3000in a web browser. You should see the login screen. Log in with the default credentials of “admin” and password of “admin”. You can change it after initial login.
- Next step would be to add “Prometheus” as the “Data Source” and import the “Sync Gateway dashboard” json file that was generated earlier. You could do this manually by following the menu options. We have simplified this process and provided a script that will do all that for you!
Run the script from the root of your cloned repo using command below by runningmakeon thegrafana-devtarget. This does the following
-
- (Re)Generates the
dashboard.jsondashboard from thedashboard.jsonnetfile - Uses Grafana API to add Prometheus as data source
- Uses Grafana API to load the
dashboard.jsongenerated in the previous step
- (Re)Generates the
|
1 |
make grafana-dev |
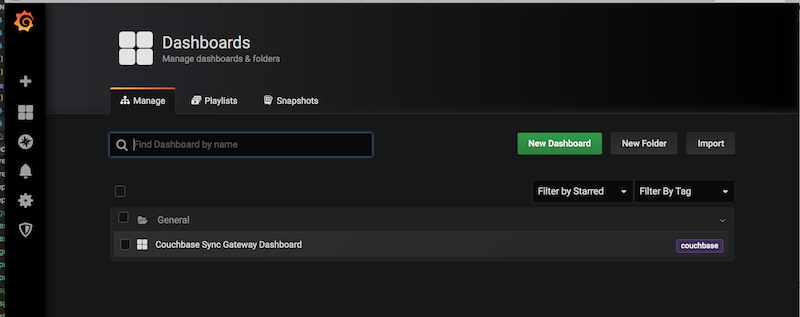
- Once the script succesfully executes, you should refresh the Grafana web UI on your web browser. You will see the “Couchbase Sync Gateway Dashboard” in list of available dashboards. The dashboard graphs all the stats reported by Sync Gateway. You can customize the dashboard.
- Click on the “Couchbase Sync Gateway Dashboard” to see the stats. You can filter it by Sync Gateway (if you have more than one) or database
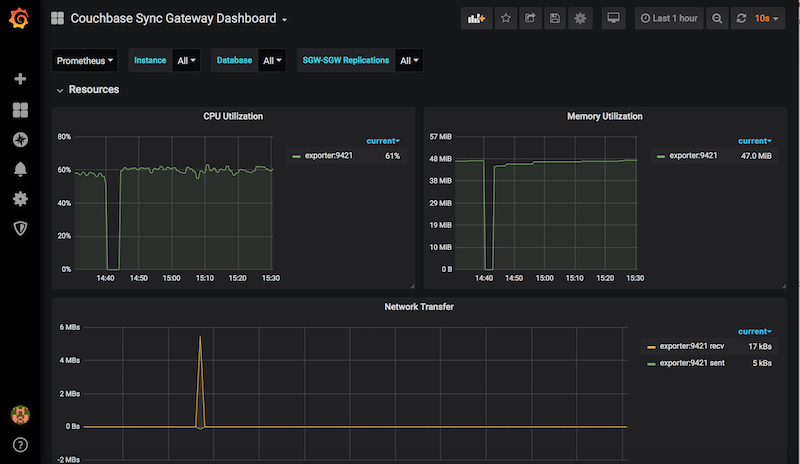
That’s it! You have succesfully setup monitoring with Prometheus and Grafana. You can now drive replications with Couchbase Lite clients and monitor it. The default Sync Gateway dashboard is a starting point. You can customize the dashboard, either by editing the dashboard.jsonnet file or directly through the Grafana UI.
TL;DR
Instead of running each container independently, you can do a multi-container launch using docker-compose.
The repo includes a docker-compose.yml file that you can use to launch all the containers including Couchbase Server, Sync Gateway, Exporter, Prometheus and Grafana . There are some caveats. You can learn more about it here
|
1 |
docker-compose up |
What’s Next
Using the Sync Gateway Exporter, you can export Sync Gateway stats to Prometheus and visualize it using visualization tools such as Grafana. This vastly simplifies the monitoring of your Couchbase Mobile clusters. In addition to Exporter, we have provided a default Grafana dashboard that you can customize. customizing the dashboard itself, you can also customize the rules for alerts. While we discussed the installation using docker containers, you could also install the binaries directly.
In the next blog, we will discuss how you can deploy the Exporter in a cluster running Kubernetes. So stay tuned for that!
If you have questions or feedback, please leave a comment below or feel free to reach out to me at Twitter @rajagp or email me priya.rajagopal@couchbase.com. The Couchbase Forums are another good place to reach out with questions.
Acknowledgements
I would like to thank Carlos Becker for his work on building the first version of the Sync Gateway Exporter.