
When I started my Computer Science studies three years ago, Machine Learning seemed like one of those tools that only brilliant scientists and Mathematicians could understand (let alone use to solve day-to-day problems). Whenever I heard the words "Machine Learning", I imagined a high tower with dark clouds above it, and a dragon guarding it. I think the main reason for this irrational fear is that the field is an intersection of so many disciplines that I had no idea about (e.g. Statistics, Probability, Computer Science, Linear Algebra, Calculus, and even Game theory).
I know it's not just me. It's no wonder people are afraid of Machine Learning, people don't like Math! Even though understanding some of the very basic Mathematics behind Machine Learning will not only give you a good sense of how it works, but it'll get you far as a Machine Learning practitioner. And who knows, maybe you'll grow to like the Math, like me.
In this article, I'll attempt to give you a better understanding of what Machine Learning really is, and hopefully get rid of any fear of the subject you've been building up. Getting started solving real world problems using Machine Learning can be much easier than many are led to believe.
Machine Learning (ML) is the science of making machines perform specific tasks, without explicitly writing the algorithm for performing the tasks. Another definition would be making the machine learn how to perform some task from experience, taking into account some performance measure (how well it performs the task).
Let's consider these two popular problems:
Given some features of a breast tumor (i.e. its area and smoothness), predict whether the tumor is malignant or benign.
Given the monthly income of a house in California, predict the house's price.
Problem 1: Tumor Classification
Let's see. We are using two variable features of a tumor to determine whether it is malignant or benign, how can we go about solving this problem?
Well, we can try to come up with some logic to decide the class of the tumor. Maybe something like:
def tumor_class(tumor):
      area = tumor[0]
      smoothness = tumor[1]
      if area < 110 and smoothness < 0.07:
        return 'Malignant'
      elif area > 110 and smoothness < 0.07:
        return 'Benign'
      elif area < 110 and smoothness > 0.07:
        return 'Malignant'
      else:
        return 'Benign'
You can find and experiment with all the code on Google Colab.
But how can we know these threshold values (110 and 0.07)? How accurate is this algorithm? What if we had to use more than two features to predict the tumor's class? What if a tumor could belong to one of three or four classes? The program would become way too difficult for a human to write or read.
Let's say we have a table of 569 breast tumors that has three columns: the area, the smoothness, and the class (type) of tumors. Each row of the table is an example of an observed tumor. The table looks like this:
| Area | Smoothness | Class |
|---|---|---|
| 594.2 | 0.12480 | 1.0 |
| 1007.0 | 0.10010 | 0.0 |
| 611.2 | 0.08458 | 1.0 |
| ... | ... | ... |
A row of the table can be called an example, an instance, or a tuple. A column of the table can be called a feature.
In ML, the feature we want to predict is often called the target, or label.
Never mind the measurement of the area and smoothness, but pay attention to the Class column. Class 1 represents "Malignant", and class 0 represents "Benign".
Alright, now that we have some data, we can plot it and see if that'll help us:

The X axis represents the area of the tumor, while the Y axis represents its smoothness. Each data point (tumor) is colored orange if it's malignant, or green if it's benign.
Notice how the two classes are roughly separated. Maybe we can draw a line that (roughly) separates the two classes (any tumor under the line is malignant, and any above the line is benign):
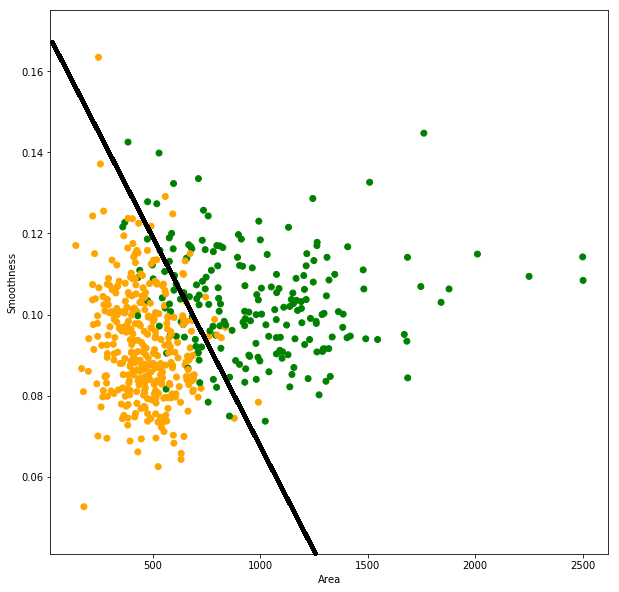
But what about the tumors that are misclassified? There are green points under the line, and orange points above it. If drawing a straight line is all we'll do, then we need to modify the line's equation in order to minimize the error.
Any straight line has the form: y = ax + b. Which means we can keep modifying a and b until the number of misclassified tumors is at its minimum. This is called the training process. We are using our data (experience) to learn the task of predicting tumor classes, with regard to how often we misclassify tumors.
aandbare called weights.aandxcan be vectors depending on the number of features we're using to predicty. In our case, the line's equation can be written asy = a[1]*x[1] + a[21]*x[2] + b, wherea[1]is the weight of the first feature (x[1], the area), anda[2]is the weight of the second feature (x[2], the smoothness).
The goal of the training process is to learn a function of the training features that predicts the target. Concretely, the function learned from training on our tumor data is a function that takes two arguments (area and smoothness), and returns the class of the tumor (0 or 1). This function is called the model.
Once the model is trained, we can start making predictions on new (previously unseen) breast tumors.
This entire process can be done in 13 lines of simple Python code:
from sklearn.datasets import load_breast_cancer
from sklearn.linear_model import LogisticRegression

cancer_data = load_breast_cancer()

# Despite its name, LogisticRegresssion is actually a classification model
classifier = LogisticRegression(solver='lbfgs', max_iter=5000)
classifier.fit(cancer_data.data[:,[3, 4]], cancer_data.target)

def tumor_type(tumors):
  y = classifier.predict(tumors)
  print(['Malignant' if y == 1 else 'Benign' for y in y])

tumor_type([
    [50, 0.06],
    [1500, 0.1], # Prints out:
    [200, 0.04]  # ['Malignant', 'Benign', 'Malignant']
])
This example uses Scikit-learn, a very popular Python ML library. But you're not limited to Scikit-learn or Python. You can do ML in any language you like. R and MatLab are pretty popular choices.
In ML, the problems where your goal is to predict a discrete label (e.g. spam/not spam, male/female, or malignant/benign) are called classification problems. Our tumor classification problem is more specifically a binary classification problem (the output is one of only two classes).
Since we used a line to separate the two classes and predict the class of any new tumor, our model is called a linear model.
Now let's look at a regression problem.
Problem 2: Predicting House Prices
Suppose that you have a dataset that contains 17,000 records of houses in California. And given the median monthly income of of a city block, you are tasked with predicting the median house value in that block.
Let's start by plotting the data that we have:
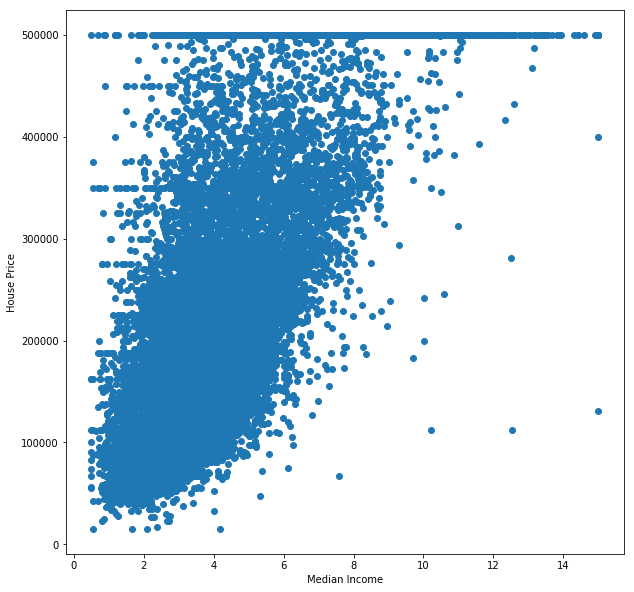
The X axis represents the median block income in thousands, and the Y axis represents the median house price of the block (in U.S Dollars).
Notice how we can roughly represent the relation between the income and price as a straight line:

What we can do now is modify our line's equation to get the most accurate result possible.
Again, we can do all of this with a few lines of Python code:
from sklearn.linear_model import LinearRegression
import pandas as pd

house_data = pd.read_csv('sample_data/california_housing_train.csv')
house_target = house_data['median_house_value']
house_data = house_data['median_income'].to_numpy().reshape(-1, 1)

regressor = LinearRegression().fit(house_data , house_target )

def house_price(incomes):
  print(regressor.predict([[i] for i in incomes]).tolist())

house_price([2, 7, 8])
# Prints out: [127385.28173581685, 338641.43861720286, 380892.66999348]
Now you might be saying "A straight line doesn't fit this data!", and I would agree with you. There are many things we can do to improve the performance of this model, like getting rid of some of the outliers in the data:
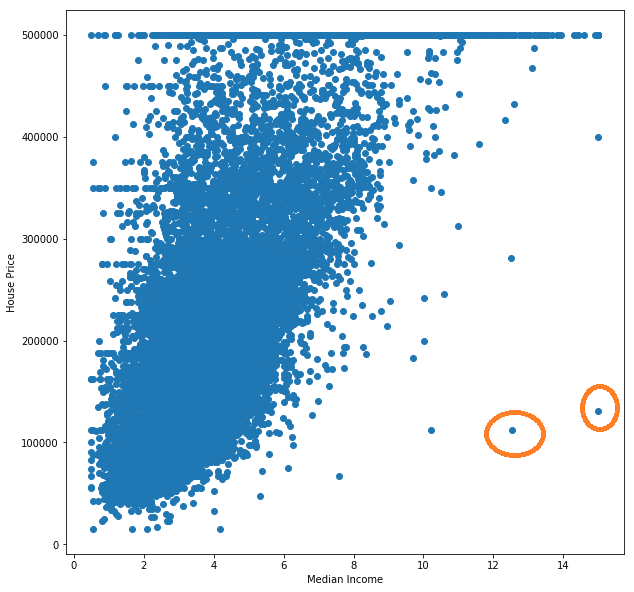
Which affects the training process. We could look for a feature that better relates to the price, or use multiple features of the houses to get a multidimensional line. We can also scale down the data to speed up the training process. We can even use a different kind of model.
Many steps can be takes before even starting to train a model that will immensely improve its performance (i.e. feature engineering and preprocessing). One might even decide that they don't have the right data for their purposes, so they start collecting it.
This problem is an example of a regression problem, which is a problem where the result of the prediction is a value belonging to a continuous range of values (e.g. price in Dollars, age in years, or distance in meters).
The two problems we looked at are examples of supervised ML problems. Which are essentially the problems where the data used is labeled, meaning the target feature's values are known in the training data (e.g. our tumor data was labeled malignant/benign, and our house data was labeled with the price). What would we do if our data isn't labeled?
I hope you're starting to see the big picture. ML is wide and deep, and it can get very difficult. But the basics are just that: basics.
If I've managed to spark your interest in the subject, then I'd like to point you to a few places where you can learn much more:
- Stanford's Machine Learning course on Coursera, which is also available on YouTube
- Khan Academy for all the basic Math
- Google's Machine Learning Crash Course
- O'Reily: Data Science from Scratch
- O'Reily: Introduction to Machine Learning with Python
- Google Colaboratory: a fully hosted Jupyter environment (you don't need to install or set up anything, just do it all here)
I found these resources very helpful. Pick and choose whichever feels comfortable for you.
I hope you found this article helpful, and I would love to read your opinions in the comments.


Top comments (0)