
Ruby on Rails makes writing web applications a pleasure. It’s a powerful and intuitive platform, built on an equally powerful and intuitive language. But that doesn’t mean it’s not worth taking the time to check your code for bottlenecks and performance problems before you ship. In this post, I’ll cover how to use Rack Mini Profiler to profile your Rails application.
You need to profile that code, no matter how poetically perfect you think it is.
I’ll show you how to install the gem, add some supporting tools, and use the profiler to illustrate what’s going on inside your app. I’ll keep the code simple so we can focus on the profiler features.
Let’s get to work!
Mini Profiler started as a tool for .NET applications, but it was ported to Ruby a few years ago as the Rack Mini Profiler. It uses Rails Rack middleware to intercept web requests and profile them.
It’s available as a gem; so to install it, add it to your Gemfile.
gem 'rack-mini-profiler'
Then, run bundle and start your application.
$ bundle install
$ rails s
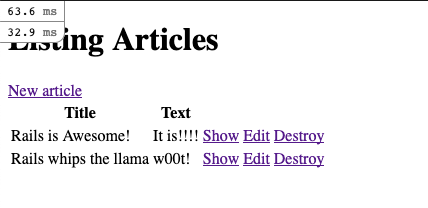
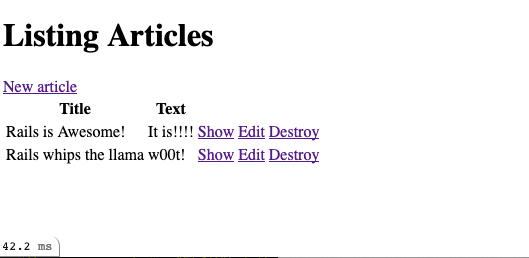
Point your browser at your application and load a page. I’m using the sample code from the Getting Started With Rails Guide.
Rack Mini Profiler added an indicator to the top left corner of the page with the total loading time displayed in it. Click on the indicator.
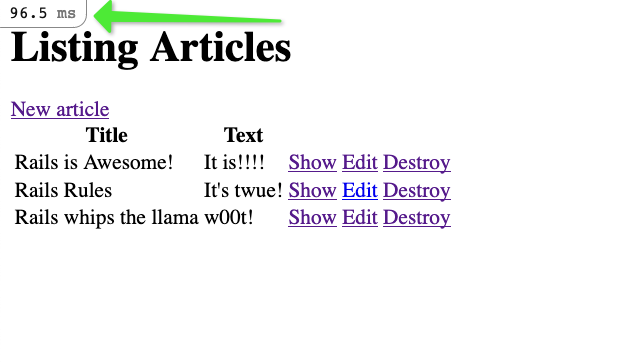
The indicator opens a window with details. You’ve installed the mini profiler! Let’s delve into the details.
Rack Mini Profiler is a deceptively simple tool. You’ve already seen how easy it is to add it to your app, but that’s only the beginning. Let’s take a look at its deep set of profiling features.
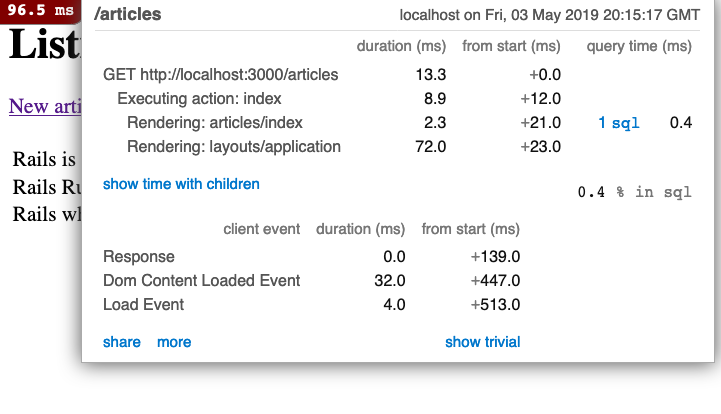
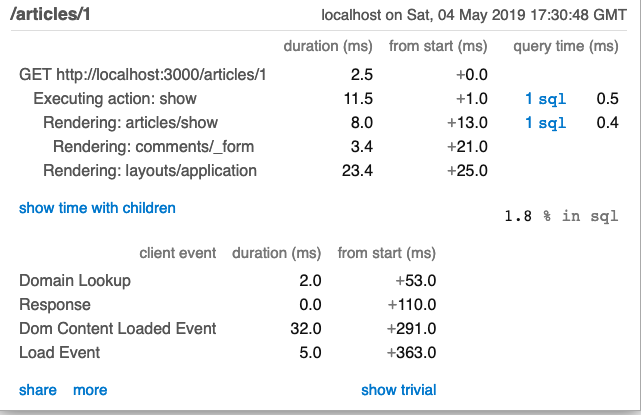
Here’s the full breakdown window we uncovered in the previous section.
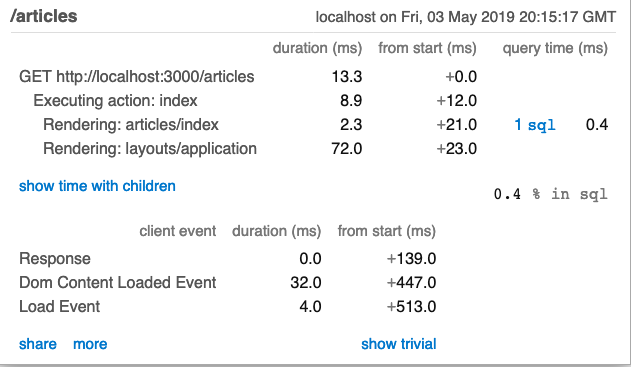
There’s a lot of information packed into this page. It starts at the top with the web request and then displays each of the calls Rails made to complete it. So, we can see how long each step took. There aren’t many surprises here. We’re running a straightforward page that only took about 100ms to load because it was the first request. We can even see that the sole SQL query took less than 1 millisecond to complete.
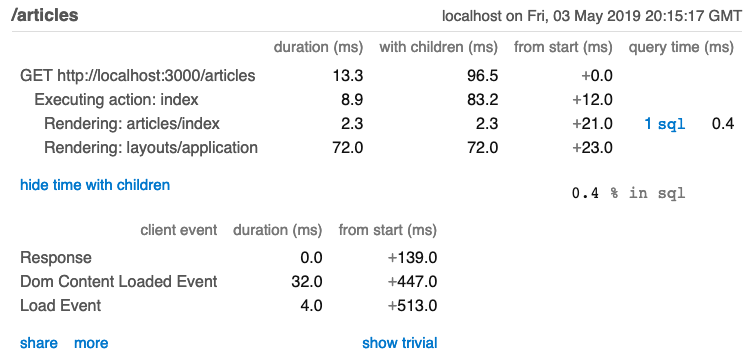
Click show time with children on your page.
This adds a column to the display with the cumulative time for each call. For a simple page like this, the extra column isn’t very useful. But for a complicated page, it might help find a bottleneck.
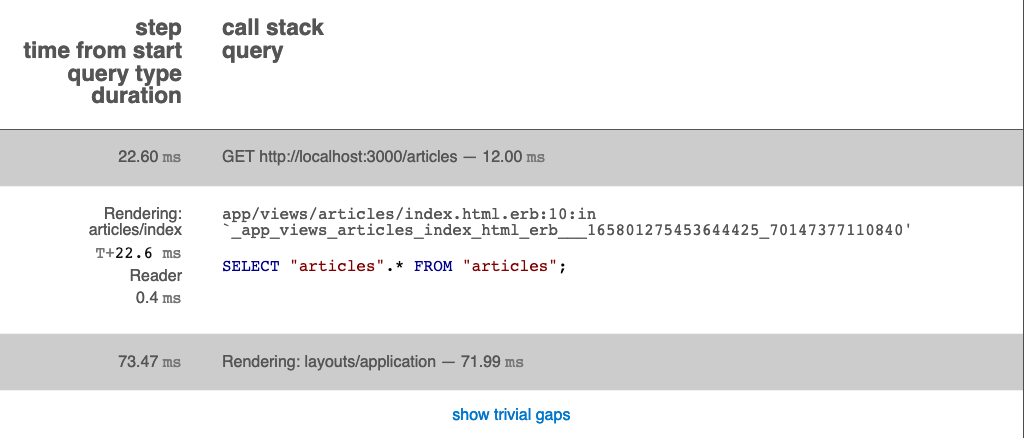
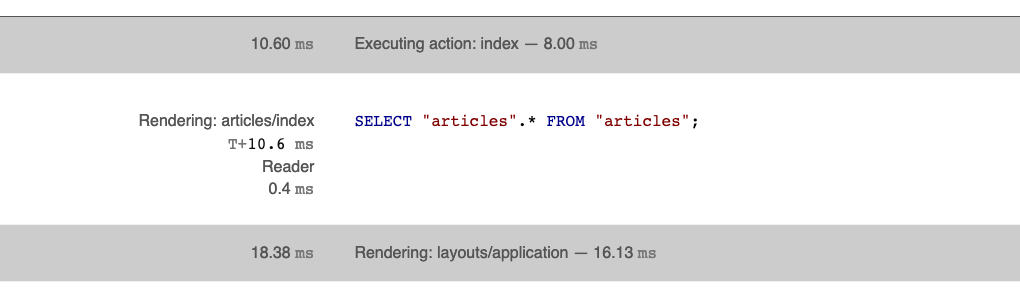
Now, click on the 1 sql link in the Rendering: articles/index row.

We already knew that the query ran in less than a millisecond, but now we can see precisely what the query was. Click outside of the window to return to the detailed breakdown. Then click on show trivial near the bottom.
Mini profiler displays more details about the page load.
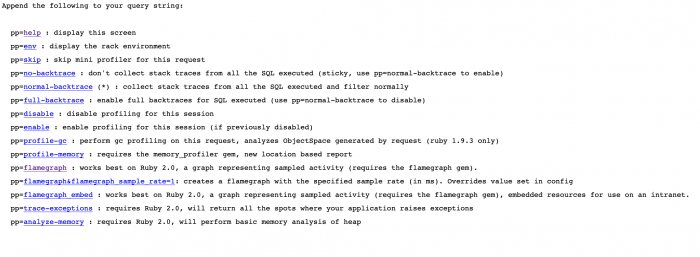
Finally, click on the more link on the bottom.
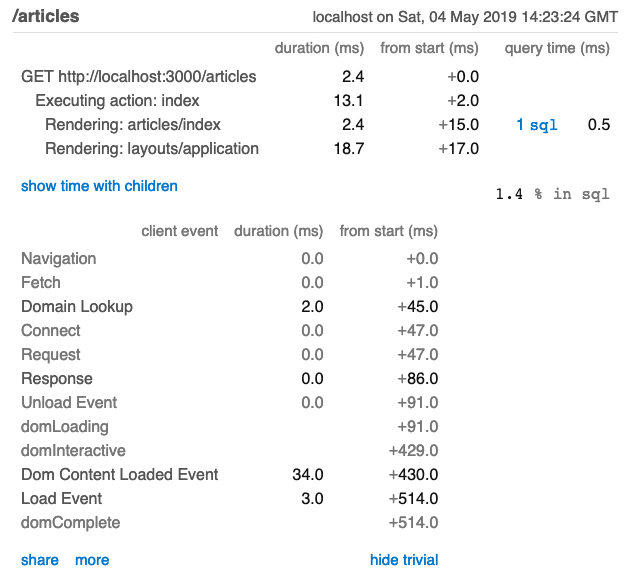
This is a list of query strings we can pass on requests to see different profiling options. Let’s take a look at a few of these options next.
Let’s take a look at the SQL information again.
Before we proceed, if you want complete traces of SQL calls with Rack Mini Profiler, make sure to add the gem after your SQL gems! It will recognize them and insert its instrumentation into the database queries.
This report tells us where the query was initiated from, but it’s not the complete call stack. Let’s retrieve a full backtrace.
First, reload the page with http://localhost:3000/articles?pp=full-backtrace
Now, click on the page load indicator and then the 1 sql link.
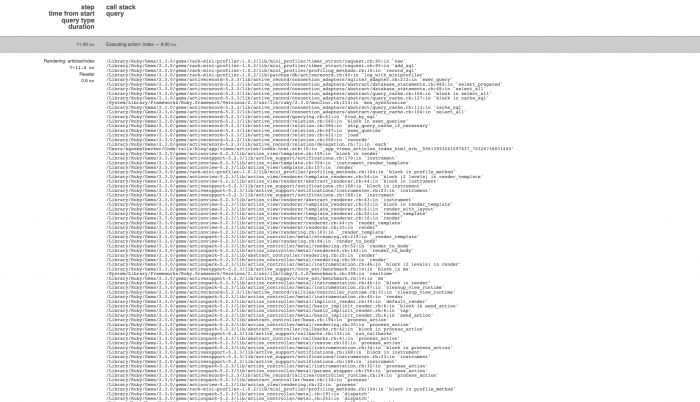
We see the entire backtrace! Full-backtrace is a “sticky” option. Remove the query option from the request and reload the page with http://localhost:3000/articles.
Recheck the SQL information, and the full backtrace is still there.
Load one of the articles and look at the query details.
There are two SQL queries there. Click on both, and you’ll see full backtraces.
So, let’s disable full backtraces. Request a page with http://localhost:3000/articles/1?pp=normal-backtrace. This toggles normal backtraces back on.
Even normal backtraces can be too much on a complicated page. You can turn them off completely with pp=no_backtrace. This option disables backtraces.
Like full-backtrace, no-backtrace is a sticky option. You need to request with normal-backtrace to reenable the stack display.
Load a page with the env query string. For example; http://localhost:3000/articles?pp=env
Now, Rack Mini Profiler displays the application’s environment. I’ve included mine here, with sections cut short so I can show all of them.
Rack Environment
---------------
rack.version: [1, 3]
rack.errors: #<IO:0x00007f98e70864c0>
rack.multithread: true
rack.multiprocess: false
rack.run_once: false
SCRIPT_NAME:
QUERY_STRING: pp=env
SERVER_PROTOCOL: HTTP/1.1
SERVER_SOFTWARE: puma 3.12.1 Llamas in Pajamas
GATEWAY_INTERFACE: CGI/1.2
REQUEST_METHOD: GET
REQUEST_PATH: /articles
...
Environment
---------------
TERM_PROGRAM: iTerm.app
TERM: xterm-256color
SHELL: /bin/bash
TMPDIR: /var/folders/wf/04v_kly57t93r4v6v1g6mnjc0000gn/T/
Apple_PubSub_Socket_Render:
/private/tmp/com.apple.launchd.xEwKV9iHKS/Render
TERM_PROGRAM_VERSION: 3.2.9
TERM_SESSION_ID: w2t0p0:EA0F6D74-CBD9-4D5E-B5C2-CBDACF7A59D5
USER: egoebelbecker
COMMAND_MODE: unix2003
SSH_AUTH_SOCK: /private/tmp/com.apple.launchd.s1KylUDlkB/Listeners
__CF_USER_TEXT_ENCODING: 0x1F5:0x0:0x0
PATH: /Library/Ruby/Gems/2.3.0/bin:/usr/local/bin:/usr/bin:/bin:/usr/sbin:/sbin:/usr/local/share/dotnet:~/.dotnet/tools:/Library/Frameworks/Mono.framework/Versions/Current/Commands:/Applications/Xamarin Workbooks.app/Contents/SharedSupport/path-bin
...
Ruby Version
---------------
2.3.7 p456
Internals
---------------
Storage Provider #<Rack::MiniProfiler::FileStore:0x00007f98e6fc9578>
User ::1
At the top, we see the Rack middleware environment. The mini profiler runs inside Rack, so this is what it sees from the web request.
Next, we see Ruby’s environment. I’m running my code in a terminal on a Mac, so you see details that make sense for my environment.
Finally, we see the Ruby version and details about mini profiler’s configuration.
Rack Mini Profiler is designed to be useful in a production environment. We’ll go into some details on how to set that up below. But for now, let’s look at how to turn the profiler on or off without restarting your application.
Entering a query with pp=skip prevents it from loading for a single page load.
You can reload it by going back with your browser.
To turn the profiler off, use disable. So, http://localhost:3000/articles?pp=disable would disable the profiler until it was re-enabled.
To turn it back on, use enable. For example, http://localhost:3000/articles?pp=enable turns the profiler on again.
Load the page with the analyze memory option: http://localhost:3000/articles?pp=analyze-memory
Instead of seeing the list of articles, you’ll see a plain text page that starts like this:
ObjectSpace stats:
TOTAL: 986800
FREE: 618915
T_STRING: 133092
T_ARRAY: 89557
T_IMEMO: 66160
T_HASH: 56139
T_DATA: 6229
T_CLASS: 5659
T_OBJECT: 5106
T_REGEXP: 1709
T_ICLASS: 1378
T_RATIONAL: 909
T_MODULE: 900
T_STRUCT: 558
T_SYMBOL: 402
T_FILE: 36
T_NODE: 18
T_BIGNUM: 15
T_FLOAT: 9
T_MATCH: 8
T_COMPLEX: 1
1000 Largest strings:
/**
* CoffeeScript Compiler v1.12.2
* http://coffeescript.org
*
* Copyright 2011, Jeremy Ashkenas
* Released under the MIT License
*/
...
Analyze-memory starts with a description of how much memory the application is using, with a breakdown by data type. Then it shows you the 1000 largest strings. In the case of this app, the longest strings are Javascript includes.
If you’re trying to track down a leak or optimize you’re application’s footprint, you can start here.
Memory analysis is often useful, but sometimes you need some information about the garbage collector. Load the page with this URL: http://localhost:3000/articles?pp=profile-gc
This loads a GC profiling request. It includes details on the request and the state of the garbage collector.
Overview
--------
Initial state: object count: 273949
Memory allocated outside heap (bytes): 60096010
GC Stats:
--------
count : 41
heap_allocatable_pages : 821
heap_allocated_pages : 2421
heap_available_slots : 986800
heap_eden_pages : 1600
heap_final_slots : 0
heap_free_slots : 614448
heap_live_slots : 372352
heap_marked_slots : 372351
heap_sorted_length : 2422
heap_swept_slots : 614781
heap_tomb_pages : 821
major_gc_count : 18
malloc_increase_bytes : 960
malloc_increase_bytes_limit : 32883343
minor_gc_count : 23
old_objects : 311924
old_objects_limit : 623848
oldmalloc_increase_bytes : 1344
oldmalloc_increase_bytes_limit : 19430339
remembered_wb_unprotected_objects : 56839
remembered_wb_unprotected_objects_limit : 113678
total_allocated_objects : 3986591
total_allocated_pages : 2422
total_freed_objects : 3614239
total_freed_pages : 1
...
That covers the basics. Let’s look at more advanced tasks you can do with the mini profiler.
The next step for examining your application’s memory is piling memory. To do this, you need to load another gem.
Add the memory profile gem to your gemfile:
gem 'memory_profiler'
Then, rerun bundle and start your application:
$ bundle install
$ rails s
Now, load a page with the profile_memory query: http://localhost:3000/articles?pp=profile-memory
Rack Mini Profiler loads a memory profile for you:
Total allocated: 1362064 bytes (16423 objects)
Total retained: 68237 bytes (518 objects)
allocated memory by gem
-----------------------------------
624437 sprockets-3.7.2
224713 set
…
allocated memory by file
-----------------------------------
224713 /System/Library/Frameworks/Ruby.framework/Versions/2.3/usr/lib/ruby/2.3.0/set.rb
224713 /System/Library/Frameworks/Ruby.framework/Versions/2.3/usr/lib/ruby/2.3.0/set.rb
89910 /Library/Ruby/Gems/2.3.0/gems/sprockets-3.7.2/lib/sprockets/path_utils.rb
…
allocated memory by location
-----------------------------------
85264 /System/Library/Frameworks/Ruby.framework/Versions/2.3/usr/lib/ruby/2.3.0/set.rb:83
63151 /Library/Ruby/Gems/2.3.0/gems/activesupport-5.2.3/lib/active_support/core_ext/marshal.rb:6
57249 /Library/Ruby/Gems/2.3.0/gems/sprockets-3.7.2/lib/sprockets/uri_tar.rb:17
46817 /System/Library/Frameworks/Ruby.framework/Versions/2.3/usr/lib/ruby/2.3.0/set.rb:313
43138 /System/Library/Frameworks/Ruby.framework/Versions/2.3/usr/lib/ruby/2.3.0/uri/rfc3986_parser.rb:22
32008 /System/Library/Frameworks/Ruby.framework/Versions/2.3/usr/lib/ruby/2.3.0/set.rb:360
29736 /Library/Ruby/Gems/2.3.0/gems/sprockets-3.7.2/lib/sprockets/base.rb:107
…
allocated memory by class
-----------------------------------
654085 String
210248 Hash
152008 Array
…
allocated objects by gem
-----------------------------------
9291 sprockets-3.7.2
1830 activesupport-5.2.3
…
allocated objects by file
-----------------------------------
1772 /Library/Ruby/Gems/2.3.0/gems/sprockets-3.7.2/lib/sprockets/uri_tar.rb
1656 /System/Library/Frameworks/Ruby.framework/Versions/2.3/usr/lib/ruby/2.3.0/set.rb
1656 /System/Library/Frameworks/Ruby.framework/Versions/2.3/usr/lib/ruby/2.3.0/set.rb
…
allocated objects by location
-----------------------------------
1213 /Library/Ruby/Gems/2.3.0/gems/sprockets-3.7.2/lib/sprockets/uri_tar.rb:17
717 /Library/Ruby/Gems/2.3.0/gems/activesupport-5.2.3/lib/active_support/core_ext/marshal.rb:6
…
allocated objects by class
-----------------------------------
9106 String
3227 Array
813 Hash
704 Proc
…
retained memory by gem
-----------------------------------
17113 set
15119 sprockets-3.7.2
…
retained memory by file
-----------------------------------
17113 /System/Library/Frameworks/Ruby.framework/Versions/2.3/usr/lib/ruby/2.3.0/set.rb
8868 /Library/Ruby/Gems/2.3.0/gems/sprockets-3.7.2/lib/sprockets/uri_tar.rb
6251 /Library/Ruby/Gems/2.3.0/gems/sprockets-3.7.2/lib/sprockets/cache/memory_store.rb
5945 /Users/egoebelbecker/Code/rails/blog/app/views/layouts/application.html.erb
…
retained memory by location
-----------------------------------
17113 /System/Library/Frameworks/Ruby.framework/Versions/2.3/usr/lib/ruby/2.3.0/set.rb:313
6320 /Library/Ruby/Gems/2.3.0/gems/sprockets-3.7.2/lib/sprockets/uri_tar.rb:62
6251 /Library/Ruby/Gems/2.3.0/gems/sprockets-3.7.2/lib/sprockets/cache/memory_store.rb:37
…
These results are very detailed, so I edited them for size and left off the last few categories. But, you can see how the profiler generates statistics and specifics by object, gem, class, and file.
One of Rack Mini Profiler’s most exciting features is flame graphs. Let’s turn them on and take a look.
Add two more gems to your application:
gem 'flamegraph'
gem 'stackprof'
Then, rerun bundle and start your server.
Finally, pull up a page with the flame graphs query: http://localhost:3000/articles?pp=flamegraph
Rails will display a flame graph of articles, instead of the list page.
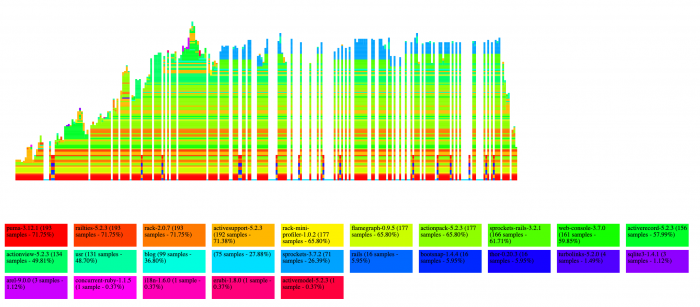
Place your mouse pointer over the graph portion of the page. Each row corresponds to a function. Click on it to get detailed frame info. Return to the graph, and use scroll up or down to zoom in or out. If you zoom in far enough, you’ll see method names.
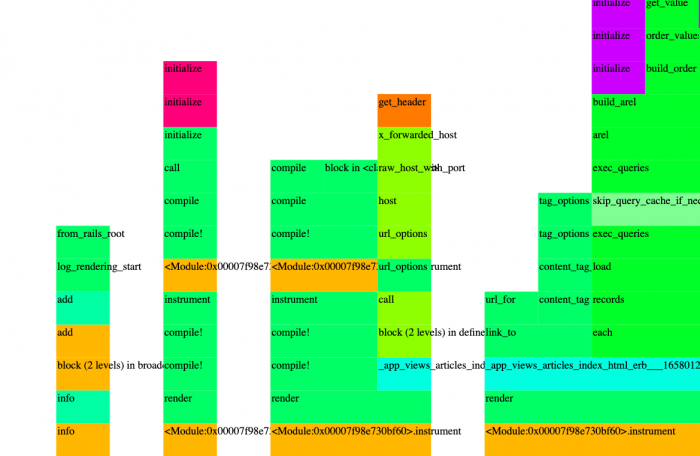
If you click on the method name, a window will open with details about the stack frame.
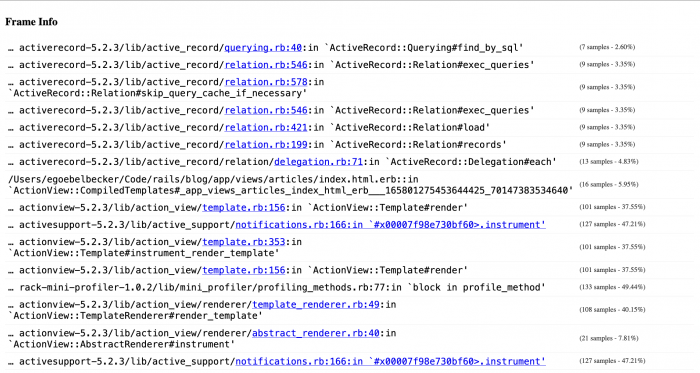
So, this is a concise way to represent a complete stack trace. But how do you read a flame graph?
First, you need to understand how the information is laid out.
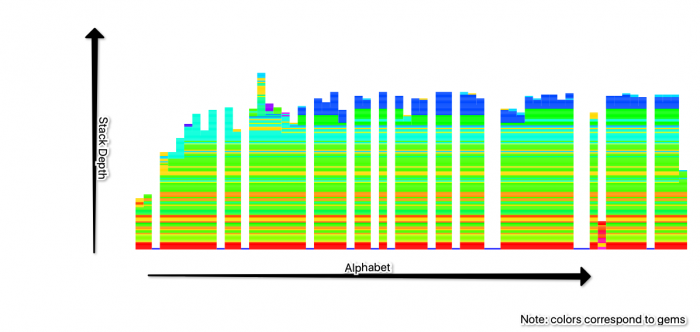
The stack frames are arranged from top-to-bottom, as they are in the stack. The topmost methods are on top, or outside, of the stack. The bottom methods are innermost.
Since the graph displays the call stack chronology from top to bottom, the methods are arranged alphabetically from left to right.
The colors do not correspond to time on the stack. Instead, each gem gets a color.
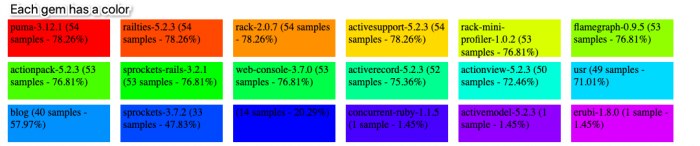
Mouse over each gem name on the bottom, and the graph highlights the corresponding frames. In this graph, the application is spending most of its time in the actionpack gem, which is part of Rails. This makes sense since the app doesn’t do much of anything.
Imagine you’ve isolated the problem to a specific method or section in your application. Now you want to focus your efforts there, so you want the Rack Mini Profiler to profile a specific method. You can do this by adding a few lines to your code. The mini profiler will work with any Ruby code, even outside of Rails.
Let’s imagine you’re dissatisfied with how quickly the sample Rails application deletes blog posts.
Here’s the code:
def destroy
    @article = Article.find(params[:id])
    @article.destroy
    @article.destroy
end
This method finds the requested article and calls its destroy method; then it redirects back to the listing page. The first two methods are the best candidates any bottlenecks. Let’s zoom in on both of them:
def destroy
    Rack::MiniProfiler.step('Find Article') do
        @article = Article.find(params[:id])
    end

    Rack::MiniProfiler.step('Destroy Article') do
        @article.destroy
    end

    redirect_to articles_path
end
Rack Mini Profiler’s step method accepts a name and a code block. We’ll wrap it around both methods, and pass in a different name so we can tell the traces apart.
Now, pick a post and delete it.
Mini profiler adds two indicators to the result page. One for the call to destroy and another for the redirect back to the blog listing. Click on the first indicator.
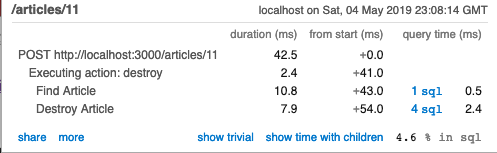
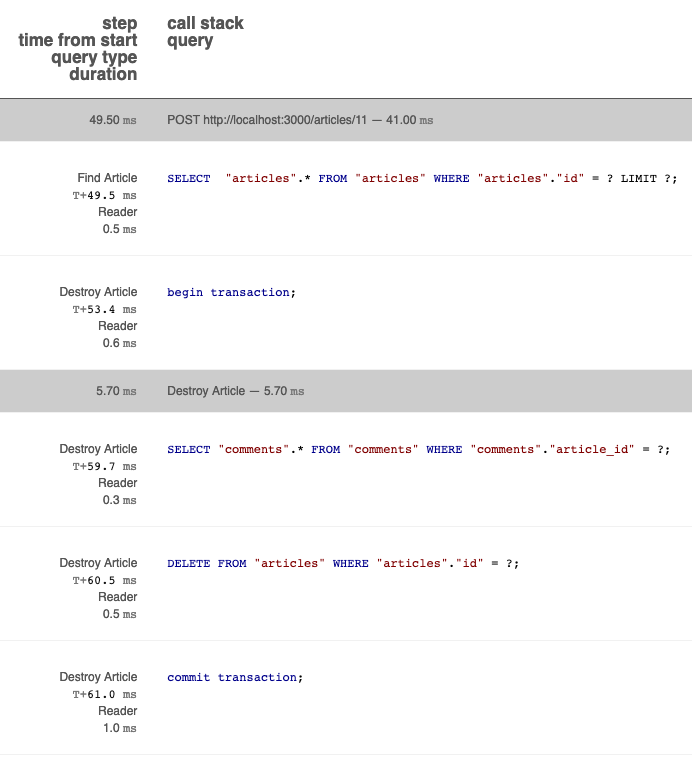
Both code blocks are listed by name. Click on the 4 SQL queries for Destroy Article.
Here are the SQL calls, with the same detail we saw for the first query we profiled:
Rack Mini Profiler can be configured to modify some of its behavior. To do this, you need to add an initializer class to Rails.
We’ll move the indicator to the bottom right-hand corner of the web page. Create a file in config/initializers named mini-profiler.rb, and add these contents:
require 'rack-mini-profiler'
Rack::MiniProfiler.config.position = 'bottom-left'
Restart the server and request a page.
The indicator moved to the bottom corner. There’s a complete set of configuration parameters on Rack Mini profiler’s Github page.
As I mentioned in the introduction, Rack Mini Profiler is designed to be useful in production environments. We already covered how to toggle it on and off with web queries. It’s also easy to control which users see the profiler.
Rack Mini Profiler will set its authorization_mode to :whitelist in production environments. This setting means that calls to the profile must be explicitly authorized with a call to authorize_request before they are run.
So, if your user’s name is stored in current_user, you can check to see if it’s an admin user and allow the call to be profiled:
before_action do
    if current_user && current_user.is_admin?
        Rack::MiniProfiler.authorize_request
    end
end
Mini Profiler will not enable :whitelist in development environments. It may also have problems enabling this mode in production if you enable the gem with require: false or are running outside of Rails. You can add the setting to your production configuration to make sure its enabled:
Rack::MiniProfiler.config.authorization_mode = :whitelist
Retrace for Ruby is a full-featured APM tool with complete support for Ruby. You can capture errors before users see them, instrument and profile your code. You can also redirect your logs to Retrace for search and analysis.
Retrace installs with a gem and requires a single configuration file. Once it’s installed, it will monitor and profile your code, and you can use its powerful web console tools to profile your code and capture errors.
Here’s a sample performance monitoring screen:
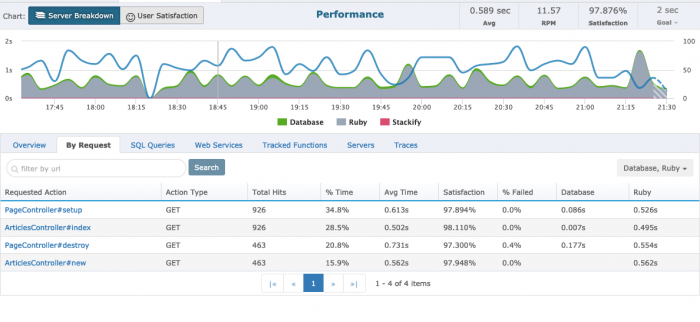
You can see a breakdown of web queries by percentage utilization and elapsed time.
Here’s a chart of SQL queries with similar information.
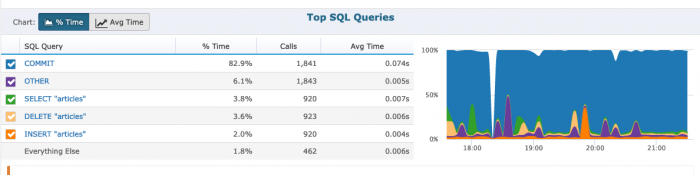
Like Rack Mini Profiler, Retrace is safe to run in production, but the information is saved to your console, where you can share it with other developers. You can compare historical data to new releases, and catch issues before they are a problem.
Ruby on Rails is a mature web framework that keeps getting better with every release. Rack Mini Profiler is an example of the powerful tooling Ruby developers have available to the to make their applications more responsive.
Fire up mini profiler and Retrace now and starting profiling!

Stackify's APM tools are used by thousands of .NET, Java, PHP, Node.js, Python, & Ruby developers all over the world.
Explore Retrace's product features to learn more.
If you would like to be a guest contributor to the Stackify blog please reach out to [email protected]


