Presentation charts are used to display important information with huge data and it is easy to catch readers’ eyes. There are many different types of data charts, such as column charts, bar charts, line charts, pie charts, scatter charts, doughnut charts and combination charts in PowerPoint slides. In this article we will show clearly how to create a chart in a PowerPoint document using Free Spire.Presentation for Java.
This article contains the following two parts:
*Create a single column chart in PowerPoint.
*Create a combination chart with column chart and line chart in PowerPoint.
Download Free Spire.Presentation jars
Code snippets of how to create a presentation column chart in Java:
import com.spire.presentation.*;
import com.spire.pdf.tables.table.*;
import com.spire.presentation.charts.*;
import com.spire.presentation.drawing.FillFormatType;
import java.awt.geom.Rectangle2D;
import java.lang.Object;


public class PPTColumnChart {
    public static void main(String[] args) throws Exception{
        //Create a presentation instance
        Presentation presentation = new Presentation();

        //Add a column clustered chart
        Rectangle2D.Double rect = new Rectangle2D.Double(40, 100, 550, 320);
        IChart chart = null;
        chart = presentation.getSlides().get(0).getShapes().appendChart(ChartType.COLUMN_CLUSTERED, rect);

        //Set chart title
        chart.getChartTitle().getTextProperties().setText("Sales Report");
        chart.getChartTitle().getTextProperties().isCentered(true);
        chart.getChartTitle().setHeight(30);
        chart.hasTitle(true);

        //Create a dataTable
        DataTable dataTable = new DataTable();
        dataTable.getColumns().add(new DataColumn("SalesPers", DataTypes.DATATABLE_STRING));
        dataTable.getColumns().add(new DataColumn("SaleAmt", DataTypes.DATATABLE_INT));
        dataTable.getColumns().add(new DataColumn("ComPct", DataTypes.DATATABLE_INT));
        dataTable.getColumns().add(new DataColumn("ComAmt", DataTypes.DATATABLE_INT));
        DataRow row1 = dataTable.newRow();
        row1.setString("SalesPers", "Joe");
        row1.setInt("SaleAmt", 250);
        row1.setInt("ComPct", 150);
        row1.setInt("ComAmt", 99);
        DataRow row2 = dataTable.newRow();
        row2.setString("SalesPers", "Robert");
        row2.setInt("SaleAmt", 270);
        row2.setInt("ComPct", 150);
        row2.setInt("ComAmt", 99);
        DataRow row3 = dataTable.newRow();
        row3.setString("SalesPers", "Michelle");
        row3.setInt("SaleAmt", 310);
        row3.setInt("ComPct", 120);
        row3.setInt("ComAmt", 49);
        DataRow row4 = dataTable.newRow();
        row4.setString("SalesPers", "Erich");
        row4.setInt("SaleAmt", 330);
        row4.setInt("ComPct", 120);
        row4.setInt("ComAmt", 49);
        DataRow row5 = dataTable.newRow();
        row5.setString("SalesPers", "Dafna");
        row5.setInt("SaleAmt", 360);
        row5.setInt("ComPct", 150);
        row5.setInt("ComAmt", 141);
        DataRow row6 = dataTable.newRow();
        row6.setString("SalesPers", "Rob");
        row6.setInt("SaleAmt", 380);
        row6.setInt("ComPct", 150);
        row6.setInt("ComAmt", 135);
        dataTable.getRows().add(row1);
        dataTable.getRows().add(row2);
        dataTable.getRows().add(row3);
        dataTable.getRows().add(row4);
        dataTable.getRows().add(row5);
        dataTable.getRows().add(row6);

        //Import data from dataTable to chart data
        for (int c = 0; c < dataTable.getColumns().size(); c++) {
            chart.getChartData().get(0, c).setText(dataTable.getColumns().get(c).getColumnName());
        }
        for (int r = 0; r < dataTable.getRows().size(); r++) {
            Object[] datas = dataTable.getRows().get(r).getArrayList();
            for (int c = 0; c < datas.length; c++) {
                chart.getChartData().get(r + 1, c).setValue(datas[c]);

            }
        }

        chart.getSeries().setSeriesLabel(chart.getChartData().get("B1", "D1"));
        chart.getCategories().setCategoryLabels(chart.getChartData().get("A2", "A7"));
        chart.getSeries().get(0).setValues(chart.getChartData().get("B2", "B7"));

        chart.getSeries().get(1).setValues(chart.getChartData().get("C2", "C7"));

        chart.getSeries().get(2).setValues(chart.getChartData().get("D2", "D7"));
        chart.getSeries().get(2).getFill().setFillType(FillFormatType.SOLID);
        chart.getSeries().get(2).getFill().getSolidColor().setKnownColor(KnownColors.LIGHT_BLUE);

        //Set overlap
        chart.setOverLap(-50);

        //Set gap width
        chart.setGapDepth(200);

        //Save the document
        presentation.saveToFile("output/CreateChart.pptx", FileFormat.PPTX_2010);
    }
}
Effective screenshot of column chart:

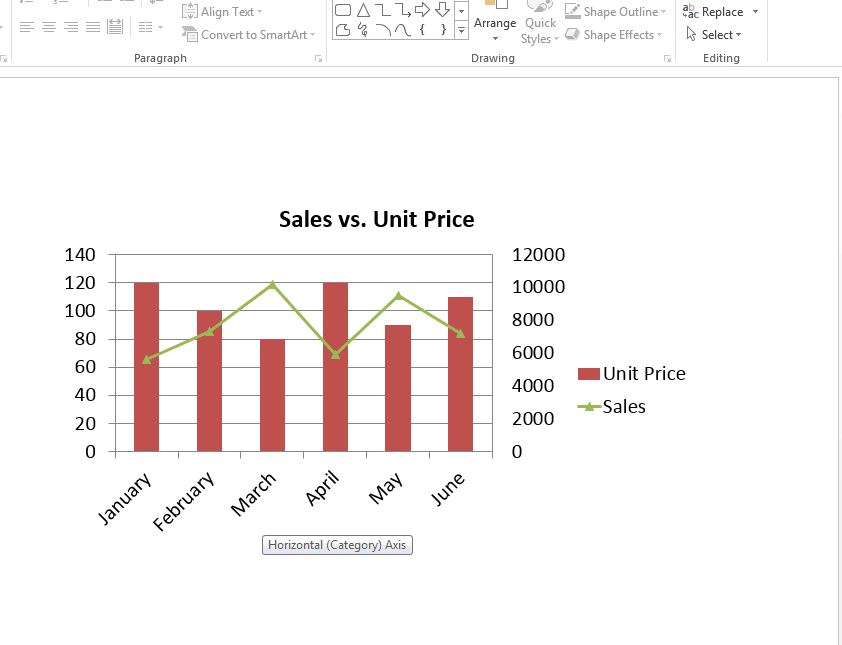
A combination chart is a chart that combines at least two chart types in a single chart, this example will show a combination chart with column chart and line chart.
import com.spire.presentation.*;
import com.spire.presentation.charts.*;
import com.spire.presentation.drawing.FillFormatType;
import java.awt.geom.Rectangle2D;


public class CombinationChart {
    public static void main(String[] args) throws Exception{

            //create a PowerPoint document
            Presentation presentation = new Presentation();

            //insert a column clustered chart
            Rectangle2D.Double rect = new   Rectangle2D.Double(50, 100, 550, 300);
            IChart chart = presentation.getSlides().get(0).getShapes().appendChart(ChartType.COLUMN_CLUSTERED, rect);

            //set chart title
            chart.getChartTitle().getTextProperties().setText("Sales vs. Unit Price");
            chart.getChartTitle().getTextProperties().isCentered(true);
            chart.getChartTitle().setHeight(30);
            chart.hasTitle(true);

            //write data to chart as chart data
            chart.getChartData().get(0,0).setText("Month");
            chart.getChartData().get(0,1).setText("Unit Price");
            chart.getChartData().get(0,2).setText("Sales");
            chart.getChartData().get(1,0).setText("January");
            chart.getChartData().get(1,1).setNumberValue(120);
            chart.getChartData().get(1,2).setNumberValue(5600);
            chart.getChartData().get(2,0).setText("February");
            chart.getChartData().get(2,1).setNumberValue(100);
            chart.getChartData().get(2,2).setNumberValue(7300);
            chart.getChartData().get(3,0).setText("March");
            chart.getChartData().get(3,1).setNumberValue(80);
            chart.getChartData().get(3,2).setNumberValue(10200);
            chart.getChartData().get(4,0).setText("April");
            chart.getChartData().get(4,1).setNumberValue(120);
            chart.getChartData().get(4,2).setNumberValue(5900);
            chart.getChartData().get(5,0).setText("May");
            chart.getChartData().get(5,1).setNumberValue(90);
            chart.getChartData().get(5,2).setNumberValue(9500);
            chart.getChartData().get(6,0).setText("June");
            chart.getChartData().get(6,1).setNumberValue(110);
            chart.getChartData().get(6,2).setNumberValue(7200);

            //set series labels
            chart.getSeries().setSeriesLabel(chart.getChartData().get("B1", "C1"));

            //set categories labels
            chart.getCategories().setCategoryLabels(chart.getChartData().get("A2", "A7"));

            //assign data to series values
            chart.getSeries().get(0).setValues(chart.getChartData().get("B2", "B7"));
            chart.getSeries().get(1).setValues(chart.getChartData().get("C2", "C7"));

            //change the chart type of series 2 to line with markers
            chart.getSeries().get(1).setType(ChartType.LINE_MARKERS);

            //plot data of series 2 on the secondary axis
            chart.getSeries().get(1).setUseSecondAxis(true);

            //hide grid links of secondary axis
            chart.getSecondaryValueAxis().getMajorGridTextLines().setFillType(FillFormatType.NONE);

            //set overlap
            chart.setOverLap(-50);

            //set gap width
            chart.setGapDepth(200);

            //save the document
            presentation.saveToFile("output/CombinationChart.pptx", FileFormat.PPTX_2010);
        }
}
Effective screenshot of combination chart
Conclusion
Thanks to Free Spire.Presentation for Java, I’m able to show you how to insert presentation chart programmatically in Java. I hope you could have a deeper understanding of chart tools on presentation slides after reading my article. Thanks for reading.


Top comments (0)