
Using Machine Learning to Improve the Maintenance Experience for Residents
/Introduction
Maintenance is a big part of a property manager’s (PM) job. It is an important service to residents and a great way to establish a positive relationship with them.
For PMs that use AppFolio, the typical workflow for a maintenance request is as follows. The resident identifies an issue and notifies their PM of it, either by calling them over the phone or submitting a service request through their online resident portal. The PM then assesses the urgency of the issue and chooses who to dispatch in order to fix it.
In this blog post, we focus on the case where the resident submits an issue through the online portal. When the resident submits a maintenance request through the portal the first thing they have to provide is a short description (950 characters max) of their issue. They then have to choose one of 23 categories for their issue. If no category is a good fit for their issue, they can choose the ‘Other’ category.
Assigning the right category to an issue is important because different categories have different guidelines, levels of urgency, and preferred vendors. Improving the accuracy of the categorization can reduce the number of errors and speed up issue handling, ultimately providing a better experience to the resident.
Choosing the right category may seem obvious, but it is actually not always that easy and we found that tenant choose the wrong category quite often. Our goal was to see if machine learning could help with the classification.
It did. In the rest of this post, we detail the approach that we followed, and how using machine learning led to interesting findings on the categories.
Text classification problem
We formulate this problem as a text classification task. A text classification problem consists in assigning a class to a document. A document can be a word, a sentence or a paragraph. We have more than 500,000 maintenance requests that we can use to train a supervised classifier.
Here’s an example of a maintenance request.

Pre-processing
The first step is to turn the text into a numerical vector by applying “word embedding” so that our machine learning algorithm can make sense of the words. In order to have vectors of the same dimension for each of the vectors representing a description, we simply count the number of occurrences of each token, a technique called bag of words. To reduce the impact of common but not informative words, we apply tf-idf on the result of the bag of words.

This is an example of how the pre-processing steps in our approach.
Classifier
To choose the classifier, we want a probabilistic model that can fit well to embedding. If the data is normally distributed, then a normal distribution is perfect to describe it. If the data is very sparse, a selective probability measure is a better choice. Applying bag of words embedding on a large corpus results in sparse matrix, so a selective distribution like logistic distribution will be a good fit.
So here is a summary of our baseline model: a bag-of-words feature extraction + tf-idf weighting + SGD Logistic classifier. This setup achieves an accuracy of 83%. Simple and yet a pretty good accuracy to start with!
Using more advanced methods in any steps above should improve our results. We tried the the following:
Preprocessing: blacklist non-domain specific stop words, removing non-english requests.
Embedding: pre-trained word2vec at different dimensions.
Complicate model family: Tree based, boosting algorithm, 2-layers CNN…
But it didn’t improve on our baseline. Complex models like boosting and CNN even have a worse performance. We wanted to understand why and started digging into the data. We found the following problems, which we detail in the rest of the post:
Traditional NLP problems: noise in data and labels.
Variation in the resident’s intent when they submit a request: symptoms vs. cause vs. treatment.
Out-of-box embedding won’t work, domain context is required
Noise in data and in labels
Multiple issues (noisy data)
A frequent source of errors was that the resident reported two issues at the same time. For example:
The issue: “There seems to have been some property damage from the high winds over the past few days. Dozens of shingles have blown off the roof, and 3 sections of the privacy fence have blown down. Not just the fence panels, but at least 3 of the posts have broken.” actually includes two issues: “fence_or_gate_damaged” and “roof_missing_shingles”.
We formulated that as a separate binary classification problem and changed the UI of the resident portal to try and dissuade the resident from reporting multiple issues. The results of this classification are out of scope for this post.
Contradicting labels (noisy labels)
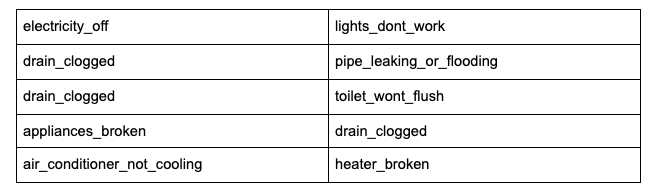
Below are the labels that residents chose when the description of their issue simply said “Plumbing”.

It shows that requesters have different opinions to “Plumbing” due to their own knowledge, or that their description of the issue was too generic. The example will confuse the model at every occurrence of the word “plumbing”. For a meta-algorithm like boosting, this “wrong” label will be emphasized.
Reporting symptom vs. cause vs. treatment
Symptom vs. cause
By looking at confusion matrix, we can see that errors mainly came from several misclassification pairs.

These pairs include
There is a mix of cause and symptom on what we try to predict. The request “my room is dark and I’m pretty sure it’s not the light bulb issues because I bought the light bulb yesterday.” can be classified as “electricity_off” because the tenant is answering the cause of the problem. The causal chain can keep extending: appliances_broken could lead to drain_clogged, which could further lead to toilet_wont_flush. Depending on her knowledge, the resident may report any of the three issues.
We can’t say any of them is nonsense, but which helps us solve the problem? Can we find an expert capable of fixing all these issues? If not, can we ask the resident to describe the problem and infer the cause separately?
Treatment
Additionally to the cause and the symptom of the issue, the description may also contain some treatment information.
Requesters often have the least knowledge about what the treatment could be (otherwise they could fix the issue themselves). When asked to describe the issue, chances are they guess a vague and sometimes misleading treatment. Consider the request earlier about the garage lights not working. The resident gave the hypothetical reason and the treatment. This may increase the chance that issue gets predicted as “electricity_off”.
Mixing the symptoms, treatment, and cause of an issue will result in different ways of reporting the same issue, which will confuse the classifier.

The problem with out-of-the-box embedding
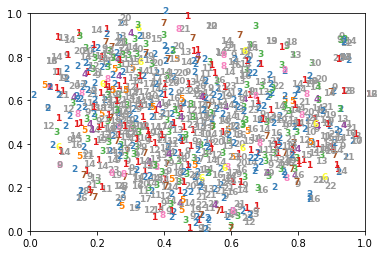
Pretrained Word2Vec MCC examples

Maaten, L.V., & Hinton, G.E. (2008). Visualizing Data using t-SNE.
We mentioned word2vec for embedding is usually a good way to improve performance in NLP problems. It didn’t work in our case.
The first image shows a 2D t-SNE projection of 100-D word2vec vectors, a state-of-art word embedding models. Each colored number is a maintenance request’s class ranging from 1 to 23. Each request embedding is a tf-idf weighted summation of pre-trained word2vec word embedding. Unlike the t-SNE visualization of learned features in the MNIST dataset (2nd figure), the clusters are not obvious, meaning that our classifier has to fit very hard to the skewed boundary. To some gaussian based classifiers, it’s almost impossible. The only thing obvious is pre-trained word2vec is not sufficient.
Improvement
Our error analysis has shown that our ground truth data is quite noisy (multiple issues, multiple labels for the same description, etc.). This leads to a lower perceived performance of the model than what it can really be in reality. Indeed, if someone writes “Plumbing” and the classifier chooses ‘pipe_leaking’ rather than “toilet_wont_flush”, is that truly an error? Probably not. Similarly, if a user mentions two issues belonging to multiple categories in a single description and the classifier picks the category corresponding to one of the issues but the resident picks the other one, this shouldn’t be considered as an error.
To assess the true performance of the model, we created a hand-labeled benchmark. We also learned that using out-of-the-box embeddings doesn’t work as well in our given context. We explore how to put domain context into embeddings with a superior language understanding algorithm, BERT
Creating a benchmark to assess the true performance or our model
We randomly selected 200 examples where the classifier made the wrong recommendation despite having an 80% or higher confidence rate. All examples in this benchmark were relabeled by the team. Following are two examples where our labels matched the model’s prediction.
When considering our manual labels as the truth (as opposed to what the tenant chose in reality) the baseline classifier achieves over 87% of accuracy on these 200 examples. There are two main reasons for this: first, the tenant just seems to have picked something random, and the classifier actually is better at choosing the right category. Second, both the tenant and the classifier were right, there were just multiple issues. In this last case, we considered that the classifier was right and didn’t count this as a classification error.
Assuming this benchmark is representative of the whole dataset, this means that an 87% accuracy of what we thought were failed predictions is now right. Remember that our accuracy rate was 85% so the adjusted accuracy is actually 85 + 0.87*15 = 98.5%.
In practice, we can adjust the confidence threshold to where we can safely handover the categorization to the model, and fall back to human categorization for lower confidence predictions. That is huge, because over 40% of our predictions has at least 80% of confidence. If a 5% error rate is acceptable, then we save almost half of the human categorization effort!

error rate to confidence level
Adding domain context into embedding with superior language understanding
Long term, we also want to clarify what each category means and possibly remove some and add some others to better match the real use cases.
In the extracted dataset, one third of the issues are categorized as “Other”. The “Other” category cannot have specific vendors and instructions and is therefore more time-consuming for property managers to handle. Finding new specialized categories is therefore valuable. We can find the new categories by clustering the issues.
We applied an agglomerative base hierarchical clustering algorithm on BERT-Base, Uncased embedding. The algorithm uses bottom-up approach to minimize the increased inter-cluster variance during agglomeration.
We tried lowering the number of clusters from 100 to 10 and see what clusters emerged consistently. Here we witness the power of good embedding again. Before fine-tuning, clustering result with the out-of-box embedding is long-tailed. The largest category consists of 1106 out of 10K examples we clustered. After fine-tuning, the largest population cut down to 289 examples. What’s more, the largest cluster is meaningful too.
Below are the top 3 issues we discovered. We tagged each cluster by top tf-idf keywords to summarize the cluster.

‘Stove in my room it’s not good. Can you change please? Monday and Tuesday you can come to do it thanks’,
‘Stove handle broke off. Need new window shade for the front living room.’,
‘The garbage disposal shoots up throught the other side of the sink. The furnace has yet to be fixed and it continues to go out frequently ‘,
Other categories we discovered includes outlet not working, lease agreement, mailbox key lost, unpaid rent, loud music or appliance noise, snow, and roaches.
Issues reported in Cluster 1 are very close to an existing category (“door_wont_lock”). Why did residents not choose “door_wont_lock”? This is unclear, but the most likely explanation is that the resident may not have seen the issue or didn’t bother to read all 23 categories and just selected “Other” instead. The fact that existing categories are at the top of issues in the uncategorized issue implies that we could potentially break the current labeling. If an existing category is relevant it will still emerge as a significant cluster.
With this approach, new label is data-driven and therefore free from human subjective. As long as we have enough data, we can confidently believe future requests won’t be too surprising to be categorized correctly.
Such impressive clustering is possible thanks to BERT. BERT learned the context by fine-tuning a few last layers of its complicated network to a domain specific task, while fixing the rest of network as it was. We particularly fine tuned the BERT model on previous single issue classification task. Using the smallest pretrained network BERT-Base, Uncased, which has 12-layer, 768-hidden, 12-heads, 110M parameters. Thanks to the Transformer’s nature, which BERT architecture based on, it can learn long range inter-words relationships, but also makes training more expensive. With fine-tuning we can leverage the massive pretrained network with only 6hr training on ml.p3.2xlarge AWS instance.
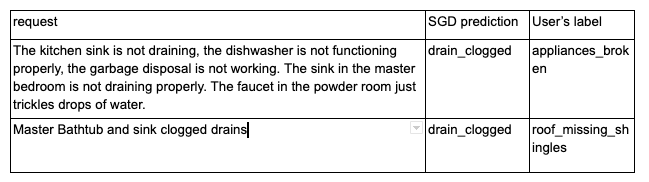
BERT also did well on the original classification task. Compared with SGD on the benchmark, BERT has more predictions exactly the same as requester’s label. In fact, BERT’s prediction is 50% more aligned with user’s label and 30% more correct than SGD. Two cases are illustrated below respectively.

Conclusion
NLP can be very valuable in solving the real world of assigning a category to a maintenance request submitted by a resident. A simple approach yielded a decent 83% classification accuracy.
This is especially good in the light of the noise in the data, which is a normal problem in real world problems. Assessing the performance on a hand-labeled subset of the data showed that the true accuracy would be 98.5%.
Some of the noise could be mitigated going forward through a better user interface (multiple issues) or a redesign of the categories. However, some of the noise seems hard to control for because it depends on the user’s knowledge and way of reporting an issue (cause vs. symptom vs. treatment).
Using BERT could further improve the classification accuracy. BERT is also useful to discover new categories which could contribute to reducing the amount ‘Other’ issue.
If you find this type of work interesting, come and join our team we are hiring!