This article was written in collaboration with the Kotlin team at JetBrains.
At Uber, we strive to maintain a modern tech stack in all our applications. A natural progression in the Android space was to start adopting Kotlin, a modern multi-platform programming language and an increasingly popular alternative for Android development that fully interoperates with Java.
However, with over 20 Android applications and more than 2,000 modules in our Android monorepo, Uber’s Mobile Engineering team had to carefully evaluate the impact of adopting something as significant as a new language. The many important facets to this evaluation include developer productivity, interoperability, run and build performance overhead, developer interest, and static code analysis. On top of these developer considerations, we had to ensure that this decision didn’t impact the Uber user experience on our Android apps.
To facilitate the success of this adoption, we launched an initiative, in collaboration with JetBrains, to measure Kotlin build performance at scale across different project structures, a process that informed our decisions for best practices for Android development.
Design considerations
The goal was simple: measure Kotlin build performance at scale and understand the tradeoffs of different project structures. To achieve this, we established the following conditions for our model structures:
- Code should be functionally-equivalent. This does not necessarily mean that Kotlin or Java sources would be identical in implementation, just that they reflected functional parity for how we would potentially write it in that language (for example, Gson TypeAdapter vs. Moshi JsonAdapter).
- Code should be non-trivial. Trivial examples are not enough, as they often do not reflect real world conditions. To most accurately execute our tests, we needed to leverage non-trivial code we would use in production environments.
- There should be lots of large, diverse modules. We want to measure not only by volume of projects, but also see how individual Kotlin projects scale with size.
We were in a unique position to perform such a measurement because we generate our network API models and services for Android from Apache Thrift specifications. On the wire, these are sent as JSON using a Retrofit/OkHttp/Gson based network stack. Structs/exceptions/unions are generated as standard value types (POJOs). We generate one project per .thrift file, and projects can depend on other generated projects that match the Thrift “include” statements.
This project structure results in 1.4 million lines of code (LoC) across 354 different projects that we can compare. Additionally, since code is generated, we can control the morphology of these projects; for instance, we can generate them with only Java code, or only with Kotlin code, a mix between the both of them, and enable or disable annotation processors, among other combinations.
Based on configurability, we came up with a matrix of 13 different scenarios for fine-grained understanding of different project structures and tooling tradeoffs:
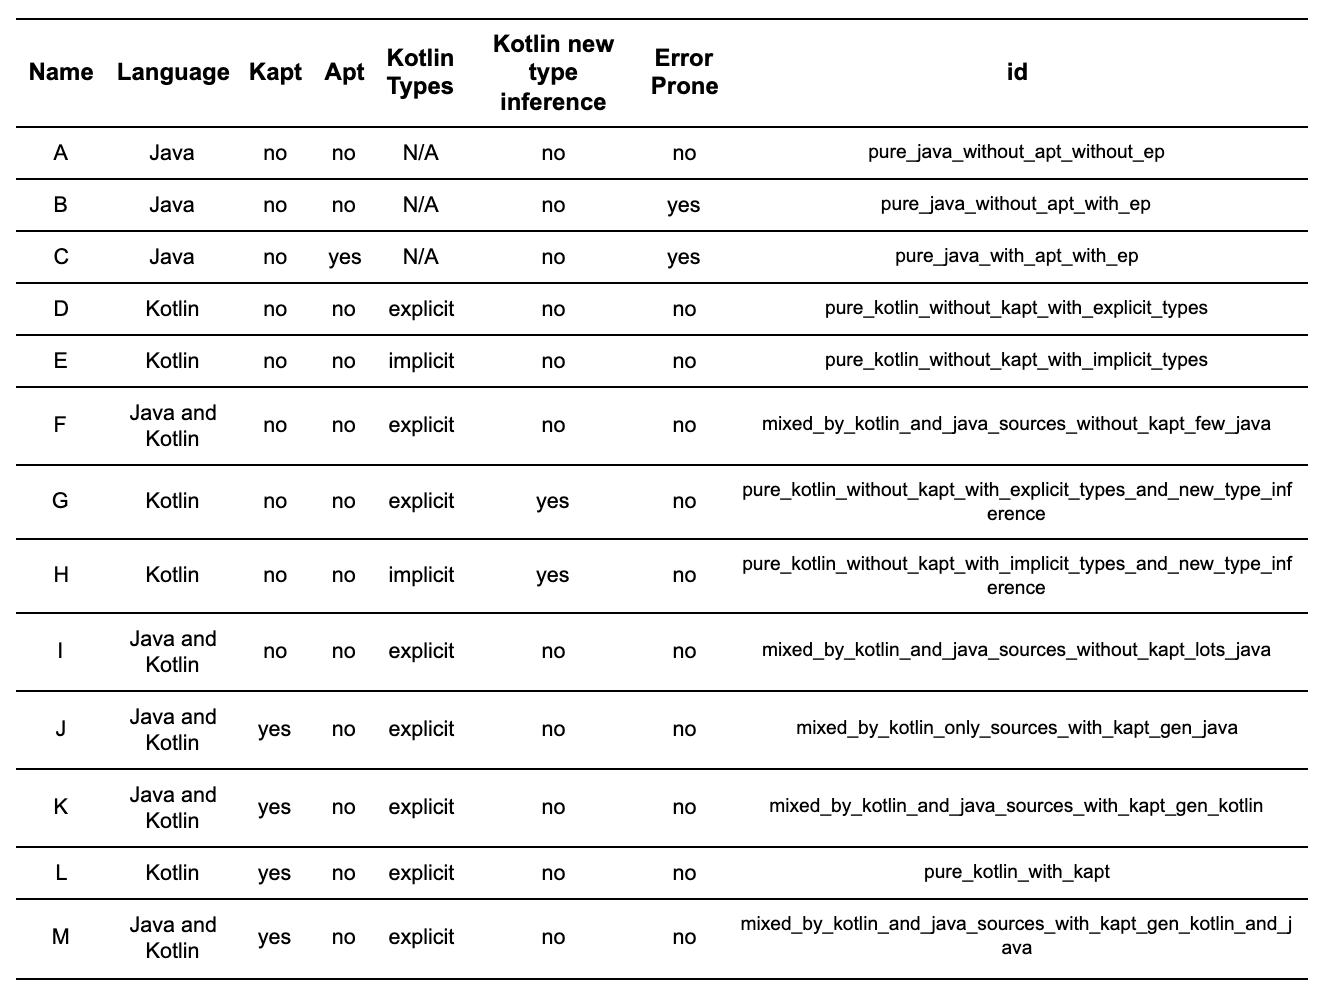
We named the process of generating the 354 projects for each of the 13 configurations an experiment. In total, we successfully ran 129 experiments.
Additional design notes and caveats
Below, we highlight some additional design considerations and knowledge we had in mind before embarking on this project:
- Uber already used Buck as our Android/Java build system, so we did not test using tools like the Kotlin Gradle daemon and incremental Kapt.
- During this benchmark test, builds were clean and the cache was turned off. Buck caches the result of already computed rules to speed up future builds, definitely something you don’t want to do while performing a benchmark to reduce variability between runs.
- Buck’s multi-thread build was turned off. Since we cannot infer that the work performed by each thread throughout a build execution is deterministic, we do not want multi-thread mode to interfere with the times from the compiler thread.
- We wanted to measure pure kotlinc/javac performance, and as such, did not use Kotlin’s compiler avoidance functionality. Compiler avoidance/caching mechanisms can vary significantly between build systems, so we decided not to index on it for this project.
- We decided to execute our experiments in our CI machines because these experiments ran so slowly, and our CI boxes were much more powerful than personal machines.
- These are pure JVM projects. Android projects may have other considerations such as resources, R classes, android.jar and Android Gradle Plugin.
- Buck support for Kotlin was added by the open source community and it is not being actively maintained. This may have implications on performance in the sense that Buck’s implementation may not be as heavily optimized as first-party tools.
- Analysis that involves project size comparison was done entirely at the source code level, and no generated bytecode was taken into account.
- Our build performance data relates to compilation time rather than build time. Build times are tightly coupled to the build system in use, e.g., Gradle Incremental Builds or Buck Parallel building. We wanted our analysis to be build system agnostic and keep the focus as close to kotlinc vs. javac as possible.
Based on these considerations, we created a project generation workflow that enabled us to develop hundreds of models with which to compare build performance for our new Kotlin-based applications.
Project generation workflow
Our standard model generation pipeline is a simple command line interface around a project generator. It reads from a directory of Thrift specs, infers project dependencies, and then generates a flat set of projects that reflect those specs. These projects, in turn, contain a Buck file with a custom genrule that invokes the code generator to generate the appropriate source files for the project. During our build performance experiments, we ran all the code gen pieces separately so the only measured piece is the compilation step.
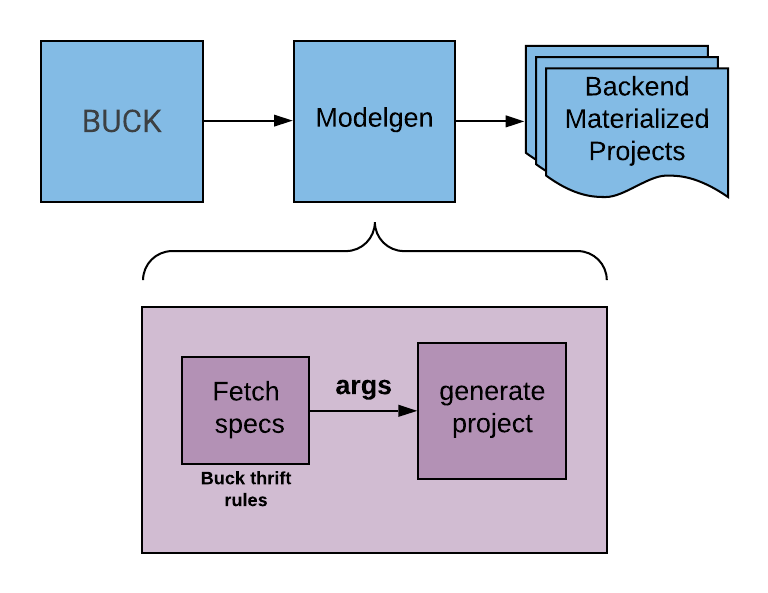
To simplify this setup, we created a `BuildPerfType` enum with the aforementioned matrices, and added a `–build-perf` option to the project generation CLI. Then, all that the analysis script had to do was run a command, such as:

Given our stack’s usage of Buck, we leverage OkBuck to wrap the Buck usage. The BuildPerfType enum member contains all the required information to generate a project for that specification, including potential custom arguments to kotlinc, dependencies (including, Kotlin stdlib, and Kapt, etc.), and fine-grained arguments and language controls to the code generation.
At the code generation level, we implemented support for generating Java and Kotlin code using JavaPoet and KotlinPoet. We already implemented a flexible plugin system in the code generation to support custom post-processing, so adding the necessary controls to facilitate these new variants was easy.
To support the generation of mixed source sets, we added support for specifying exactly which Thrift elements should be generated in each language. To support Kapt-less generation, we implemented support for optional direct generation of classes that would otherwise be generated during annotation processing. Namely, support for generating Dagger factories (example) and Moshi Kotlin models (based on this pull request).
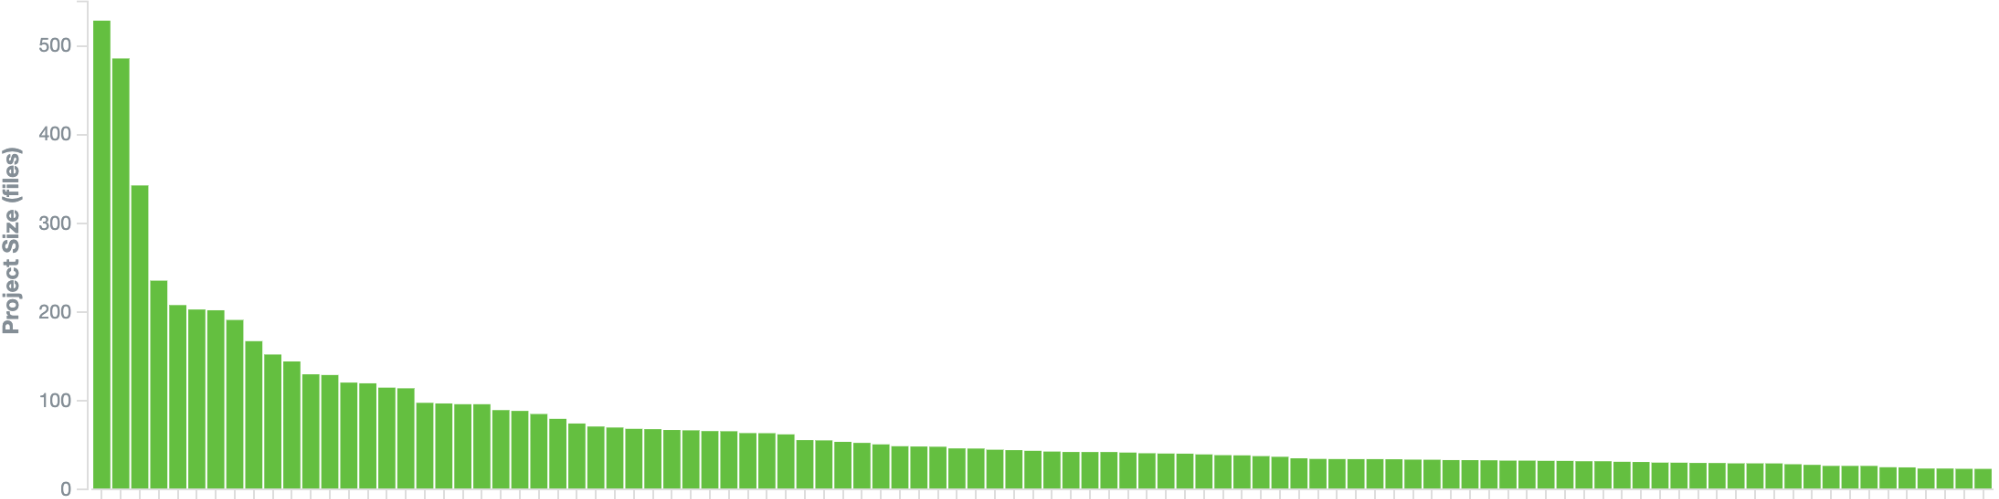
Figure 2, below, shows the distribution of the generated projects based on their size, as measured by the number of files. On average, there are 27 files per project (i.e., the average total files across all 354 projects in the 13 build performance types). The average number of lines per file is 200 (i.e., the average number of files divided per average number of lines, which is the sum of the average number of lines of code, comments, and blank lines for Java and Kotlin).
Experiment execution
To run our experiment, we took the following steps:
- Instrument the process. This mainly means going inside our build system and making it issue the metrics we need for this analysis.
- Consolidate the data. We had to agree on a format for the data before shipping it to the database. The way this data is indexed would directly impact our ability to build visualizations in Kibana, our front-end system.
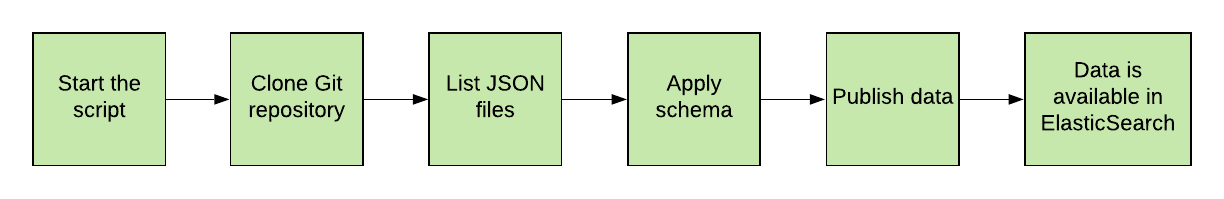
- Ship it to our in-house databases. At Uber, there are multiple databases for these sort of metrics, each one optimized for specific scenarios. We chose ElasticSearch and Kibana for this experiment as the visualizations that we wanted could be better built in it.
- Repeat it consistently. We needed a large enough amount of data in order to eliminate any outliers that could harm the data analysis.
A Python script orchestrated the experiment execution; the language of choice for this type of experiment has no impact on experiment performance and was chosen based on team familiarity. Build performance data was provided by our build system in the shape of a Chrome traceable file, and although this is a standard feature of the build system, we still had to modify our internal Buck fork in order to associate the data we needed with the context of the project in which it was being collected.
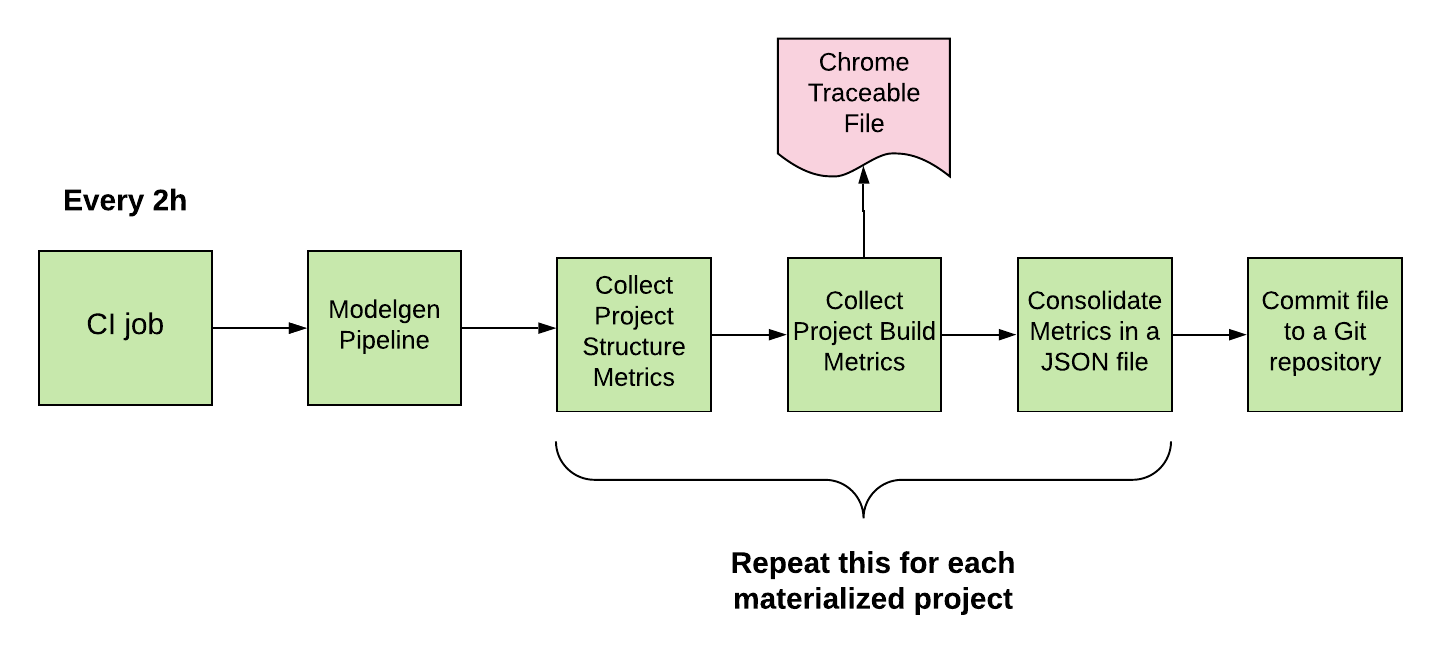
For the project morphology-related data, e.g. number of files, the number of lines that are blank, comments, or code and the number of generated classes and interfaces, we used a mix of the Count Lines of Code (CLoC) CLI and regular expressions, an analysis that looks into the generated project source files and not its compiled bytecode. Once all data was collected, it was assembled into a single JSON file and committed to a separate Git repository. This entire process was run in the CI environment every two hours for about two weeks. Afterwards, another part of the script was responsible for synchronizing the results repository and shipping the data to our in-house databases, where it could be analyzed.
Running the experiment in a development environment (on a laptop) was not an option. The main reasons for this was that the local development environment was not deterministic; in other words, at each run, the state of the machine was changed due to tasks running in the background. In addition, the experiment execution was too slow (on average, the experiment takes two hours to finish on CI hardware). The manual trigger of the script would also consume a lot of an engineer’s time and decrease productivity since it prevents them using their laptop for other tasks.
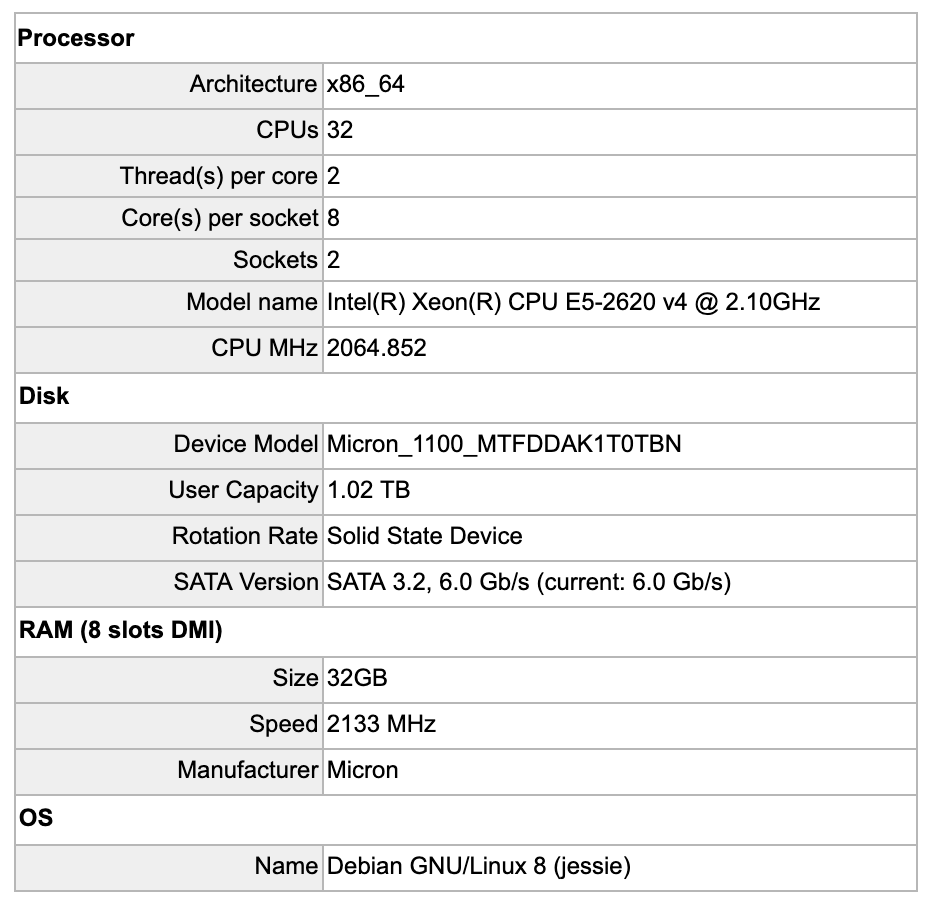
Hardware specifications
Results
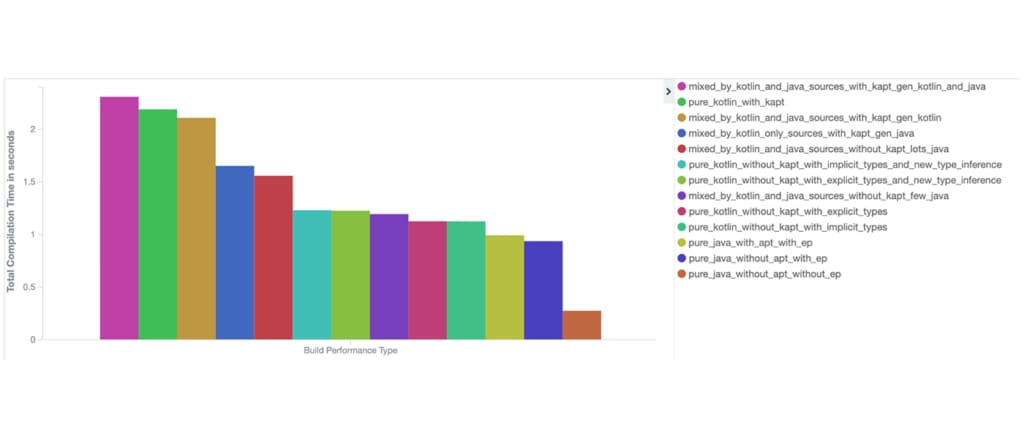
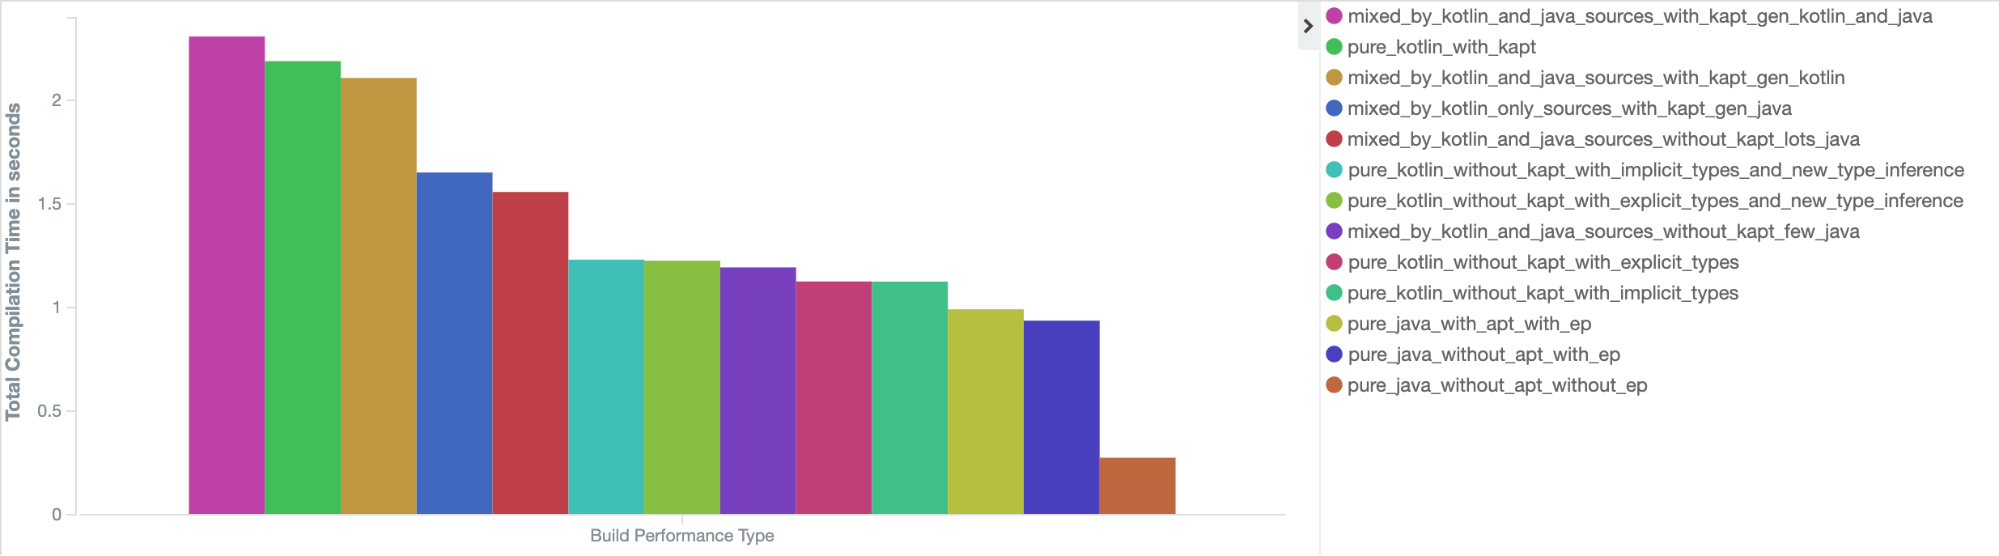
We analyzed the data using ElasticSearch and Kibana. The analysis aggregated the data in buckets based on the build performance matrix (Table 1). In this table, the displayed compilation time for line one represents the average compilation time across all 354 projects for all experiment runs. The most interesting insights are described below:
javac and kotlinc behaved consistently across the experiments
Throughout the 129 experiments, both javac and kotlinc reported consistent times. This is a good indicator that the experiment environment was well-controlled.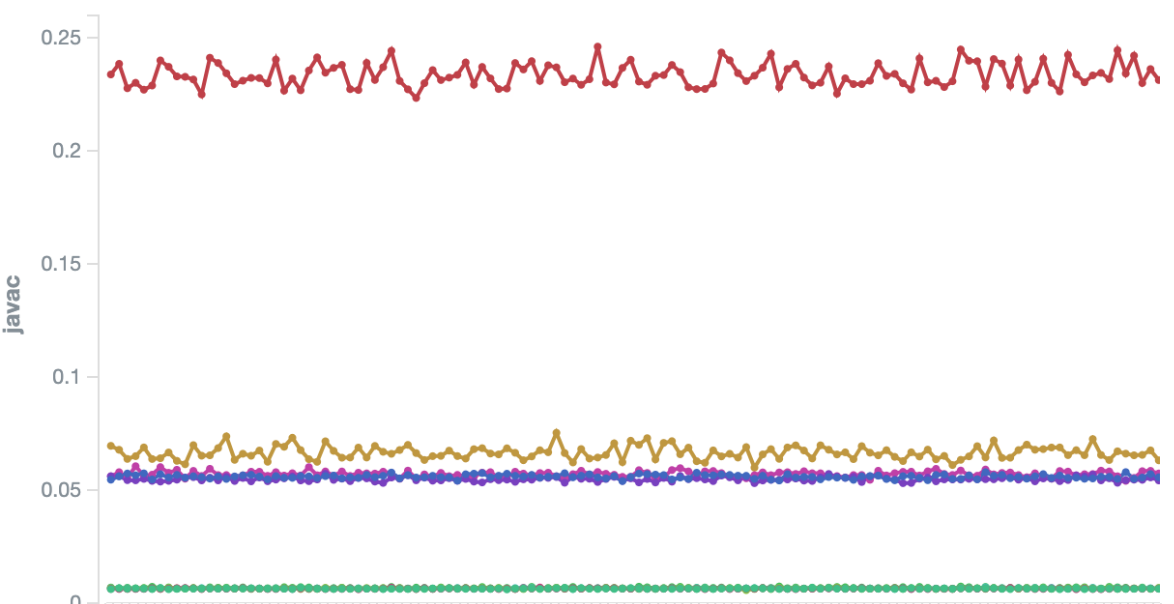

Error Prone is currently adding an overhead of ~70 percent on top of pure Java (baseline)
Error Prone, a static analysis tool for Java, comes with a standard set of checkers. One of its main features is to let users extend its analysis power by adding custom checkers. We believe that the excessive use of this feature, the non-share of their classloader, and poorly written checkers might be the cause of this overhead.
Kotlin implicit/explicit types have a small impact on overall compilation overhead
To declare or not declare the types might be a question that comes up while writing code. This can involve inferred return types, lambdas, member references, and generics. At least from a build performance perspective, it doesn’t matter whether or not implicit or explicit types are used in the code. We were particularly interested in measuring this after iOS developers observed significant inference penalties in the Swift compiler.
Kotlin’s new type inference system adds an overhead of ~8 percent in total compilation time
While Kotlin’s new type inference system is still experimental, it adds a number of new improvements. Moreover, since it is still incubating, we were not surprised to see that it runs slower than the other type inference systems we tested.
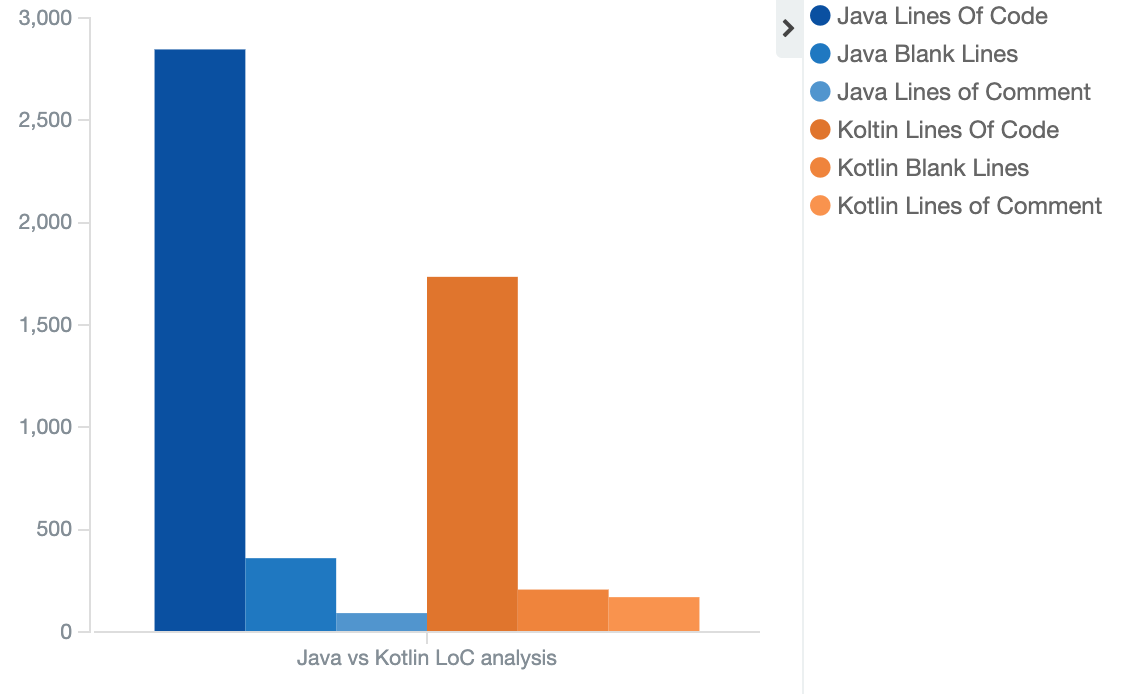
Overall, Kotlin resulted in 40 percent fewer lines of source code than Java
Kotlin is well-known for being able to achieve more with less code, and our experiments were a testament to this common knowledge. The “source” in “source code” is also significant here—the Kotlin compiler generates a number of synthetic elements that would otherwise need to be manually included in the equivalent Java source code. This includes surfaces like data class copy()/hashCode()/equals()/toString() functions and destructuring component methods (though this language feature is only useful to Kotlin consumers).
Projects that leverage pure Kotlin with Kapt are considerably slower when compared with pure Kotlin without Kapt
Kotlin with Kapt adds a ~95 percent overhead when compared with pure Kotlin only. We believe that this happens due to the following reasons:
- A project is always compiled from a clean state, which means that any type of compilation avoidance or incremental compilation is neither possible nor wanted (more on why this happens in the next item).
- It is in Buck’s vision to not support incremental compilation, as it results in compilation states that are harder to reproduce (imagine the steps to reproduce a compilation failure having a lot of Git patches intertwined with build commands). With that in mind, we did not want to rely on results that would be improved only by using those features.
- Buck’s implementation of Kapt is not optimal, as it calls `kotlinc` twice to run annotation processing (once for generating stubs and again for the real annotation processing) and once more for the actual compilation, totaling three calls to `kotlinc`. An optimized implementation would have all Kapt stages and compilation to run in single `kotlinc` call. But this is still not completely implemented on the compiler so it can not be done on Buck just yet. We are not sure how big of an impact this implementation has on the Kotlin plus Kapt build performance and could not gather data with the optimized version yet.
Even with these reasons, it is odd to see that pure Java plus Apt is much faster when compared to pure Java with no Apt (only a ~5 percent overhead).
 | 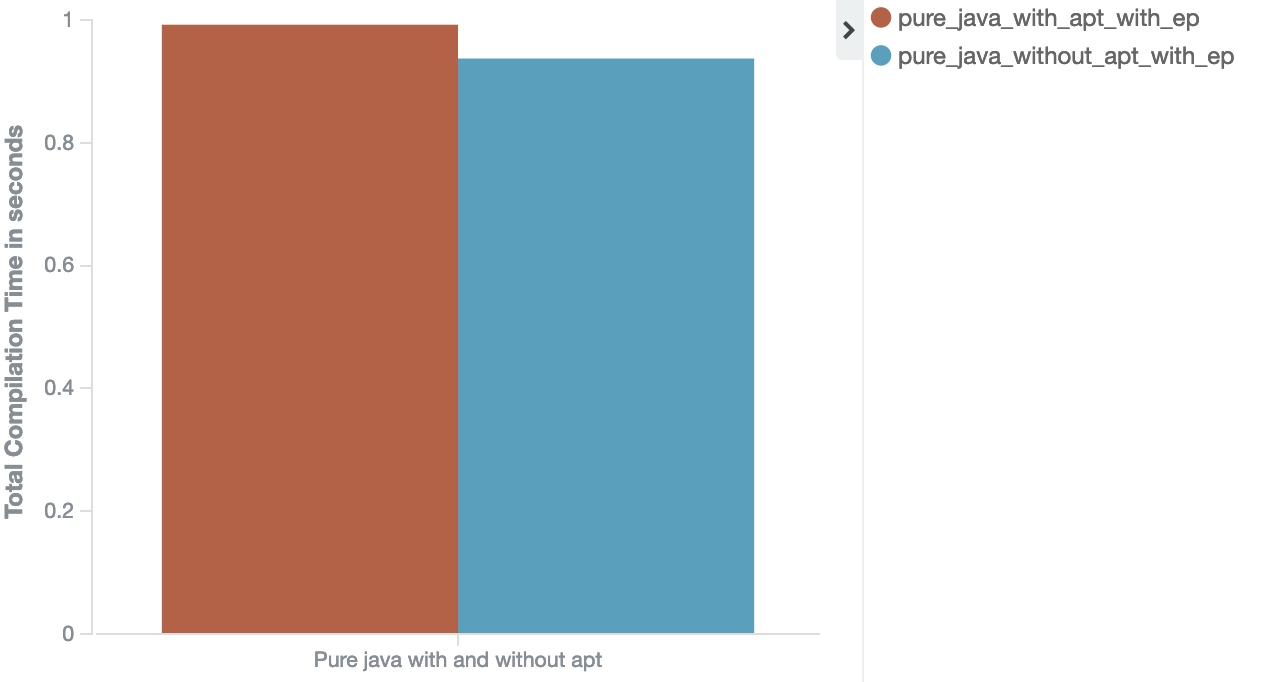 |
Figure 8: We measured project performance between Pure Kotlin with Kapt (pink) and pure Kotlin (blue) setups, on the left, and pure Java with Apt (brown) and pure Java (turquoise), on the right.
One theory we developed for why Apt-powered builds perform so well is because the software is much older and is kept under constant development, which allows for performance optimizations over time, something that has yet to happen with Kapt, since it is a much younger solution. Also, annotation processing was designed for Java and can run in-process with the javac compiler, as both share the same AST. This is harder to optimize with Kotlin. Other than that, Apt usage was not as heavy as Kotlin, since the focus of our experiments was Kotlin.
Figure 9, below, depicts how projects that run with Kapt presents much fewer files overall than those built with Java, indicating that Kapt had to generate many more files than Apt.
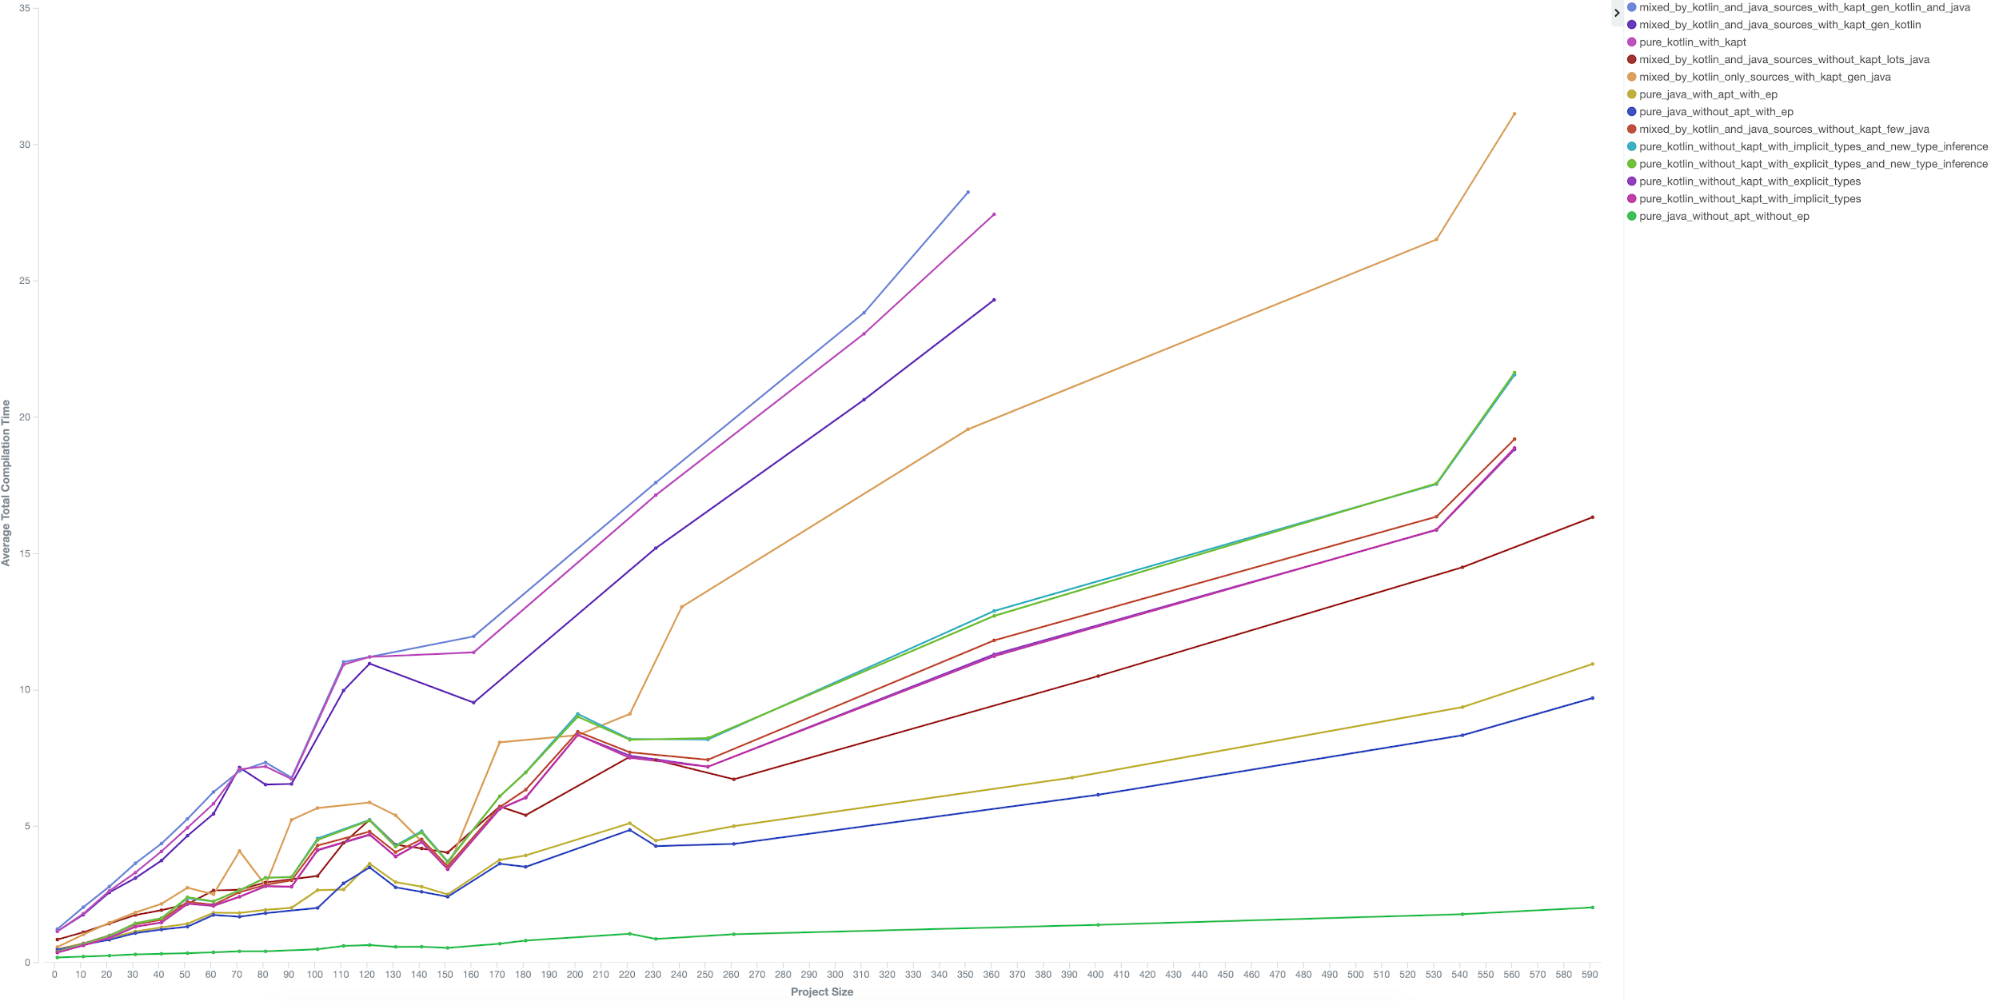
Total compilation time grows mostly linearly based on project size (number of files)
Although we expected (or at least hoped) that there was a linear correlation between compilation time and number of files, this was a great indicator that we did not need to worry too much about creating enforcements around module size. While it is important to keep the project size small so no single project blocks a thread by taking too long to finish and the system can continue to be performant, it is not a concern when it comes to causing exponential growth for individual build times.
Conclusion
While performing this sort of analysis, it is very difficult to cover all the different permutations in which the subject languages could be used. As described in this article, we attempted to leverage our existing infrastructure to run this experiment and test the most scenarios possible (see Table 1). However, our 13 options are still only a subset of what exists out there. We hope that this analysis can serve as a north star for other organizations who leverage Kotlin.
Our results suggest that mixed Kotlin and Java source code in the same module should be used with caution, mainly in the scope of large repositories with a high throughput of commits, so that every minute lost in the CI build can make a difference. Java projects that import Kotlin dependencies, or vice versa, do not fall under this bucket.
At Uber, we rely extensively on Error Prone for performing static analysis. We have more than 60 custom checkers that can get triggered hundreds of times every day to prevent a number of bugs.
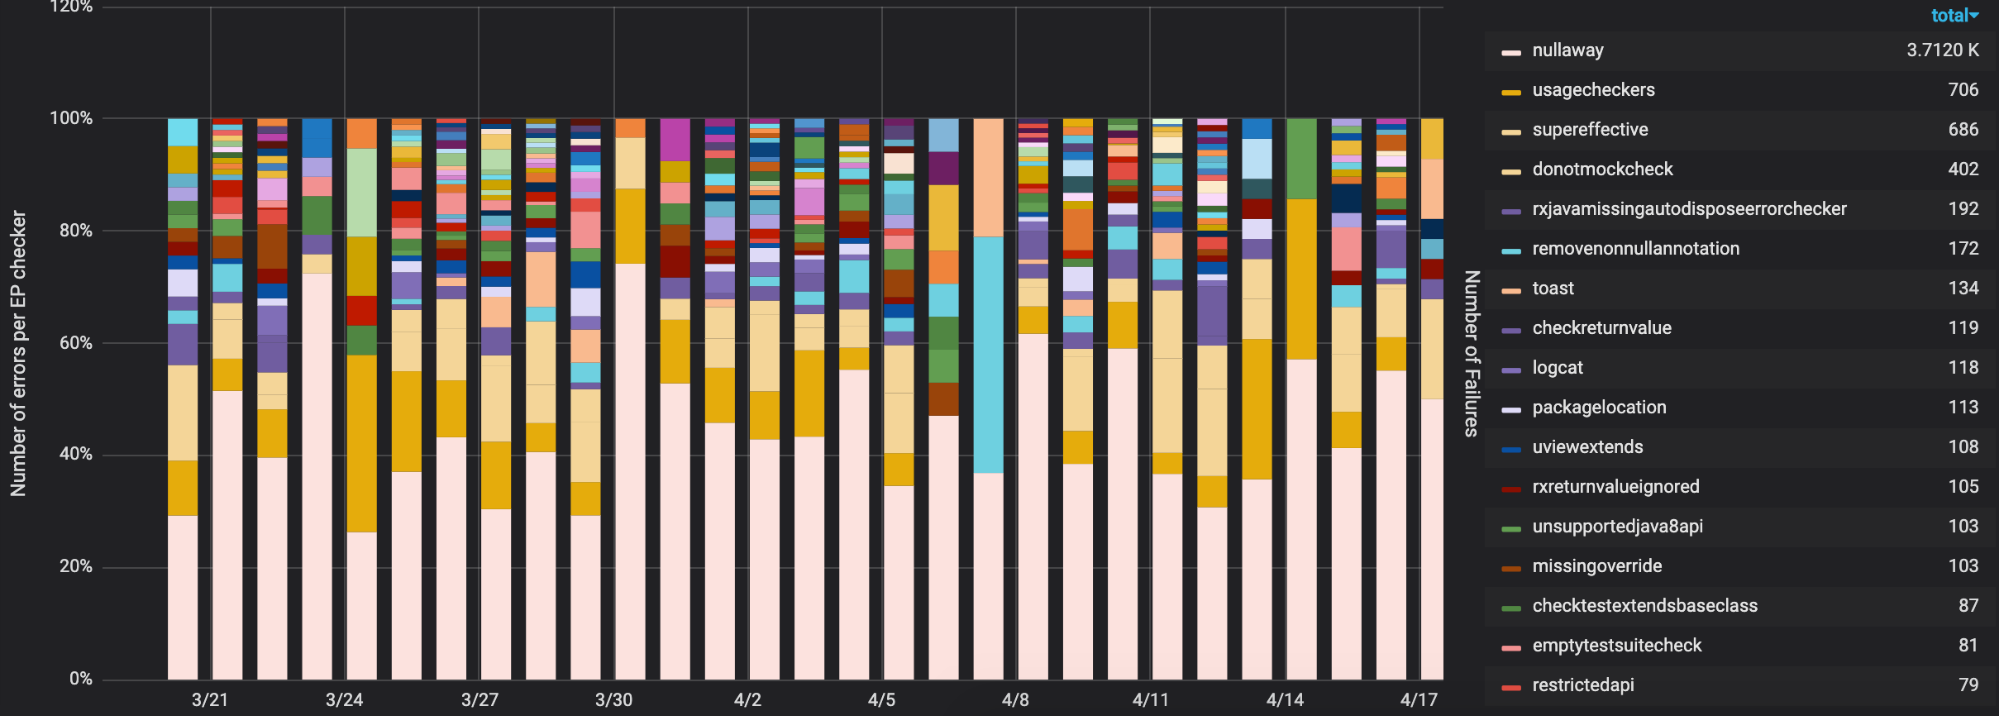
The increasing number of custom checkers, along with the fact that we do not share their classloaders for different javac invocations, are likely responsible for the 70 percent overhead observed in this benchmark. Removing the checkers that are not triggered as often and start sharing their classloaders are the immediate actionable items we can take in order to speed up this scenario.
Lessons learned
Evaluating a language adoption is something very complex that involves a number of variables that can go way beyond the observed overheads for compile times, e.g., the overall community support for that language, readability, and natively supported features, among other features.
There is obviously no simple answer for the question of whether or not Kotlin is right for your project or team. In the end, determining whether or not to adopt a programming language—or a combination of them—requires that you assess their tradeoffs. In a recent internal survey at Uber, we asked nearly 100 mobile engineers if they were willing to accept slower build times in order to be able to use Kotlin. The result? 95 percent have said that they would be willing to accept slower builds if they could write their code in Kotlin.
Additional considerations
There are many things that can be done in order to improve Kotlin build performance analysis. This section presents some of the metrics and analysis that we wanted to perform, but for various reasons, were not able to; we encourage others to explore these possibilities on their own.
- IntelliJ project indexing times. Capturing this data requires much more effort than the ones presented in this document and would be worth its own article.
- Bigger projects. This analysis was confined to somewhat small projects (between 1 and 500 files with an average file size of 27) due to the nature of our sampling space. Having a more diverse representation in terms of project size is imperative for better analysis.
- Other build tools. By attempting to isolate the build system from the analysis we could not evaluate the impact of certain features provided or designed for particular build system, e.g. Gradle incremental compilation. Understanding how the aforementioned scenarios behave with these features might reveal designs that can boost compilation speeds, and hopefully, lead to discussion on how these tools can be brought to a wider set of build systems.
- Other Kotlin features. The wide set of features that Kotlin offers leaves us wanting to improve this analysis even further in order to account for situations such as:
- Smart casting: We don’t need smart casting in our generated model projects and so it was not covered in our analysis. However, this can be used as another potential area to measure for compiler performance.
- Buck-specific:
- ABI jar support: This was added in Kotlin 1.2.70 and allows computation of the ABI of a given library to quickly determine if recompilation of consumers is needed. This is an important part of how build systems like Buck and Bazel work.
- Study feasibility of incremental Kapt on Buck. Currently this is only implemented in Gradle, but it may be a possible area to improve compilation speeds on Buck projects as well with using Kapt.
- Smart casting: We don’t need smart casting in our generated model projects and so it was not covered in our analysis. However, this can be used as another potential area to measure for compiler performance.
- Understand the impact of the size of third-party dependency jars. Heavy dependencies might be playing a bigger role in the measured scenarios. Isolating them from analysis might lead to greater insights.
- Java’s impact on mixed sources projects. Although we have a metric that tells us the percentage of Java files present in the project, it is tightly coupled to the size of the project; in other words, as the percentage of Java changes, so does the size of the project. Therefore, the curve seems to be more biased towards the size of the project than by the amount of Java in the project. As this analysis is non-conclusive, we opted to leave it out of this article.
- A continuous pipeline to compare tooling improvements over time. The natural evolution of software development brings several changes to observed compilation times. Having a solid pipeline producing data is the best way to understand the impact of new features in your environment. Having an open source data set of projects only increases the range of analysis and unveils better insights.
By sharing our results and lessons learned, we hope that others can use it to inform their own decisions.
To give a better overview of the generated code, we’ve created a repository with sample code for each of the variants and details of the underlying tech stack.
Subscribe to our newsletter to keep up with the latest innovations from Uber Engineering.

Edgar Fernandes
Edgar Fernandes is a senior software engineer on Uber's Amsterdam Mobile Developer Experience team.

Thales Machado
Thales Machado is a senior software engineer on Uber's Amsterdam Mobile Developer Experience team.

Tho Nguyen
Tho Nguyen is a senior software engineer on Uber's Amsterdam Mobile Developer Experience team.

Zac Sweers
Zac Sweers is a senior software engineer on Uber's Mobile Foundations team.
Posted by Edgar Fernandes, Thales Machado, Tho Nguyen, Zac Sweers
Related articles


How LedgerStore Supports Trillions of Indexes at Uber
April 4 / Global
Most popular

Uber Health and Findhelp support patients beyond the four walls of a medical office

Stopping Uber Fraudsters Through Risk Challenges
Scaling AI/ML Infrastructure at Uber

Information for driving during the week of Super Bowl LVIII
Products
Company
