If you run a public-facing web site, chances are you use an uptime monitoring service like StatusCake, Pingdom, or the cries of frustrated users, to alert you when it's offline.
Similar tools are out there for monitoring internal systems, and from Seq 5.1, you can also make simple status checks, monitor uptime, and be alerted when things go down, directly from Seq.
The magic ingredient that turns Seq from a passive log server into an active monitoring tool is Seq.Input.HealthCheck, a tiny plug-in that GETs HTTP or HTTPS URLs, and logs metrics about the responses back into the event stream.
Why run health checks from Seq?
- It puts health check data alongside the fine-grained events that tell the rest of the story,
- Seq has a powerful query language for analyzing health check data,
- Dashboards can combine service health information with other monitoring data, and
- Seq's alerting system can notify you when a system that should be healthy, isn't.
Health check targets
You can health-check HTML pages, JSON API endpoints, and just about anything else you can GET via HTTP. The main consideration is that it's accessible from the Seq server, at a stable URL.
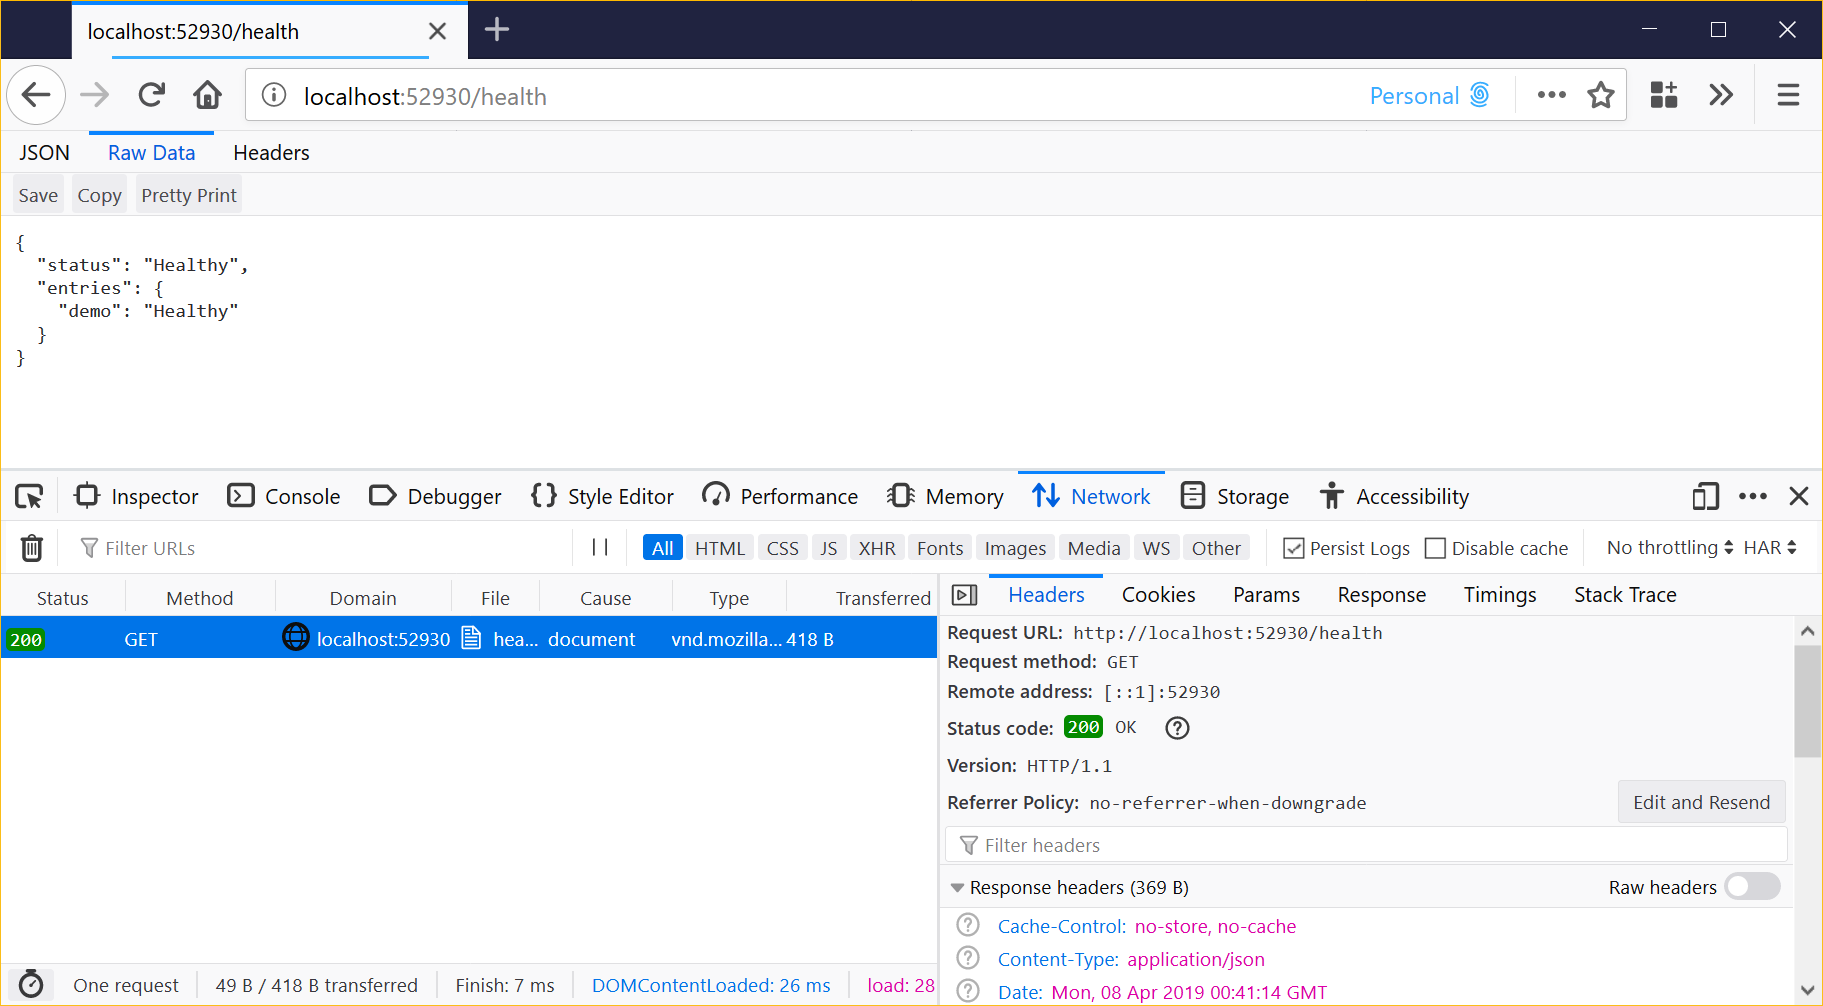
In this post, I'm using a default ASP.NET Core 2.2 web app, running locally, and set up to report health at /health using a slightly modified version of Scott Hanselman's example.
This returns JSON health data like:
Setting up a health check
First up, under Settings > Apps, choose Install from NuGet and enter the package id Seq.Input.HealthCheck (there's a shortcut for this just under the input box).
Back in the Apps screen, you'll see the app listed:
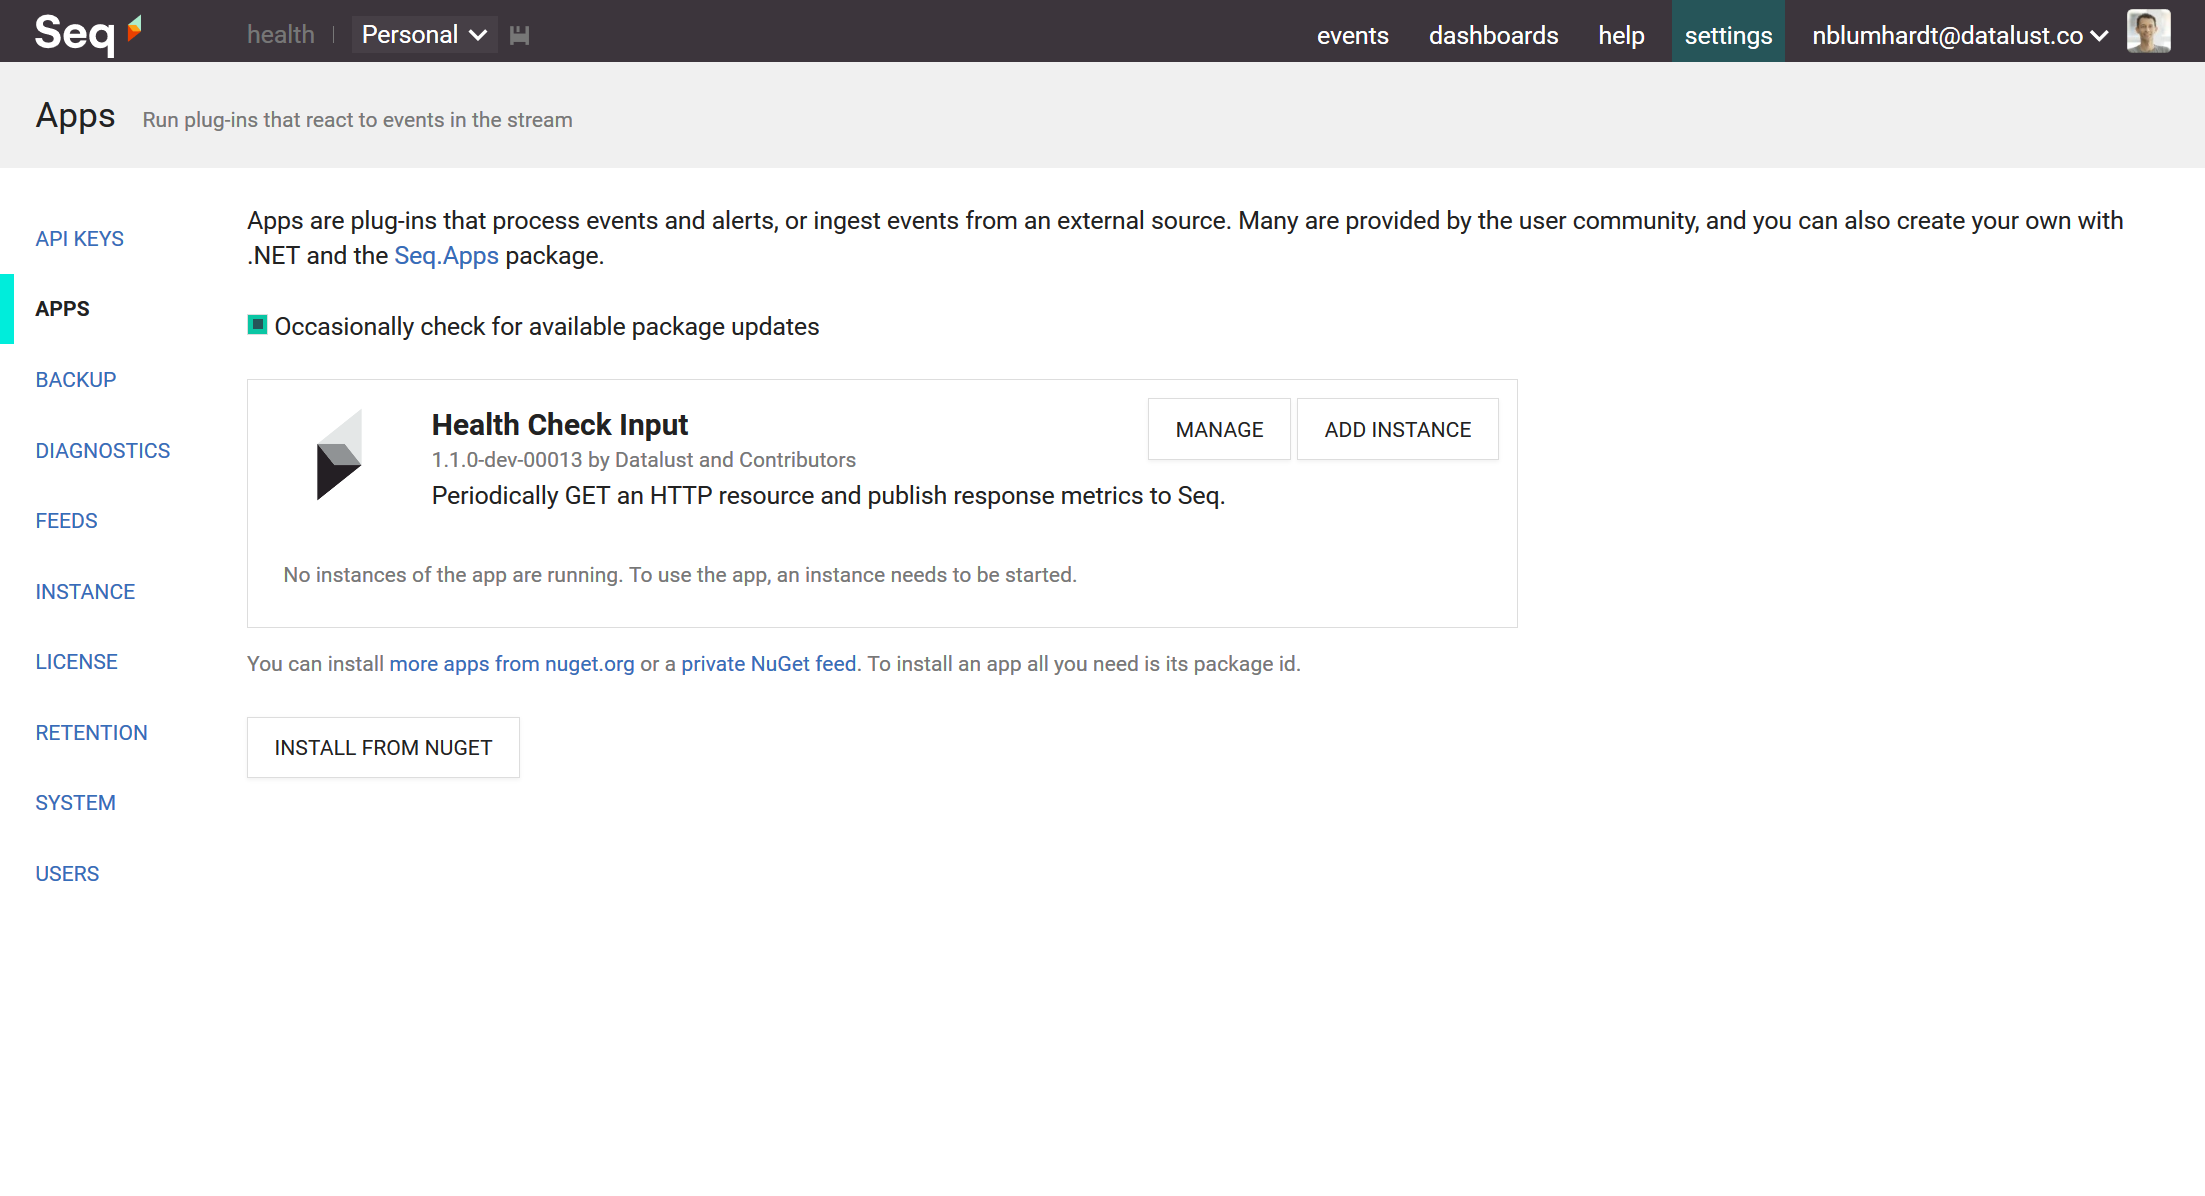
Choose Add instance and give it a title like Health Checks.
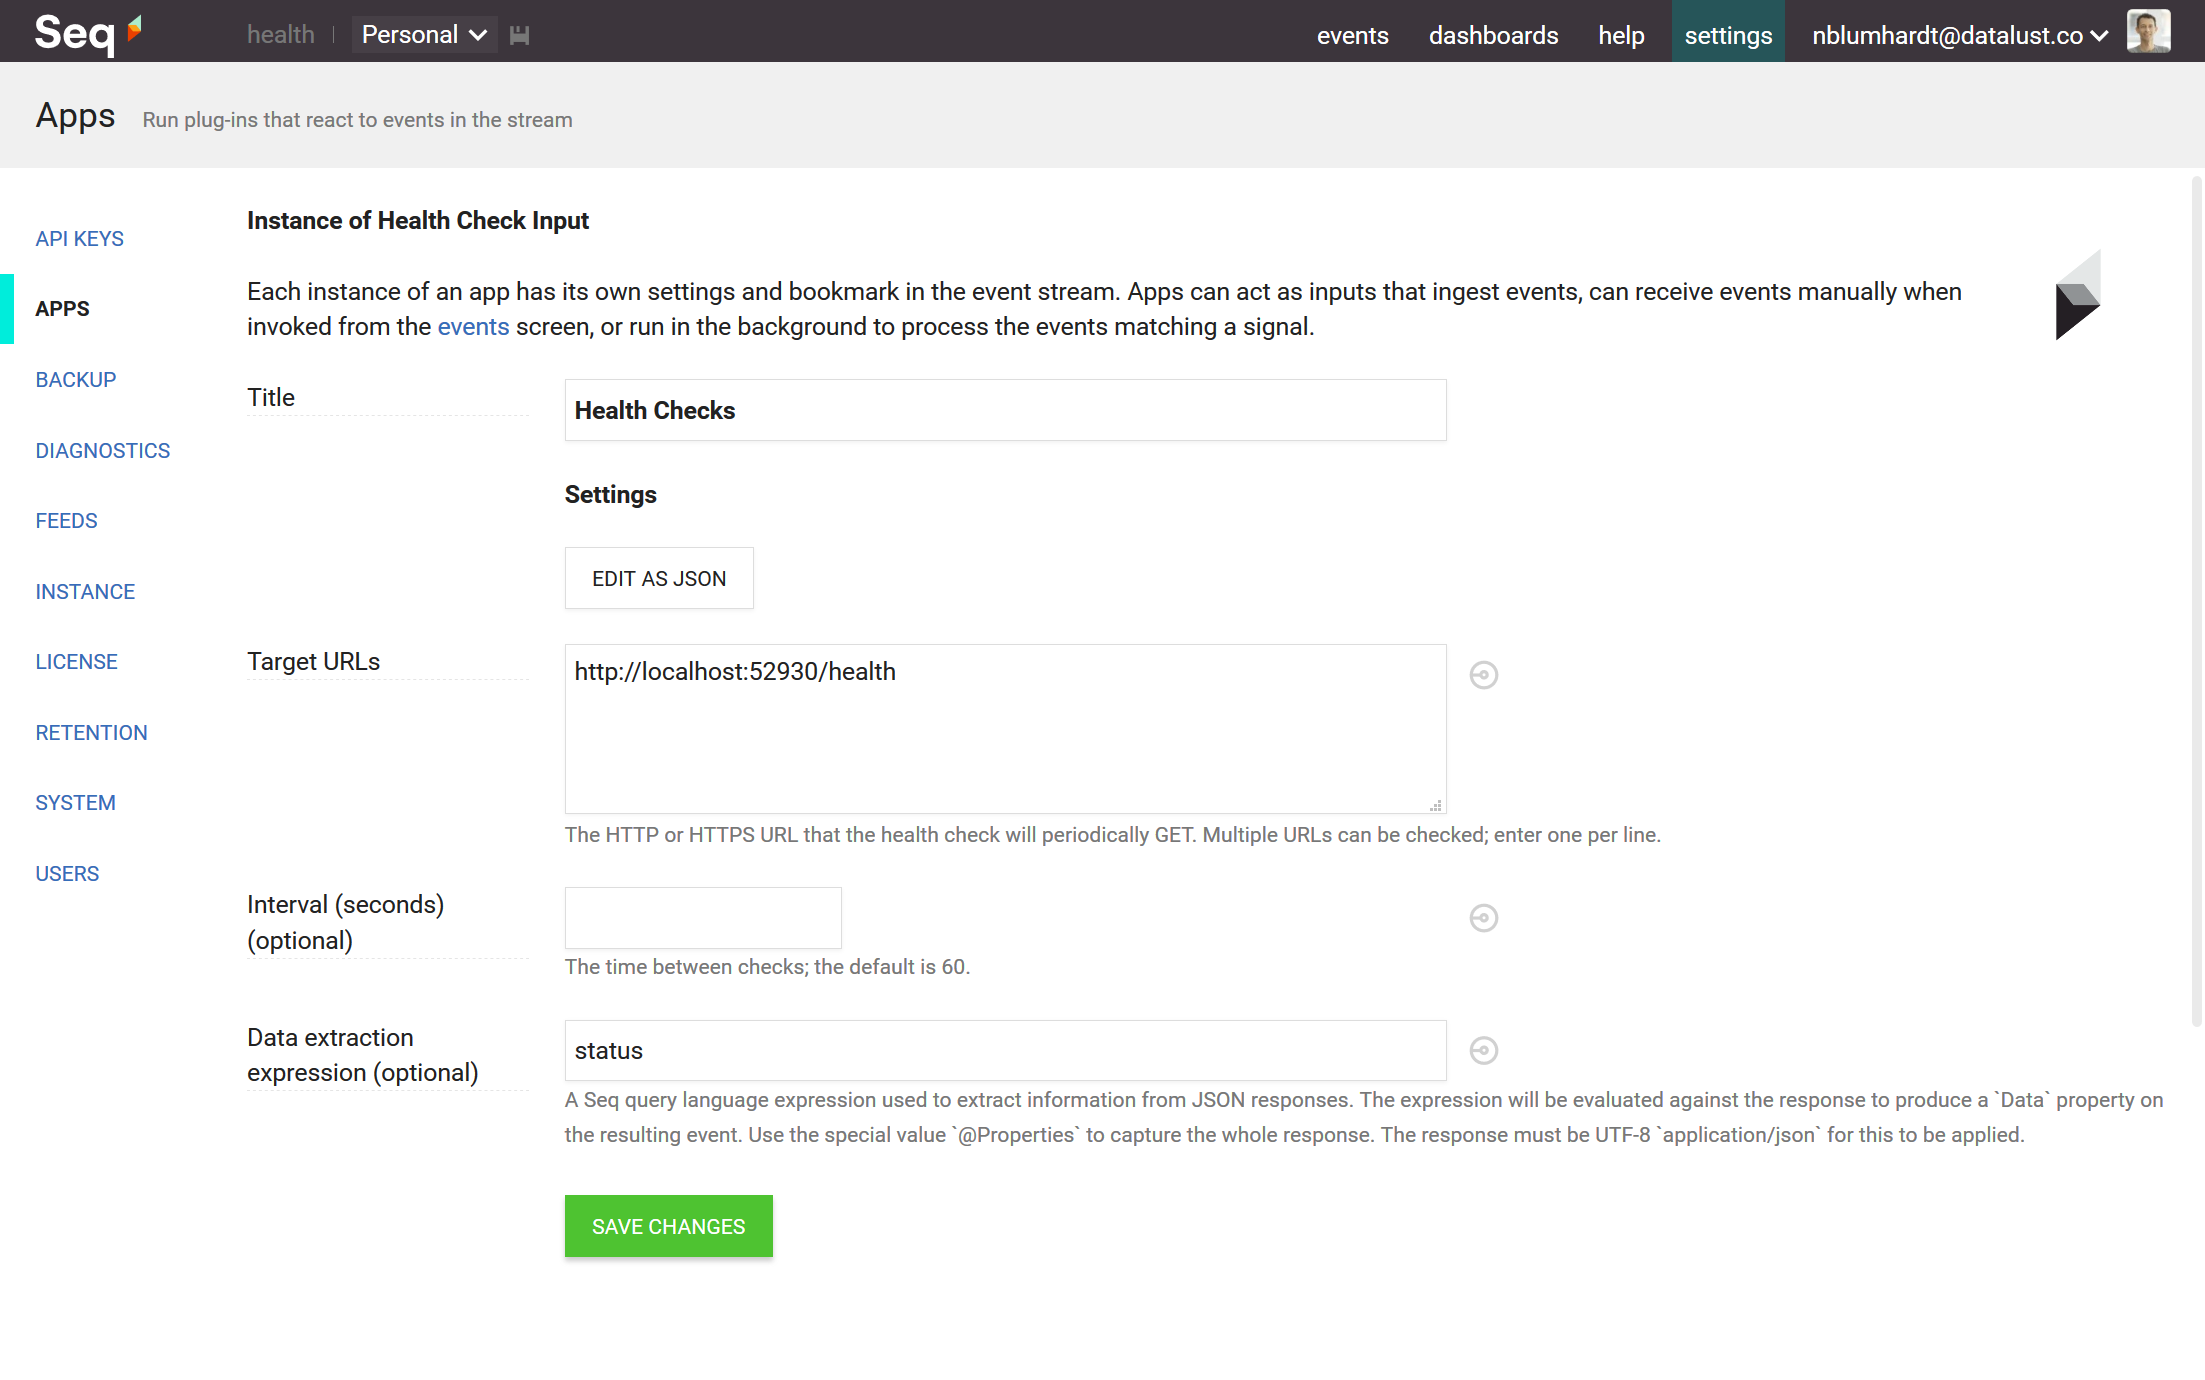
Next up are the details of the target endpoints: add some addresses to check into Target URLs, one-per-line.
Interval controls the frequency of health checking. Every sixty seconds (the default) is probably ample - you don't want to flood your logs with health check information.
The Data extraction expression setting identifies a portion of a JSON response to store in the resulting health check events. This avoids bloating out the event with unnecessary detail. Our example health checks return a summary status field, so we'll capture this.
Here's the complete configuration:
Once the instance is saved, results will start appearing in the Events screen:
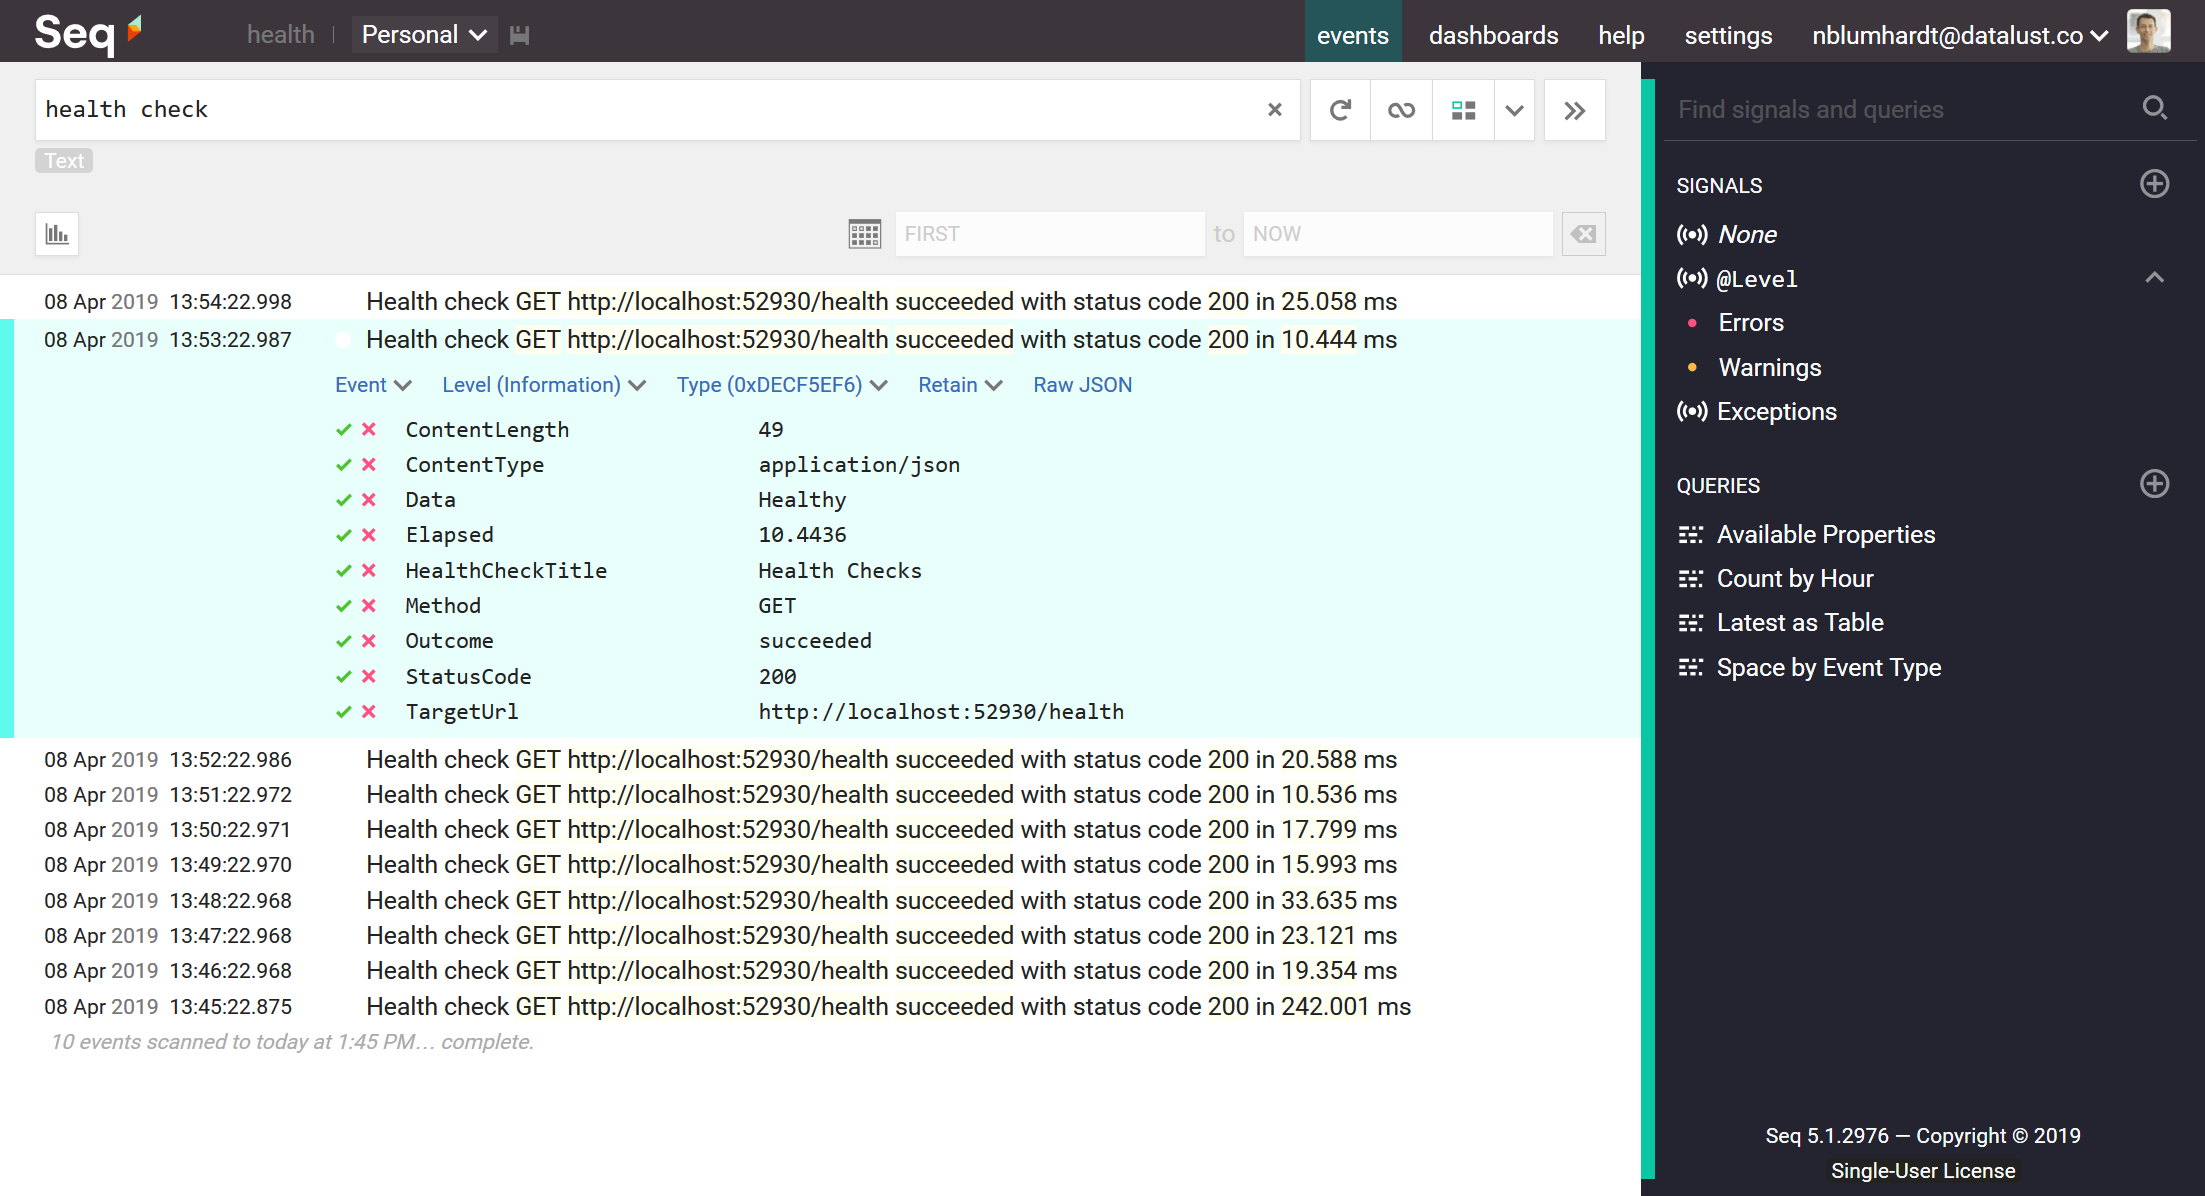
If there's a lot of data pouring into your Seq instance, you might need to search for "health check" in order to find them.
Note the extracted Healthy status in the Data property: this is read from the JSON response using our data extraction expression. If your target system is different, you won't necessarily see the same value; look for InitialContent instead, if you didn't specify an extraction expression.
Analyzing results
The health check results have tasty morsels like response size and content that are worth sampling. The bread-and-butter use cases for health checks, though, are monitoring response time and status.
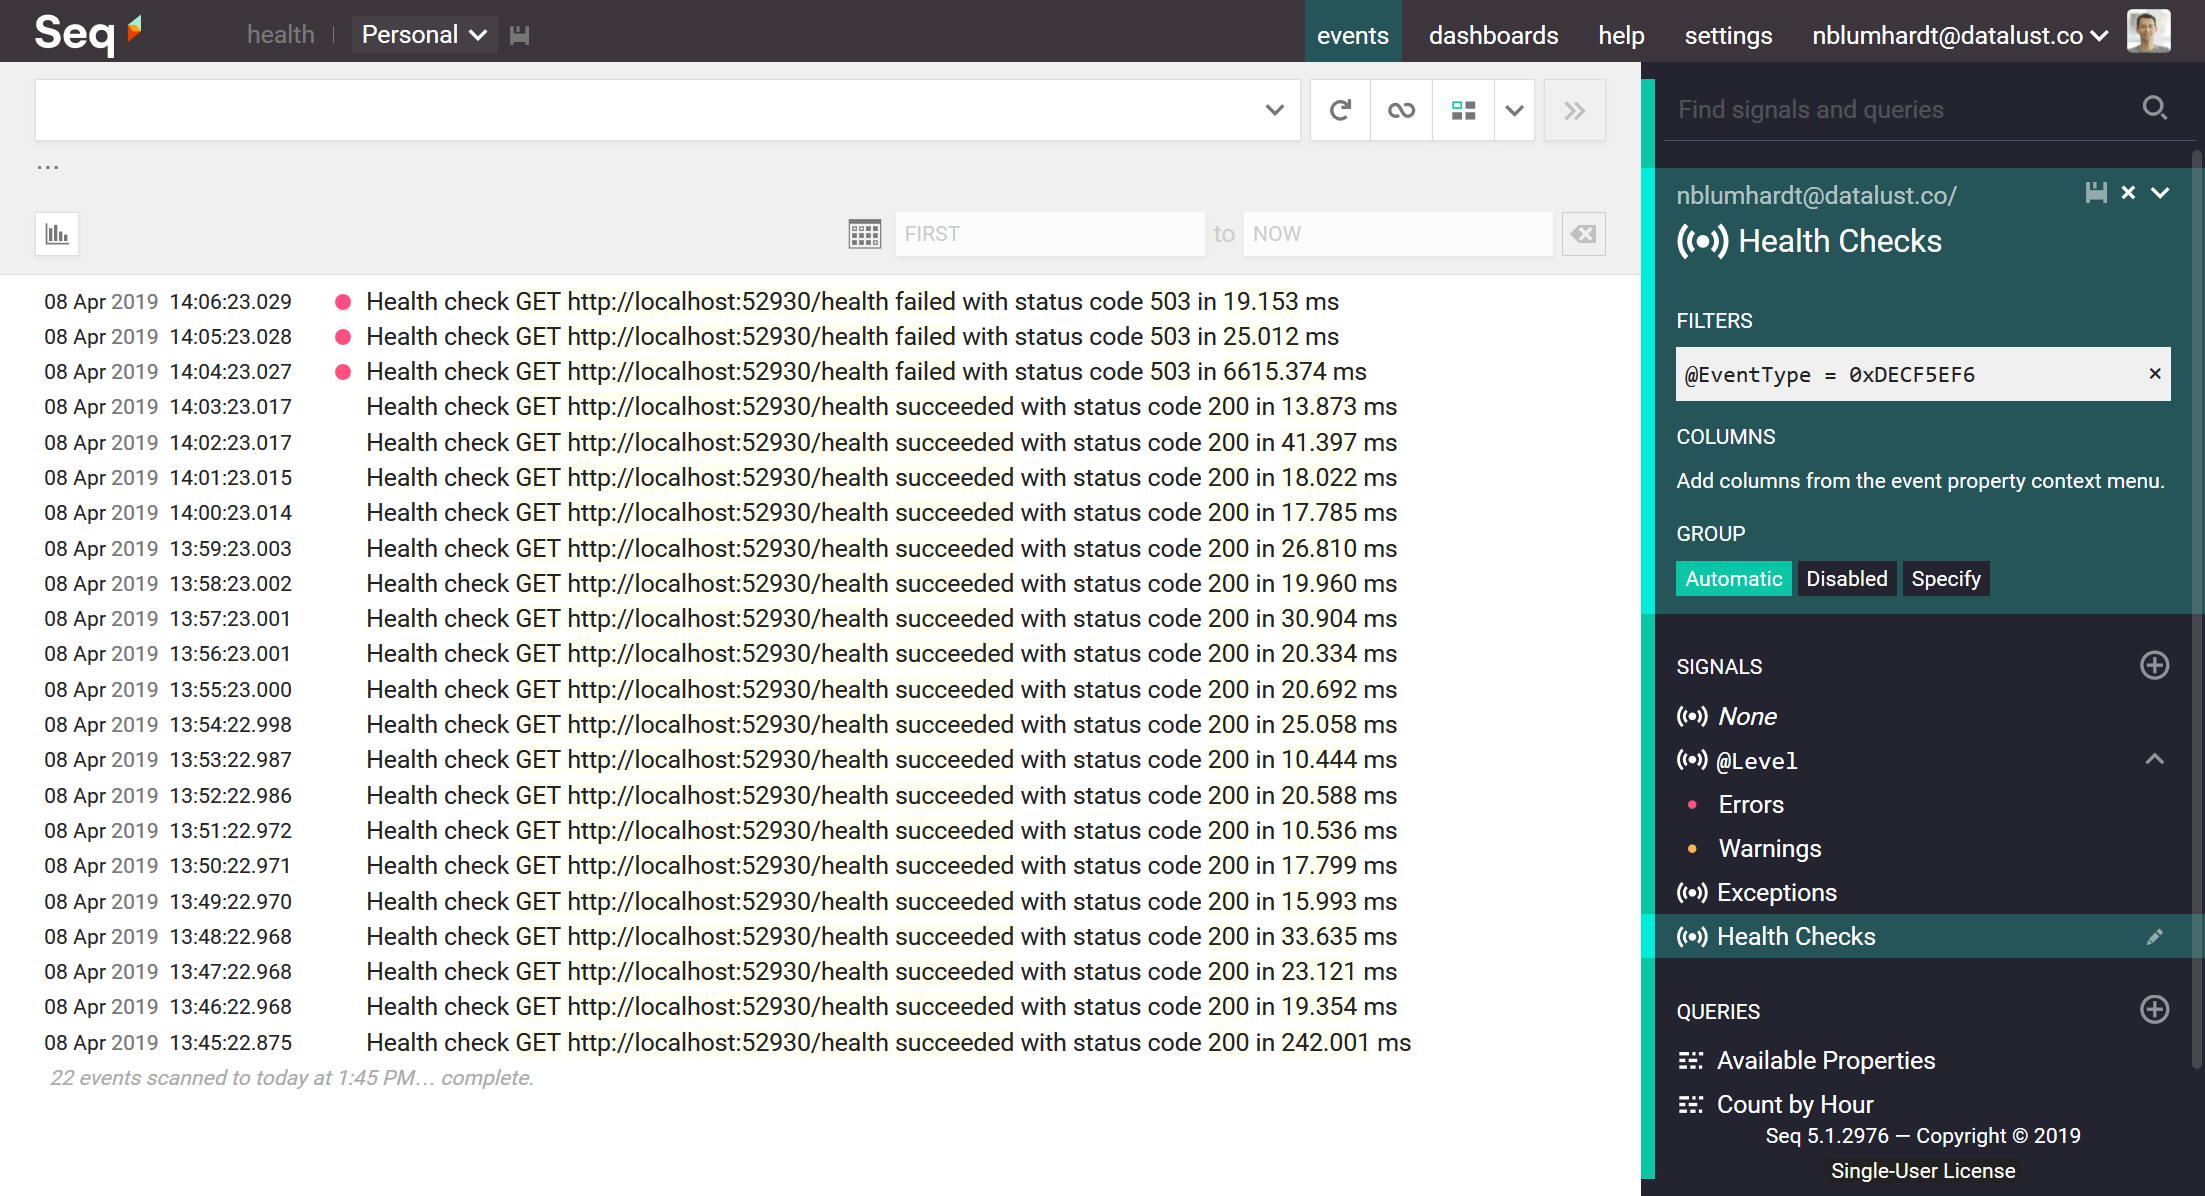
First up, to make sure your queries only touch health checks (and not other, similar-looking events), expand one of the health check results and click on the Type context menu. Choose Find, and when the filter bar is populated, use >> to create and save a signal called Health Checks.
It should look like this:
Now, with Health Checks selected in the signal bar, if you click the green checkmark beside the Elapsed property on one of the events you can choose Plot aggregates over time.
This little shortcut plots the min/max/90th percentile numbers for the property. Since you'll come back to this a lot, use the Add to Dashboard button to create a new dashboard with this chart:
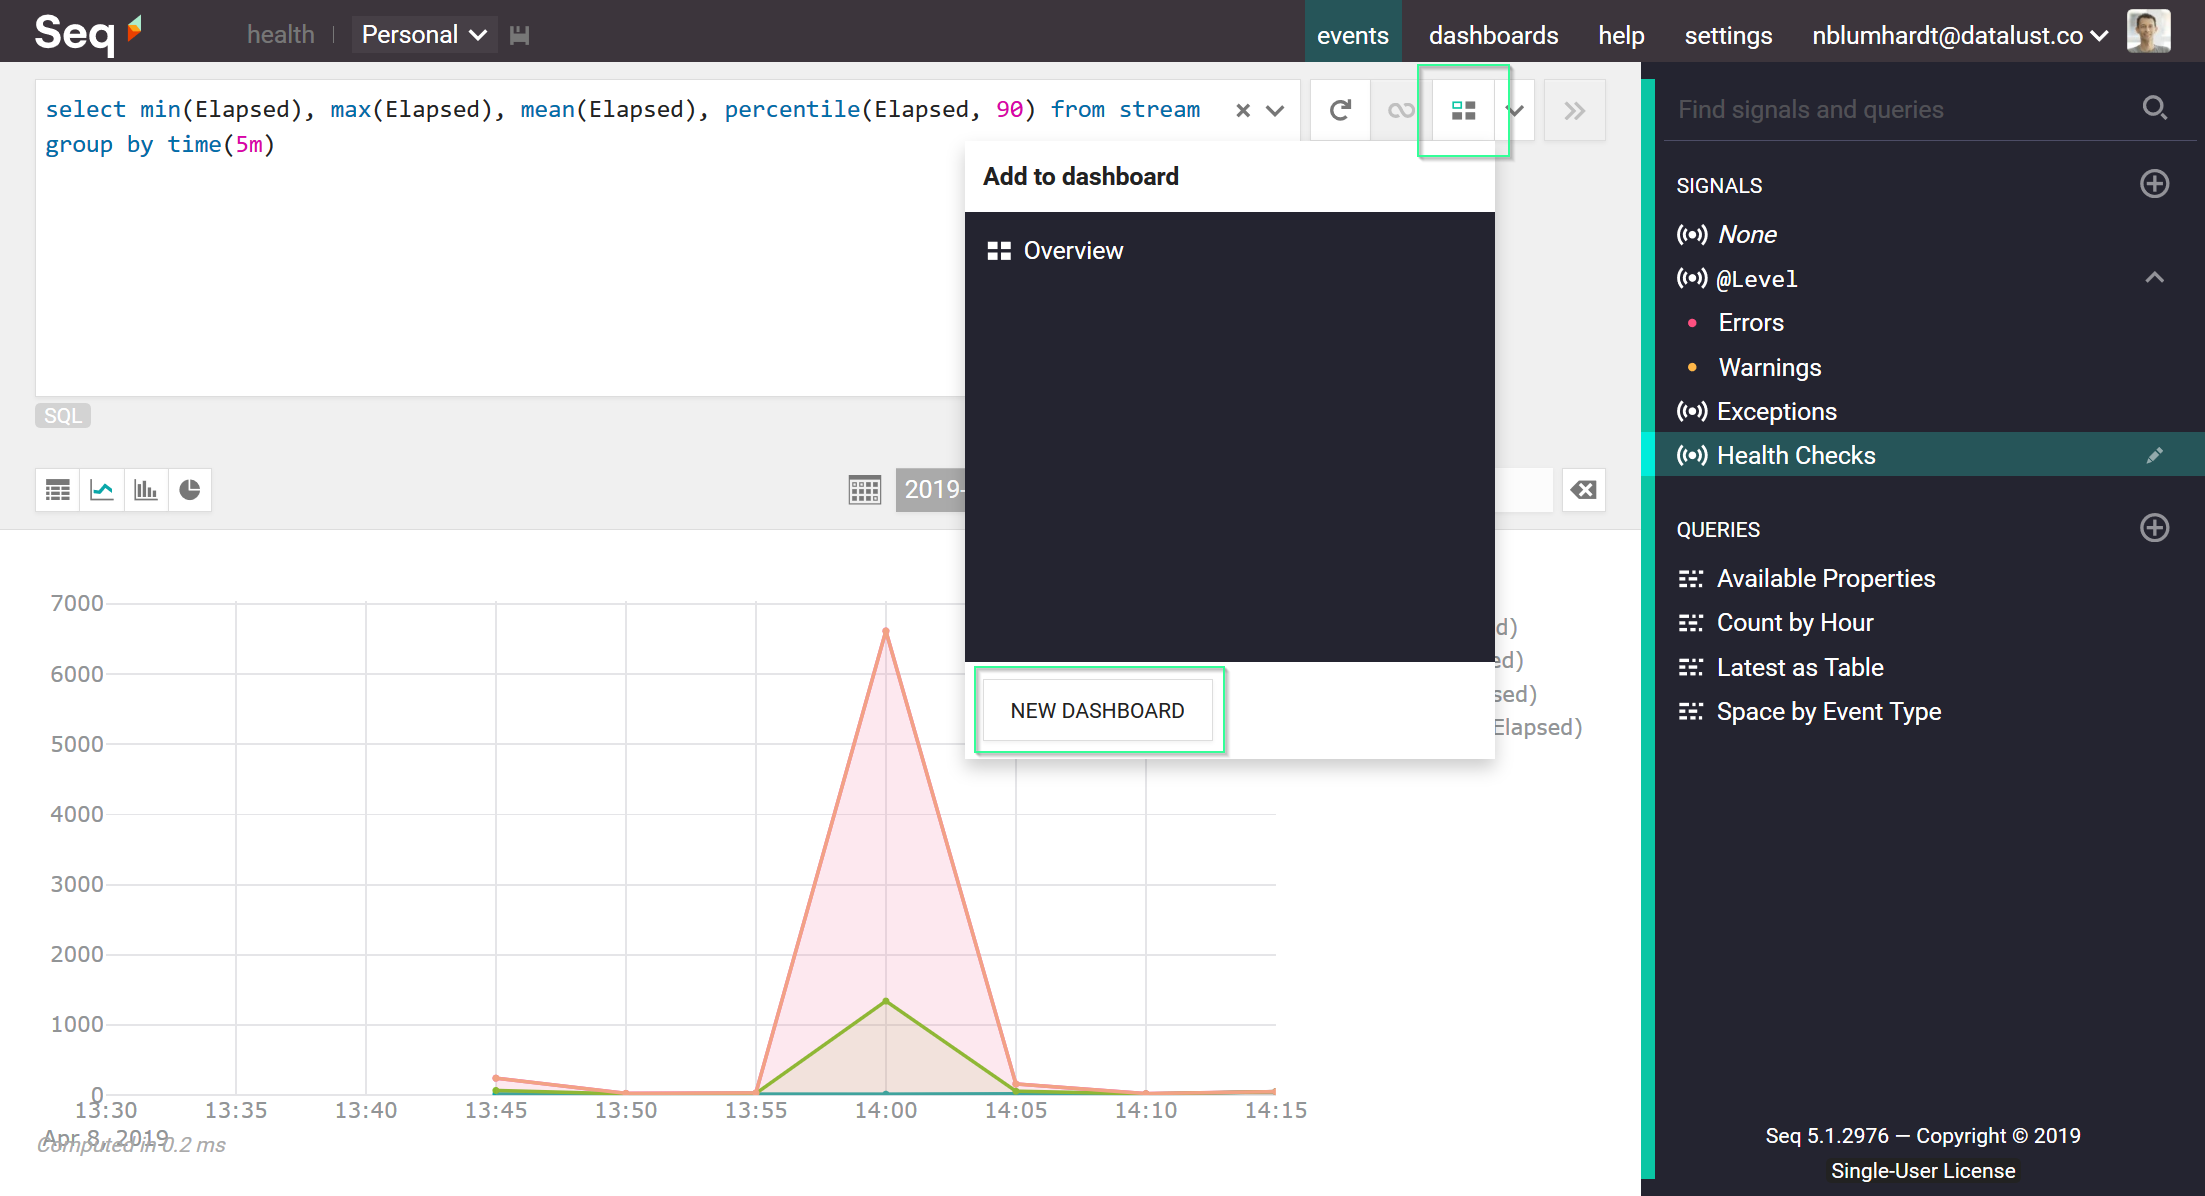
On the chart's Query tab, you can set some more descriptive names like min, max, and p90th, instead of the default col0, col1, etc.
While we're here, we'll add a second chart to track failed health checks. This one's simple: after clicking + to add the chart, choose the Health Checks and Errors signals in the first (Signal) tab.
Over on the Style tab, choose the Bar chart type, Reds palette, and we're done! You might group this by TargetUrl over in the Query tab, but getting an aggregate count of health check failures across all endpoints is useful if the services/applications are related.
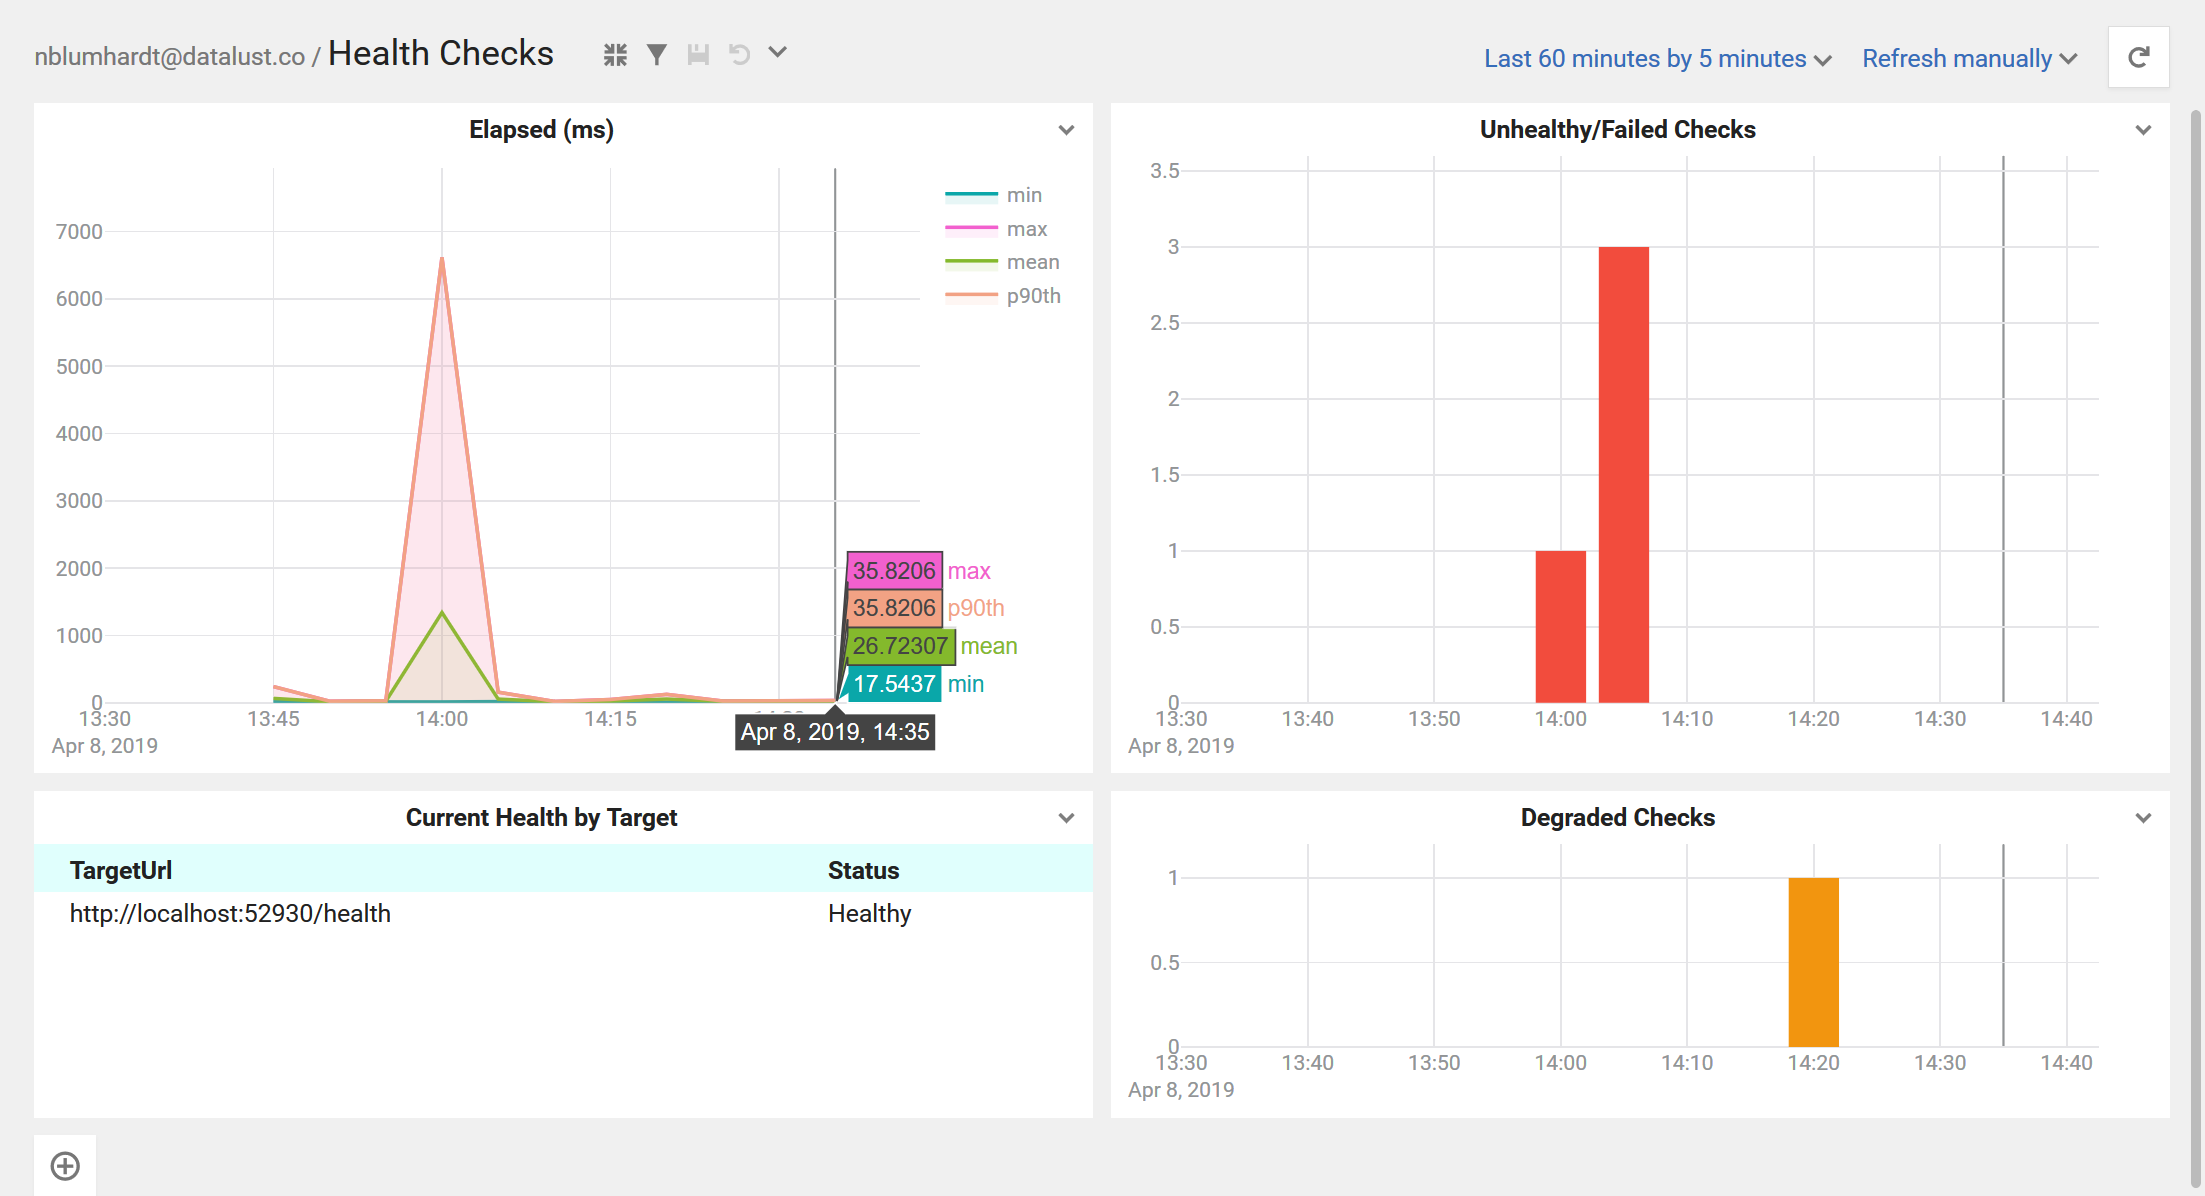
Here's what the dashboard looks like, with both charts given titles:
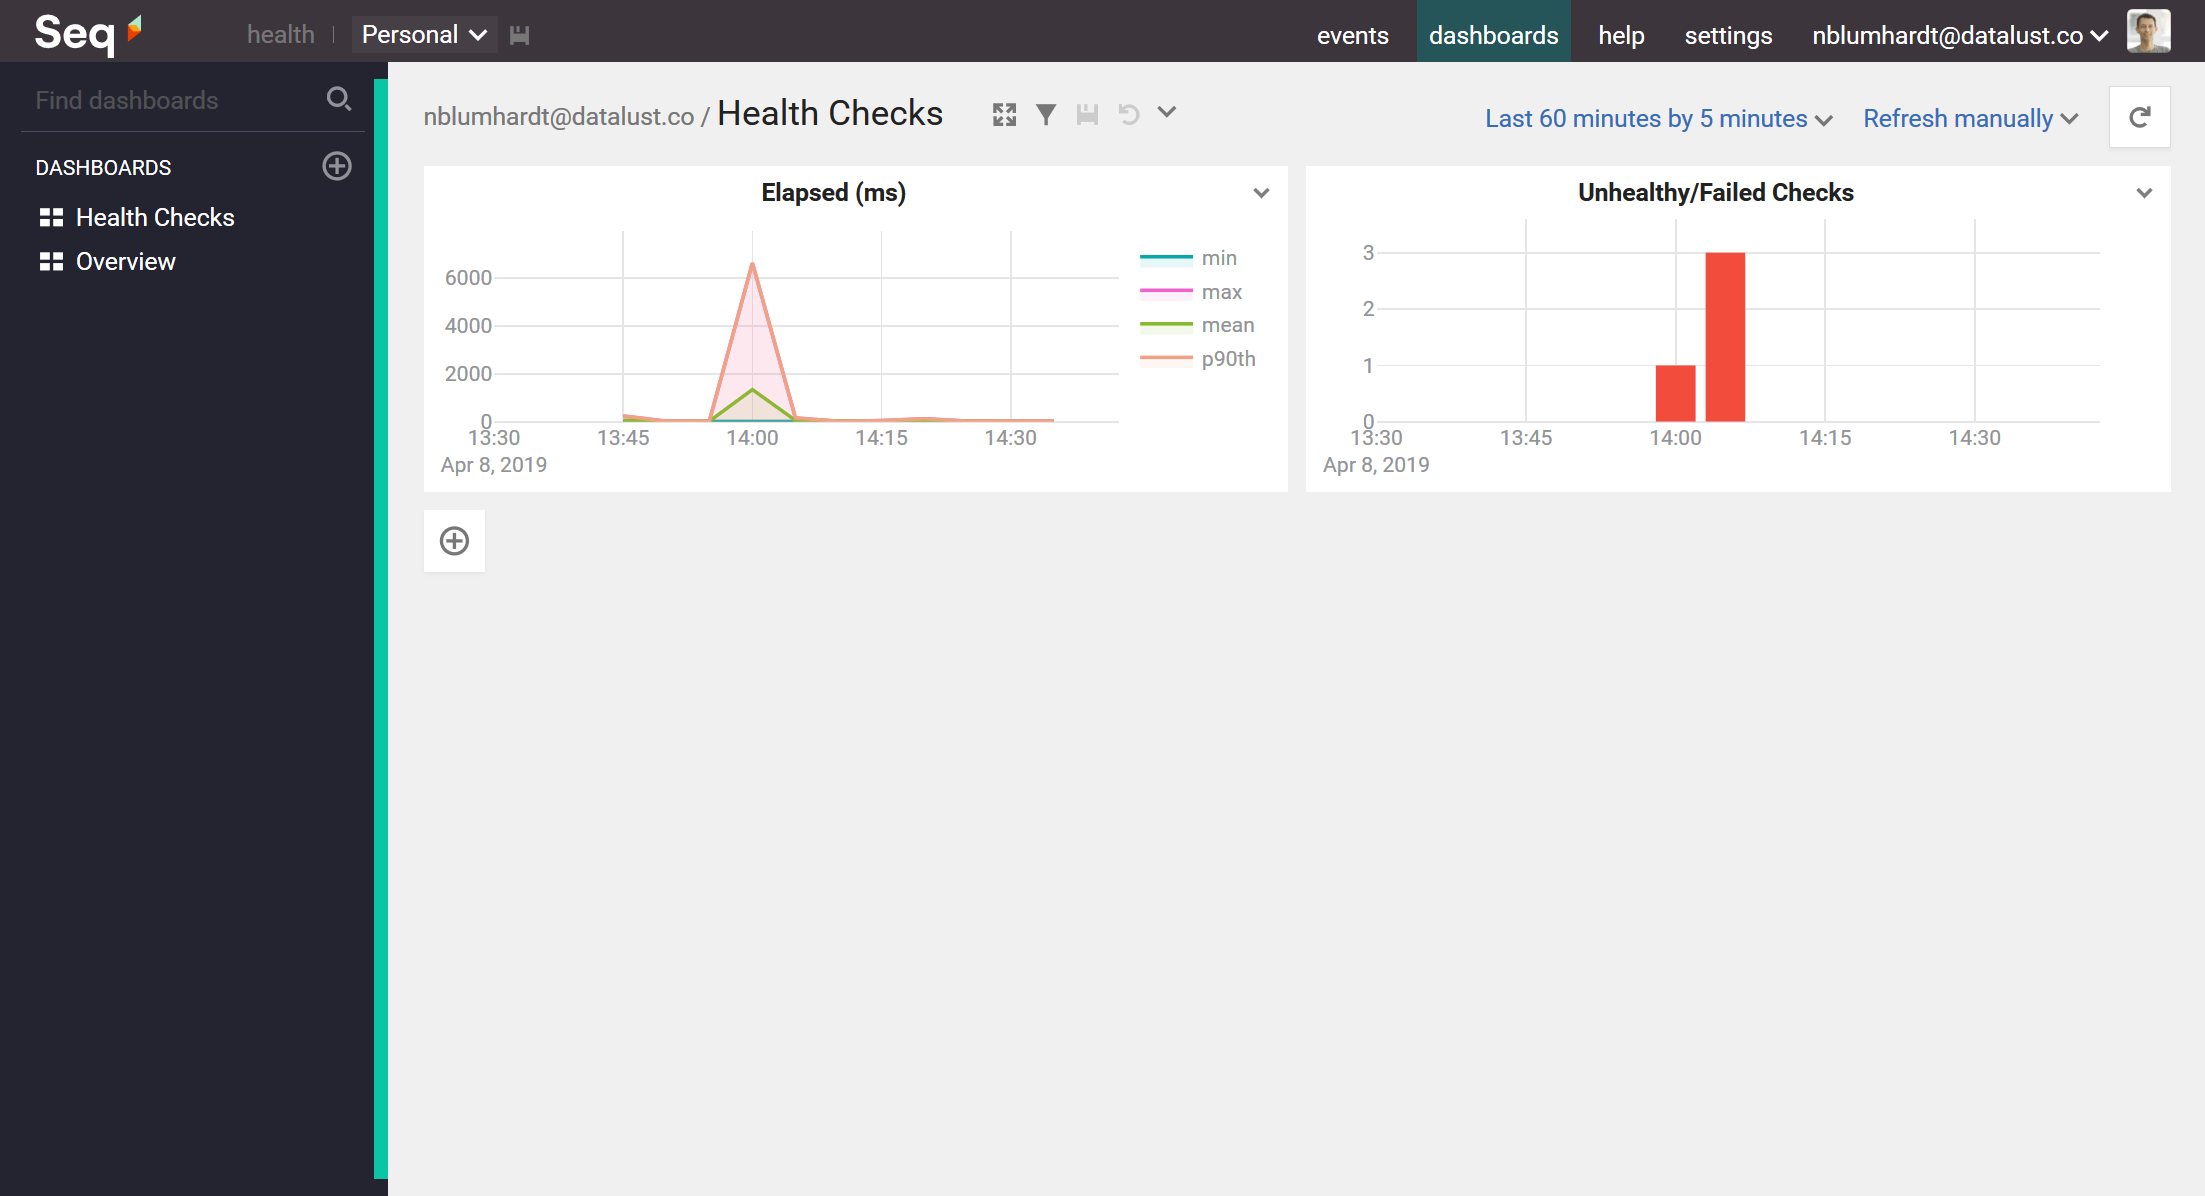
When the health check slows down, we'll see that in the first chart, and if health checks fail we'll see those in the second.
Our target application based on ASP.NET Core reports some problems using a
statusofDegradedin a 200/OK HTTP response. These cases won't be picked up in the Errors signal, so creating an additional signal with a filter likeData = 'Degraded'would be a sensible addition.
Alerts and notifications
Before you can find out about failing health checks or slow services, you need a channel for notifications. Set up an instance of the Slack, Teams, email, or a similar app, and configure it so that notifications reach you.
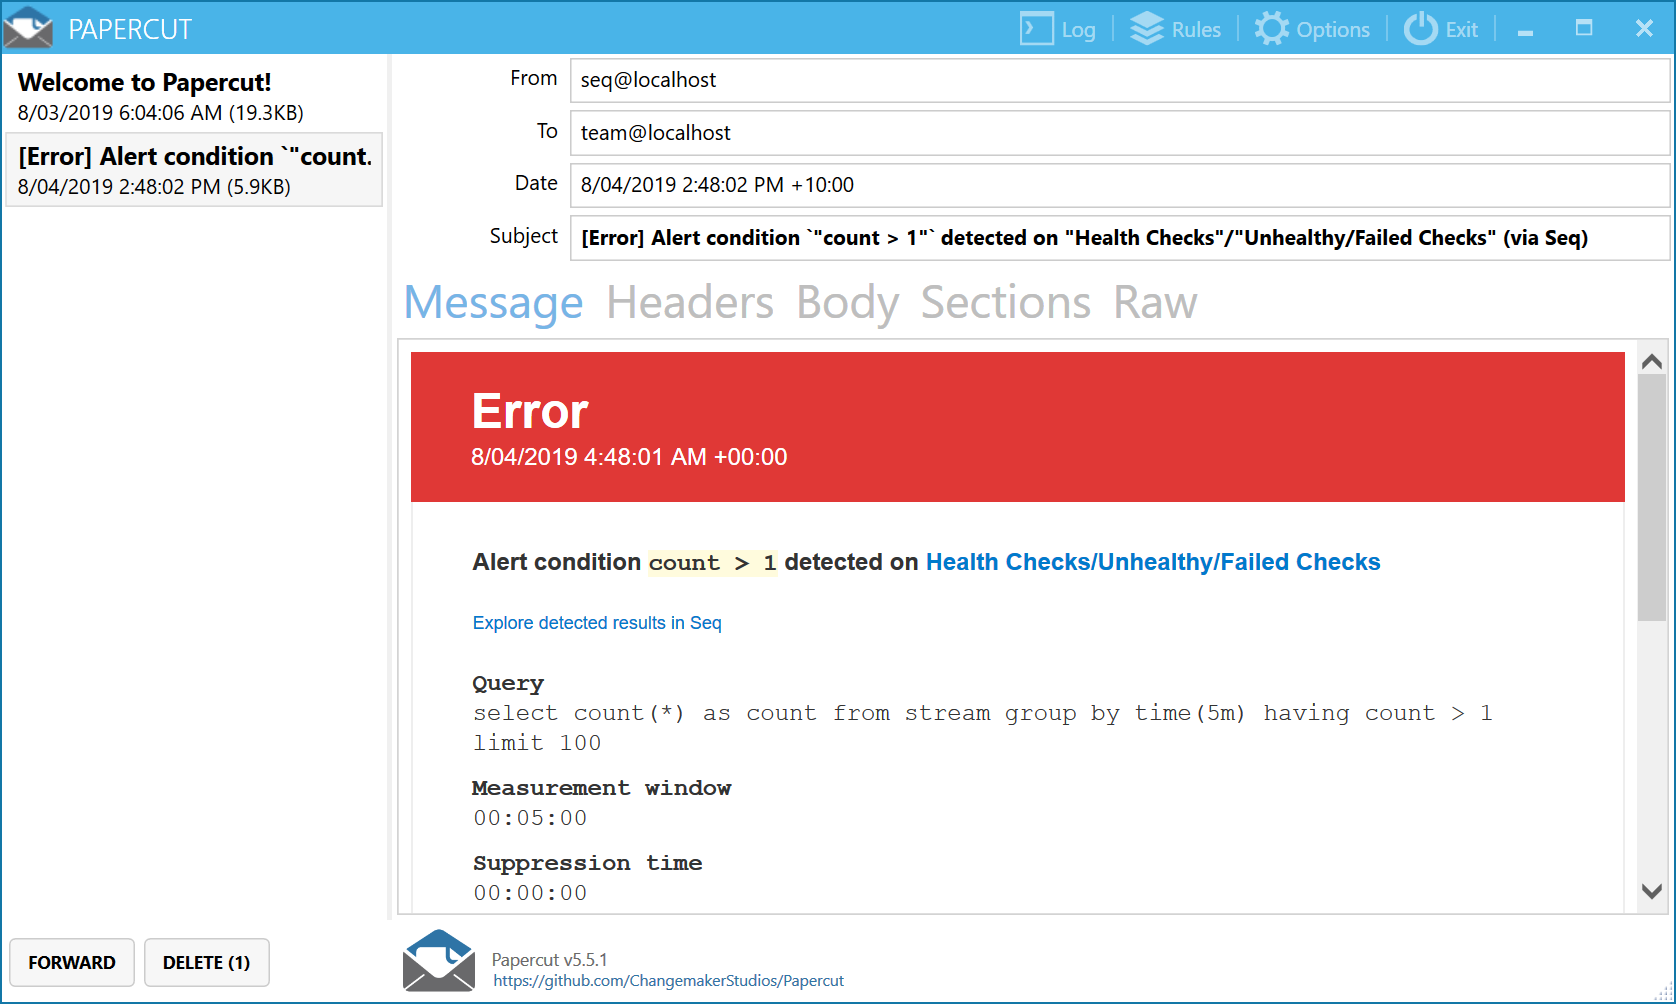
(If you're just trying things out, spin up the excellent Papercut email server on your local machine and point an email notification at that.)
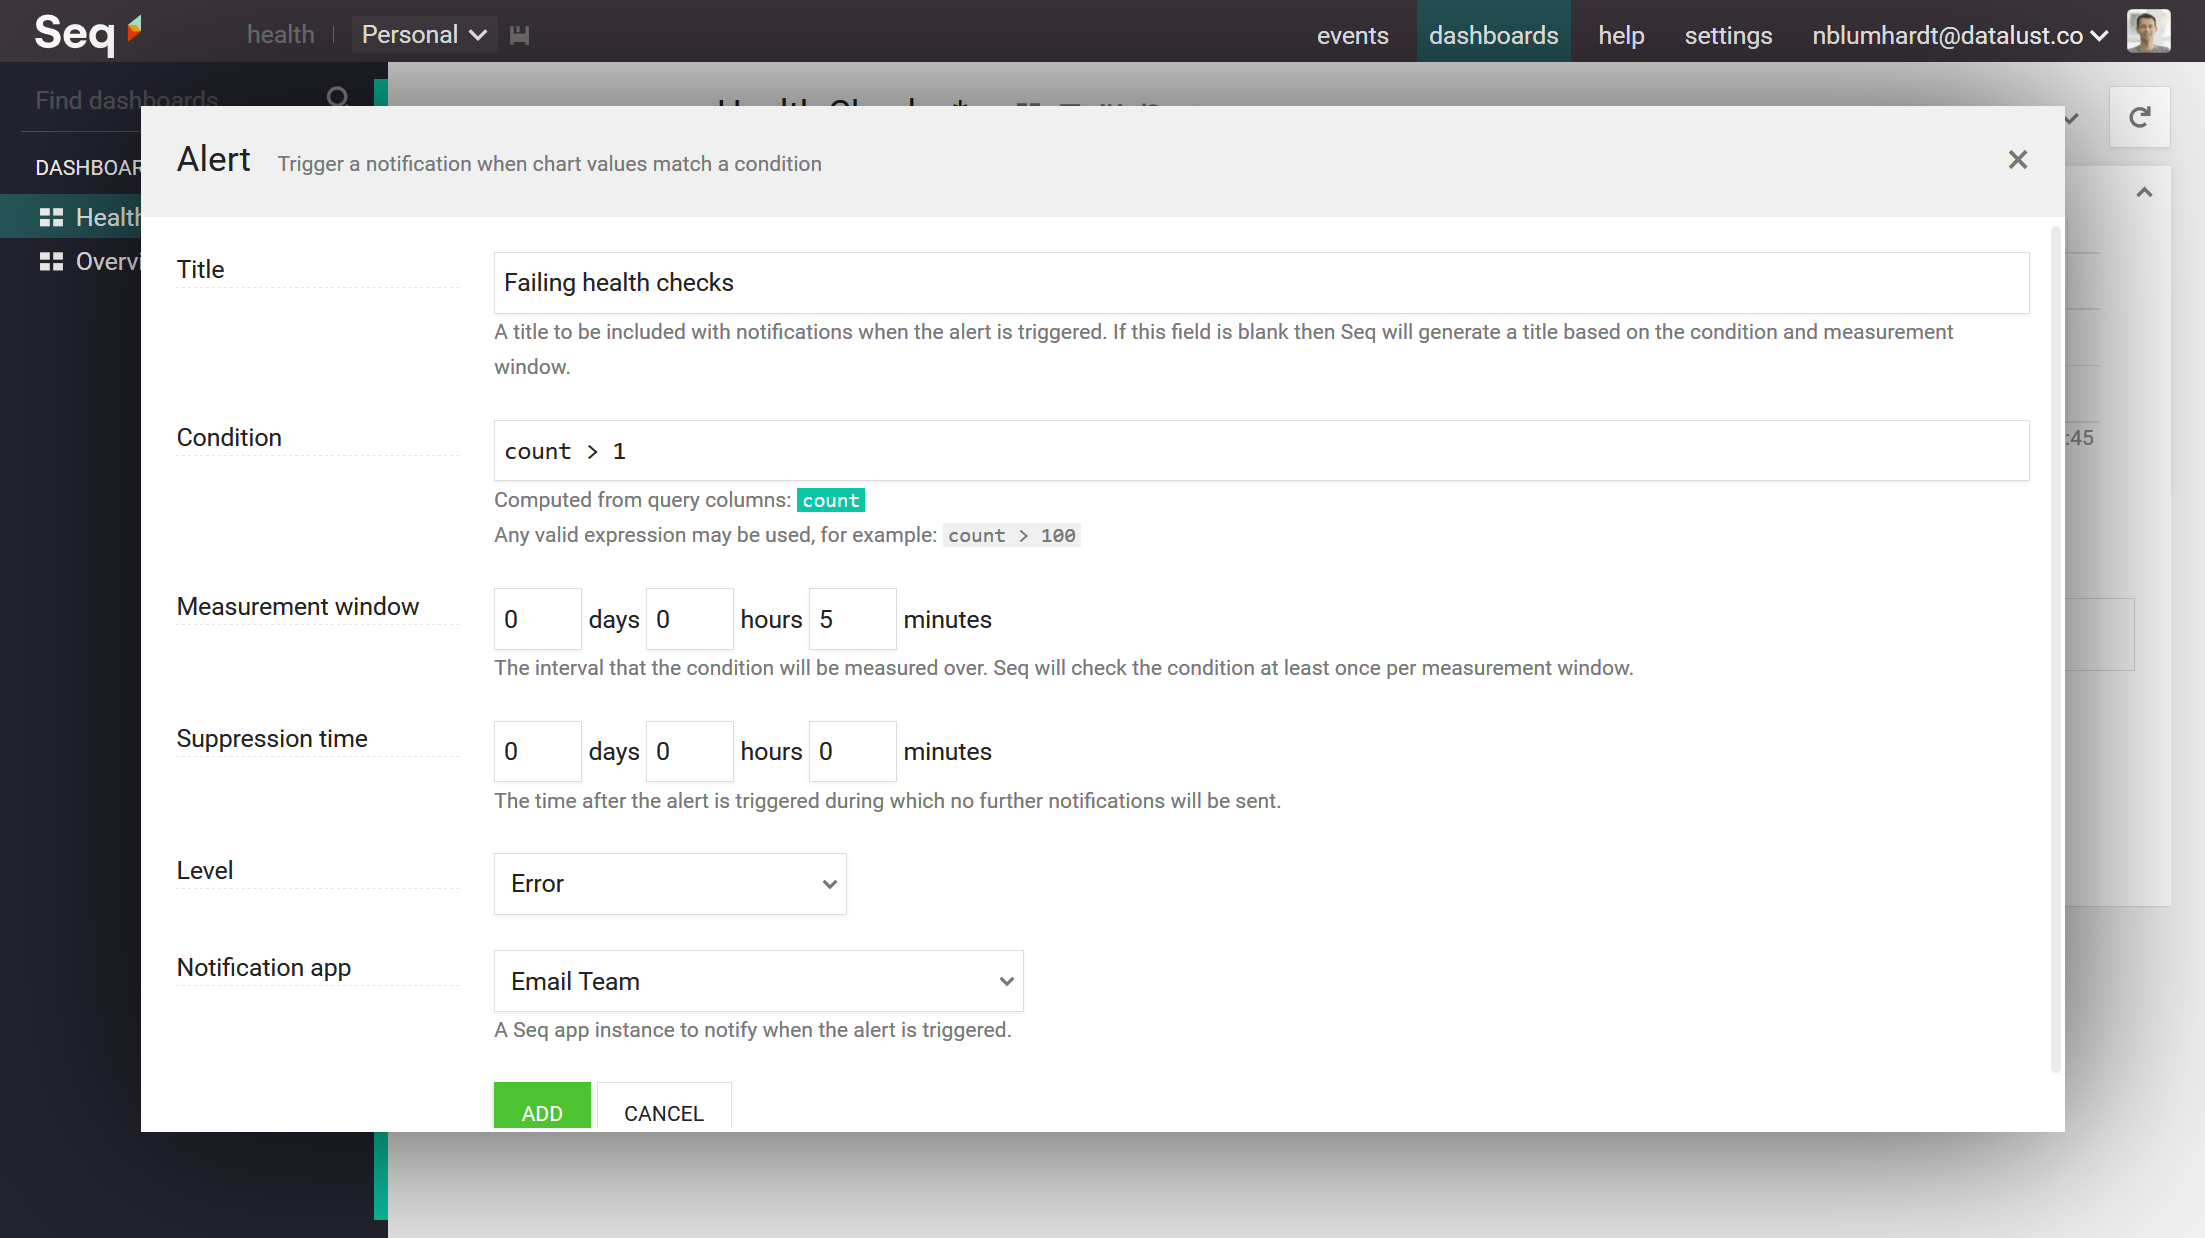
Alerts are added to charts; we'll set an alert on the Errors chart. On the Alerts tab, clicking + will prompt for details of the check and the notification app.
Our alert will fire if more than one single health check fails in a five minute interval:
Save the dashboard, and that's it! Let the health checks roll in, and hope that you don't receive too many emails like this:
The project
The source code for Seq.Input.HealthCheck is published on GitHub; we'd love to hear your suggestions for improvement over there.
Happy logging!